Month: October 2013

  • Charts I’m Watching: Oct 3, 2013

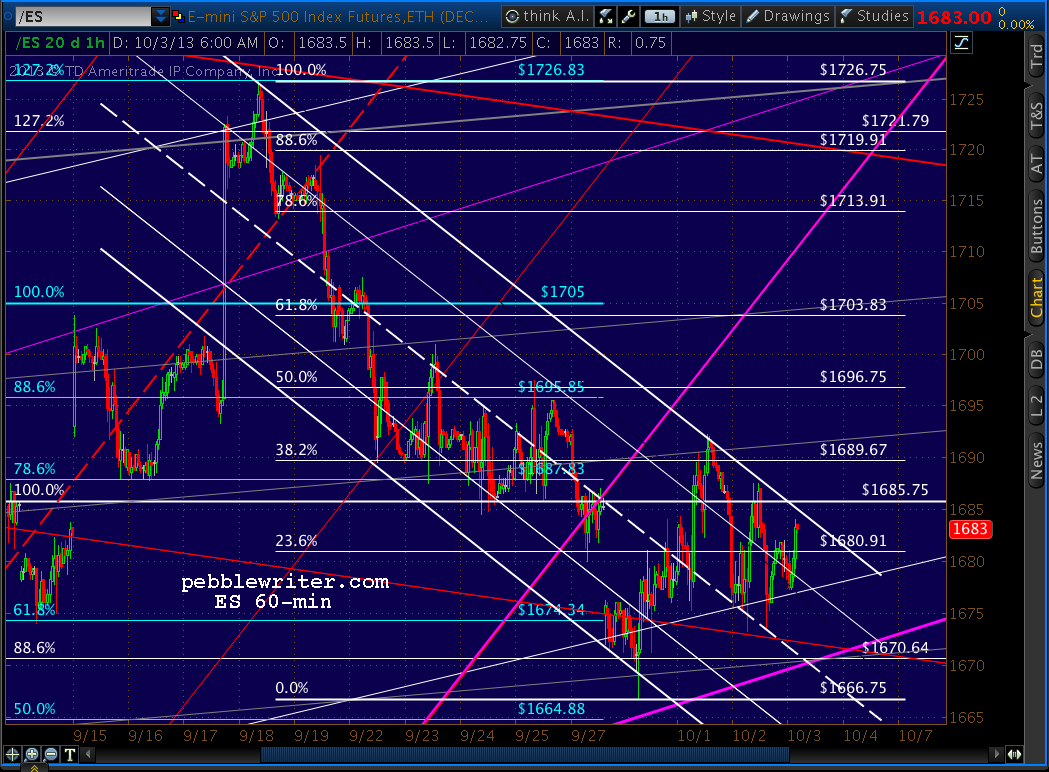
    After an overnight dip, S&P 500 futures are back to slightly positive at an expanded channel top.
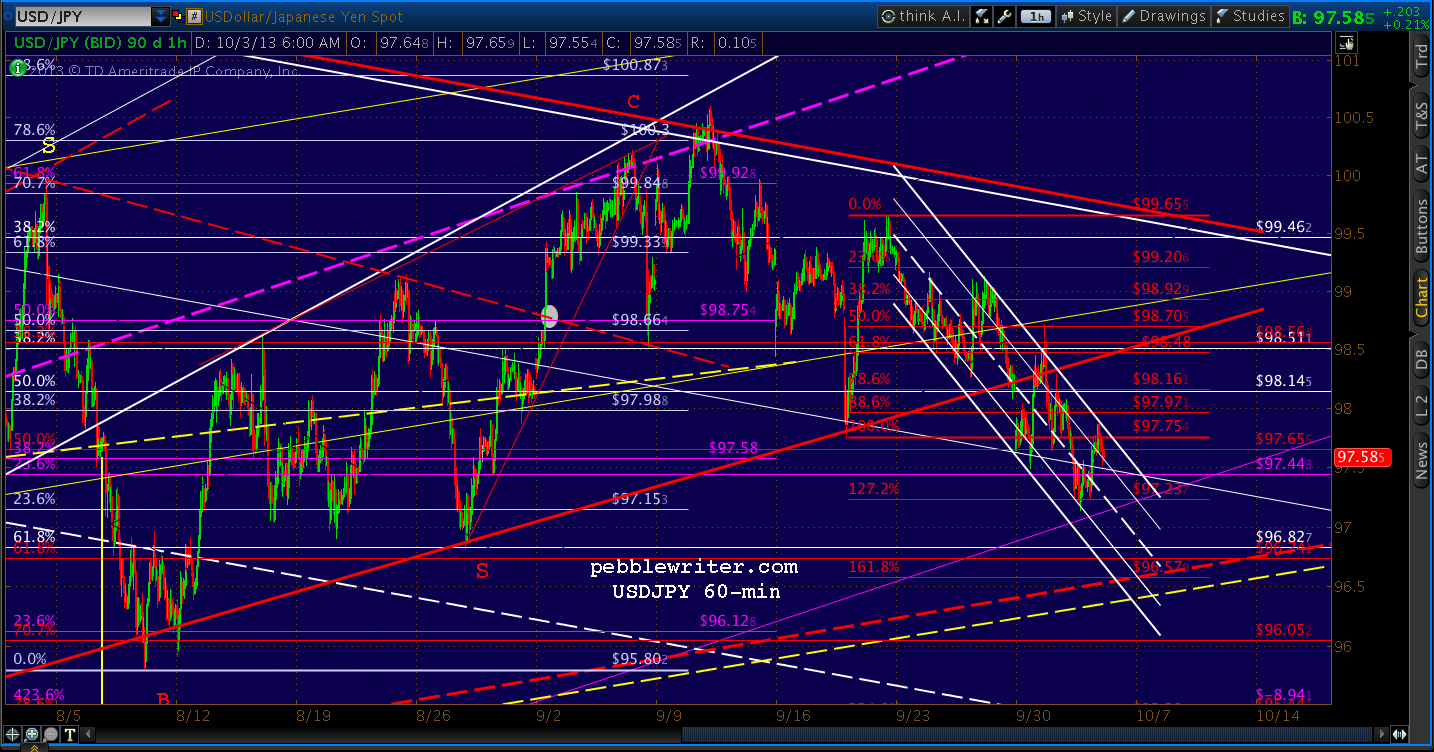
    USDJPY continues toward our Fib targets…
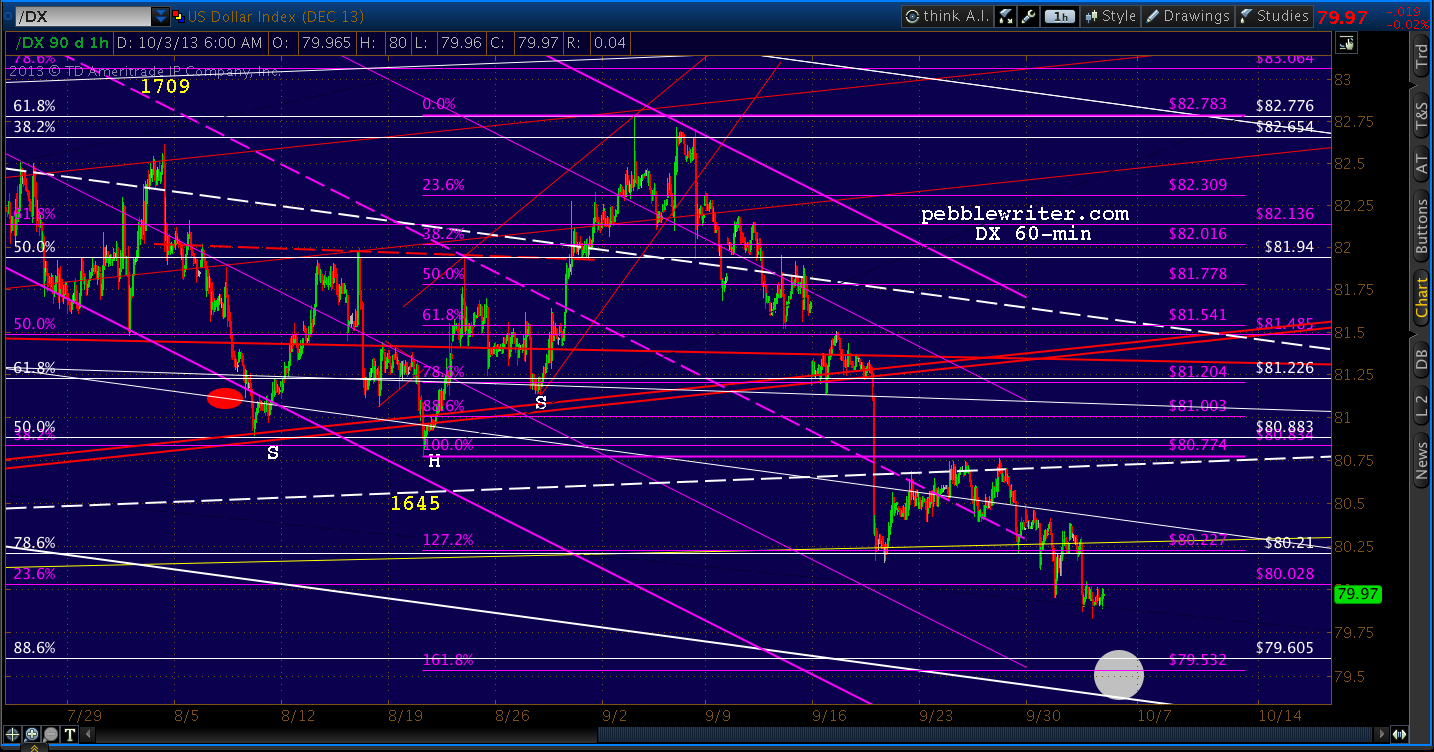
    And, DX is consolidating just below 80 on its way to our initial target.
    UPDATE:10:25 AM

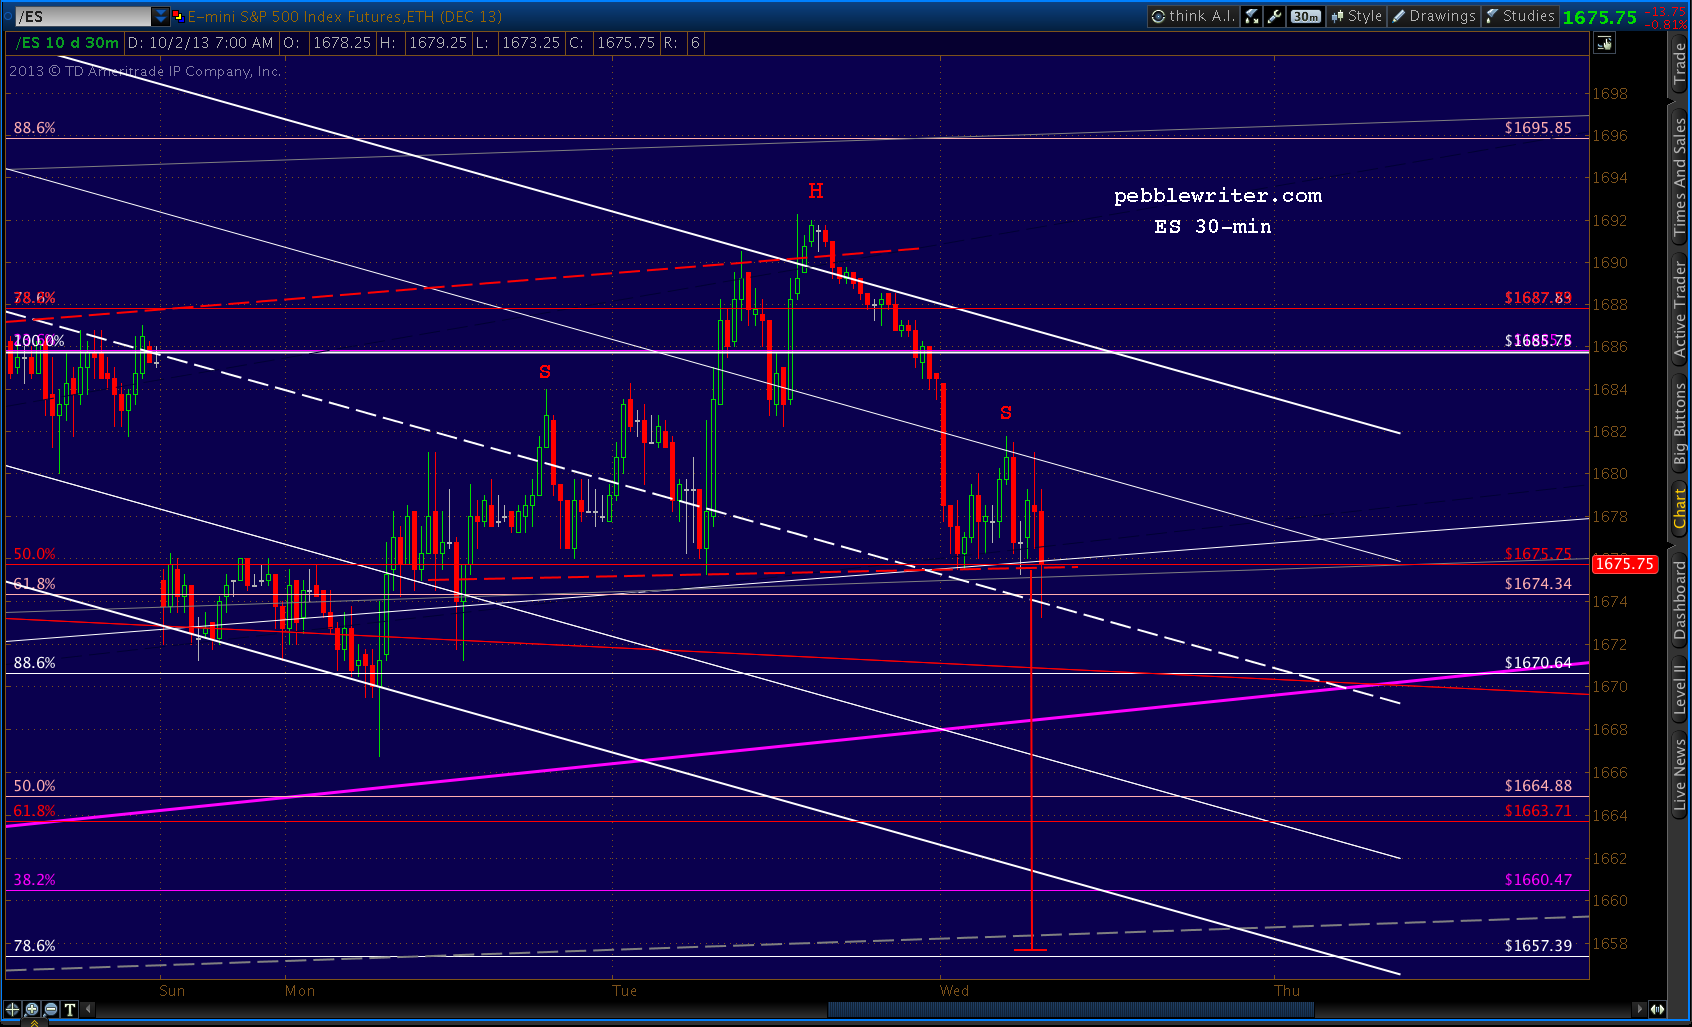
    Awfully close to a bounce at ES 1670/SPX 1677.45.  But, the following move might fool a lot of traders.
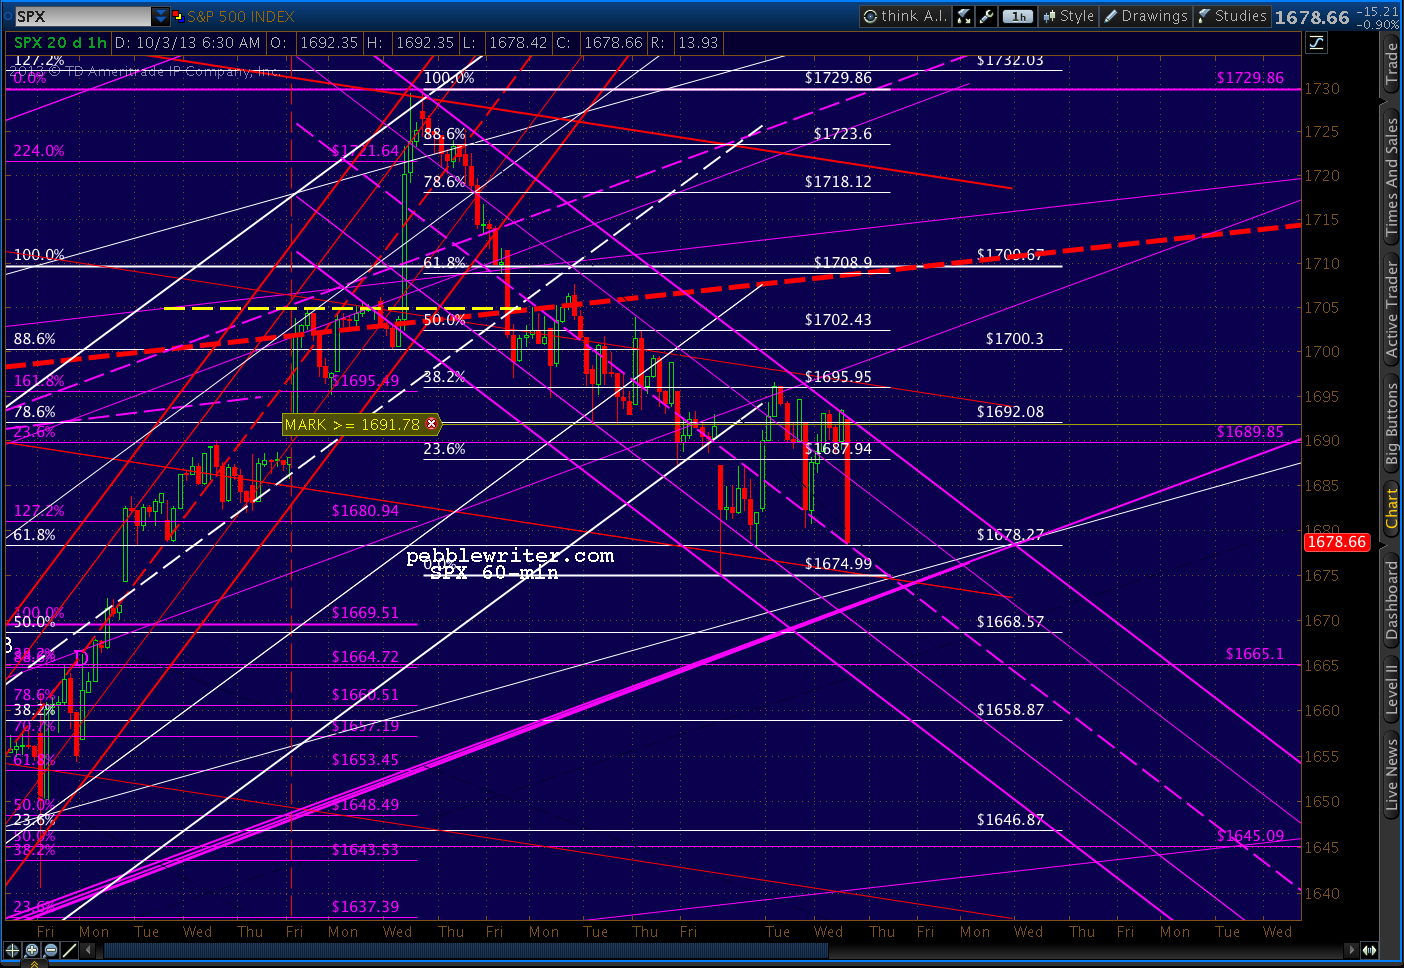
    Note the .886 tag coming up on the red grid — also the midline of the falling channel and the bottom of the purple channel.A dip below 1666.75 might normally be expected to open up a small Crab Pattern to 1650.99.  But, the larger pattern .618 is at 1663.71 (below in yellow) — only a slight breech of the purple channel bottom.  It could prove to be strong support — depending on what sound bytes are being delivered by CNBC at the moment.
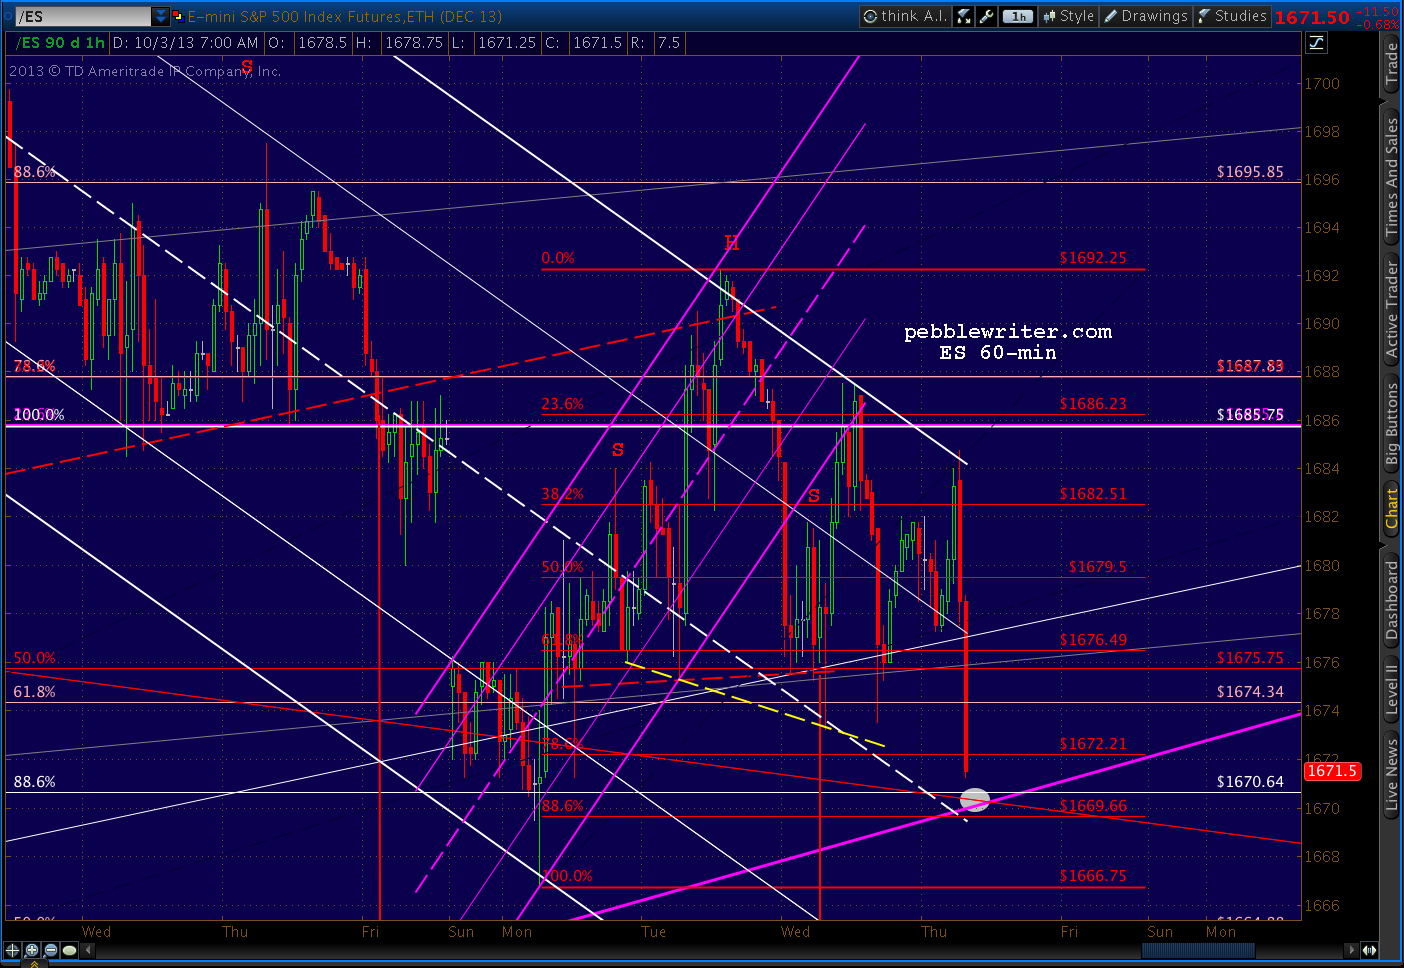
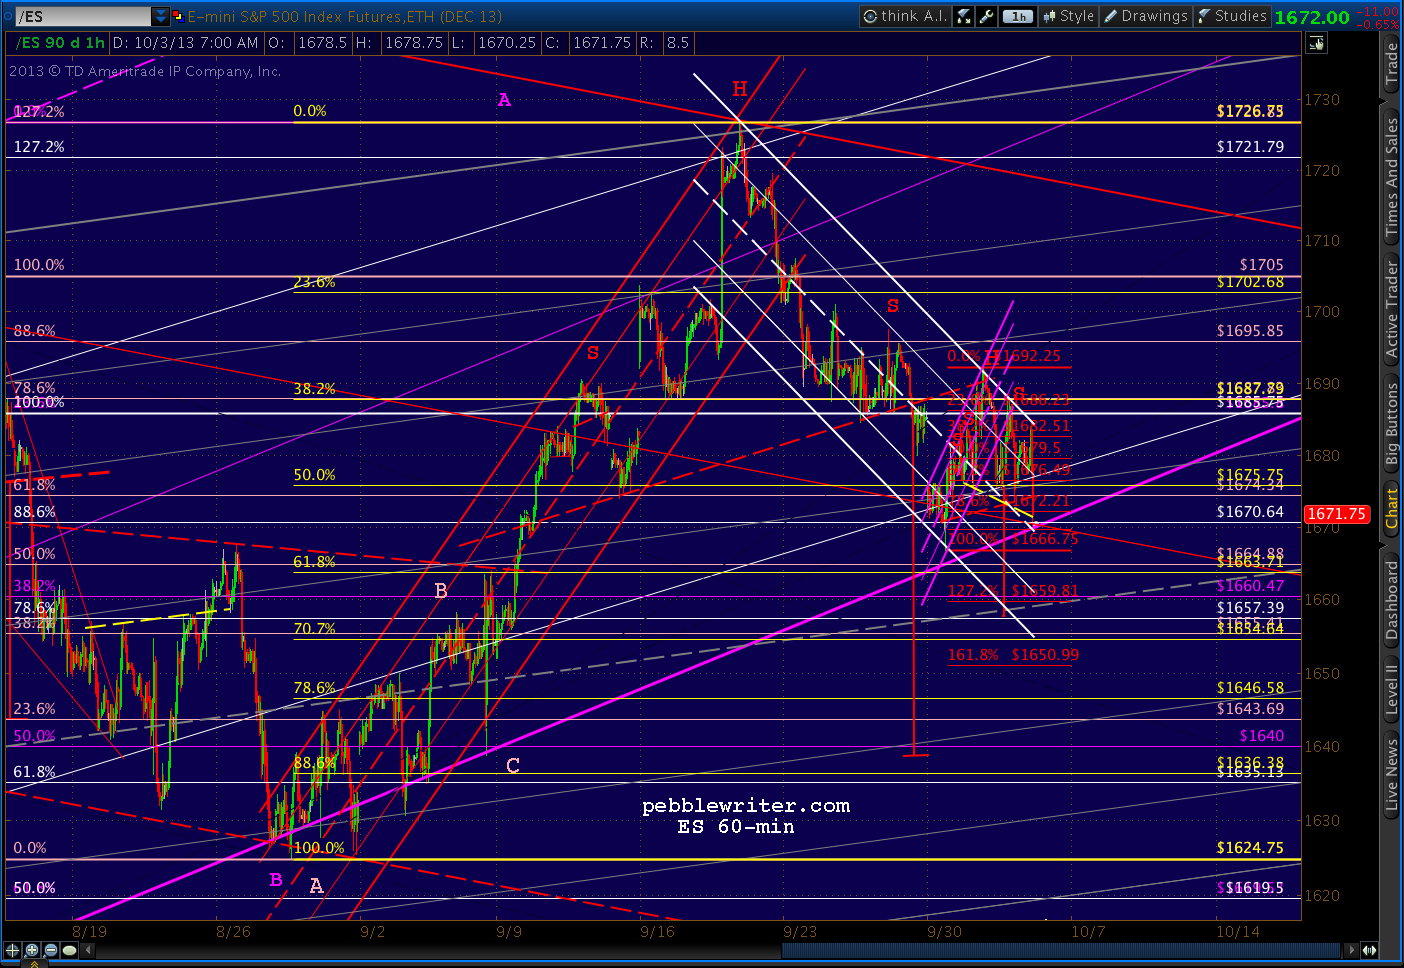
    The equivalent .618 for SPX is 1666.58.

    UPDATE:  11:30 AM

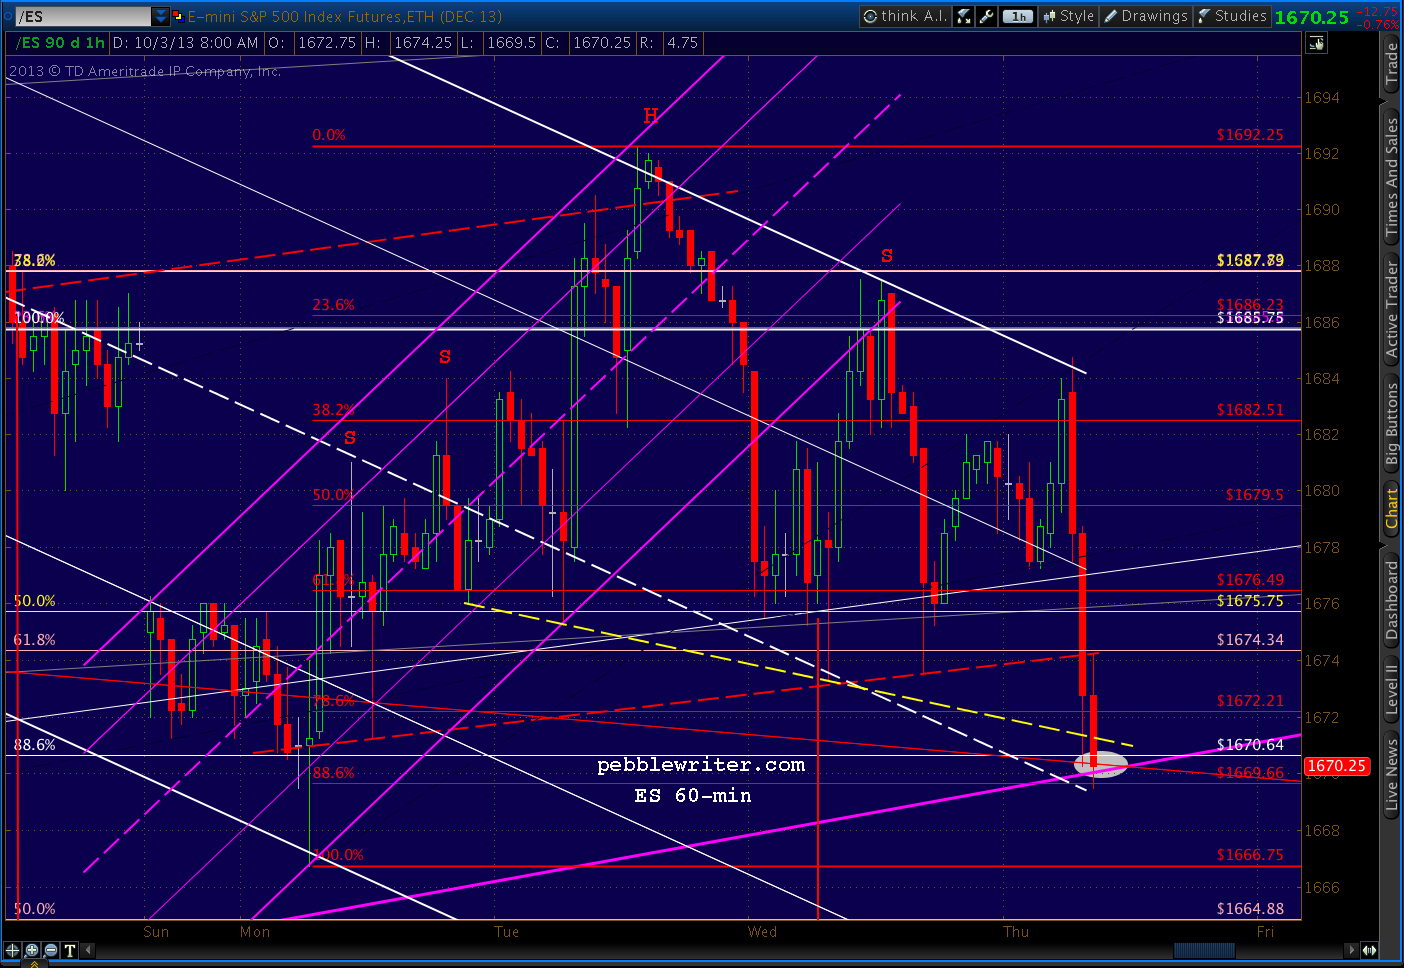
    There’s the ES 1669.66 tag.  Should be a nice bounce here.  But, watch out for the drop through 1666.75 to 1663.71 we talked about above.
    UPDATE:  11:50 AM

    Just dropped through ES 1666.75.  Next stop is the .618 at 1663.71 — though there’s no real good channel support there.  There are lots of other potential turning points, including my favorite from the 30th at 1657 and my new favorite of the yellow .786 at 1646.58.
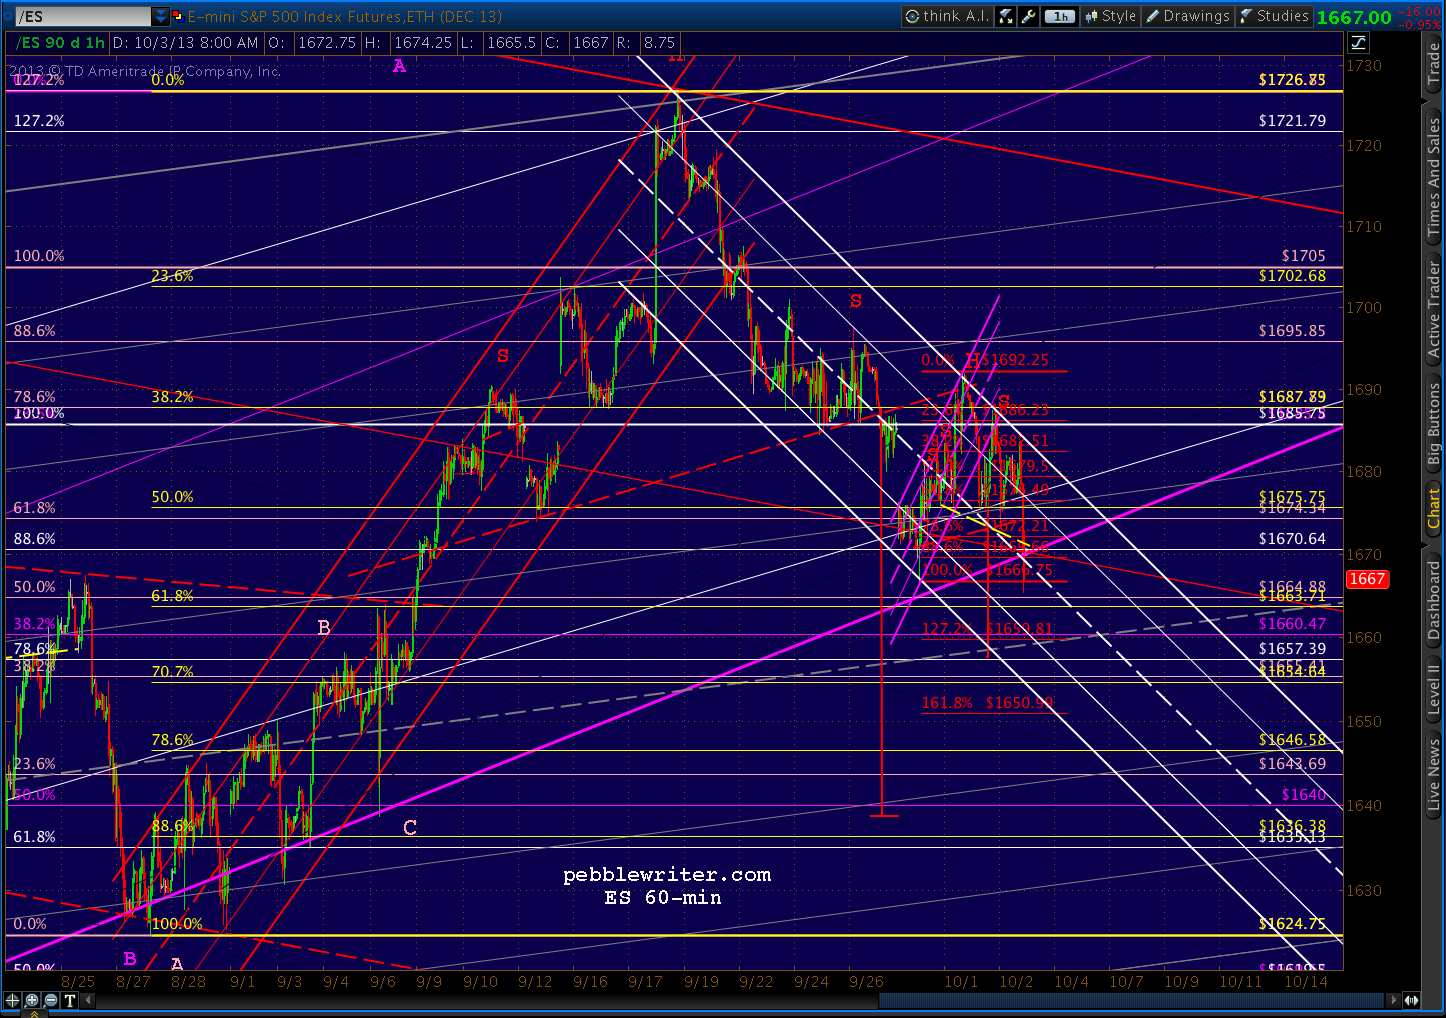
    Needless to say, if the purple channel line doesn’t hold, all those other targets open up — starting with 1590-1600.

    UPDATE:  11:59 AM

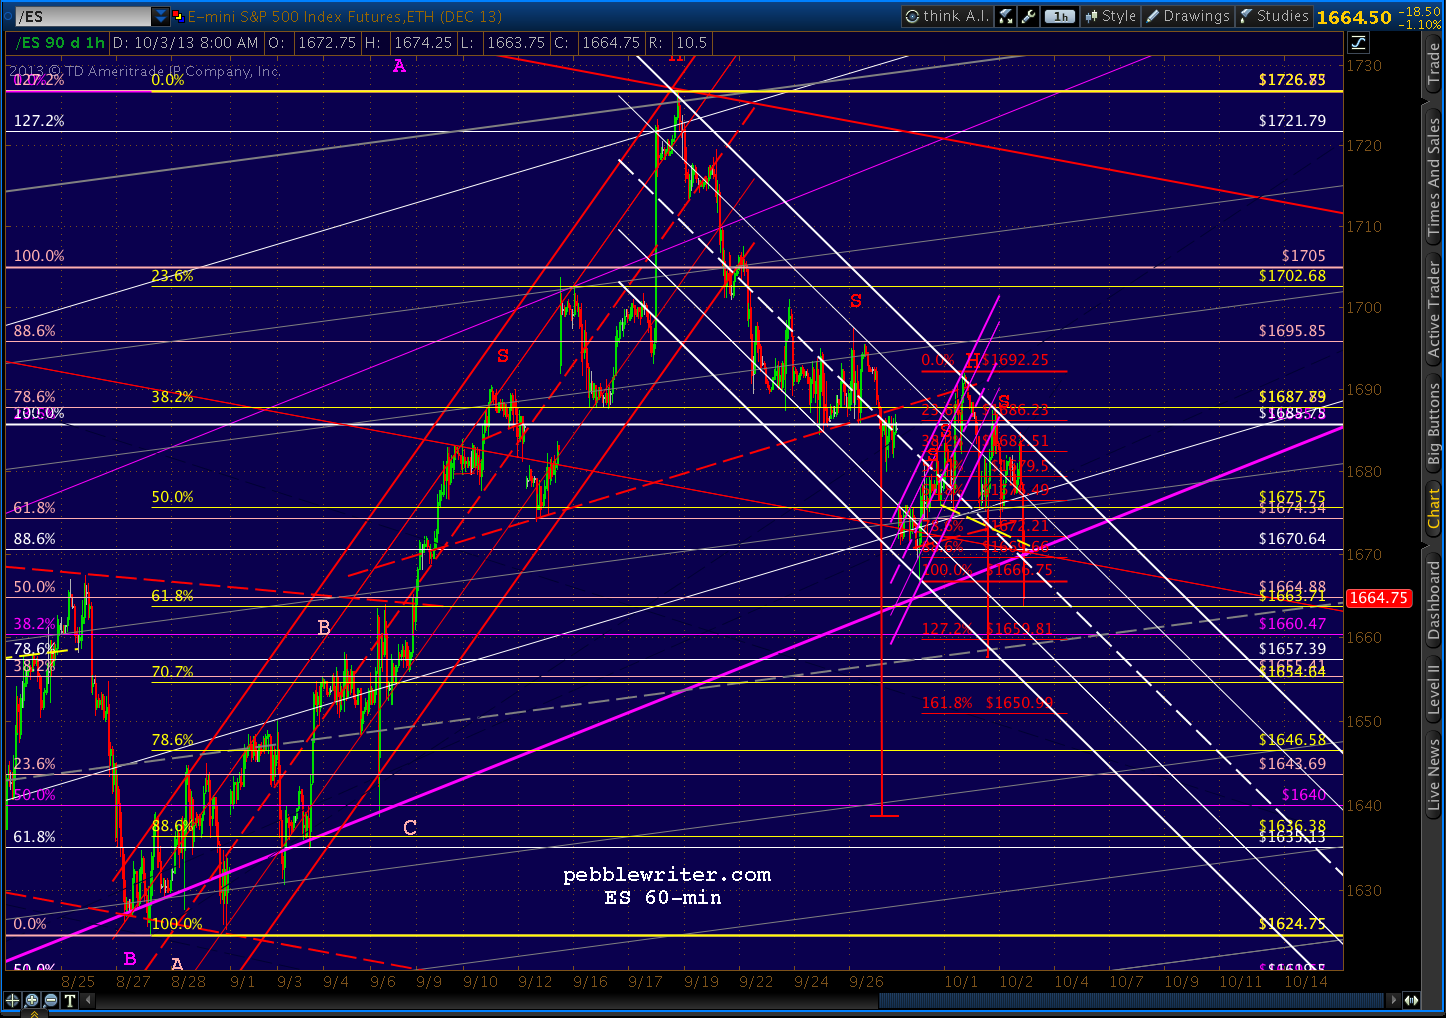
    There’s the .618 tag at 1663.75.  I’d look for a recovery here to at least the purple channel line — probably around 1670.  A failure to close back up there means the purple channel is kaput.
    UPDATE:  3:58 PM

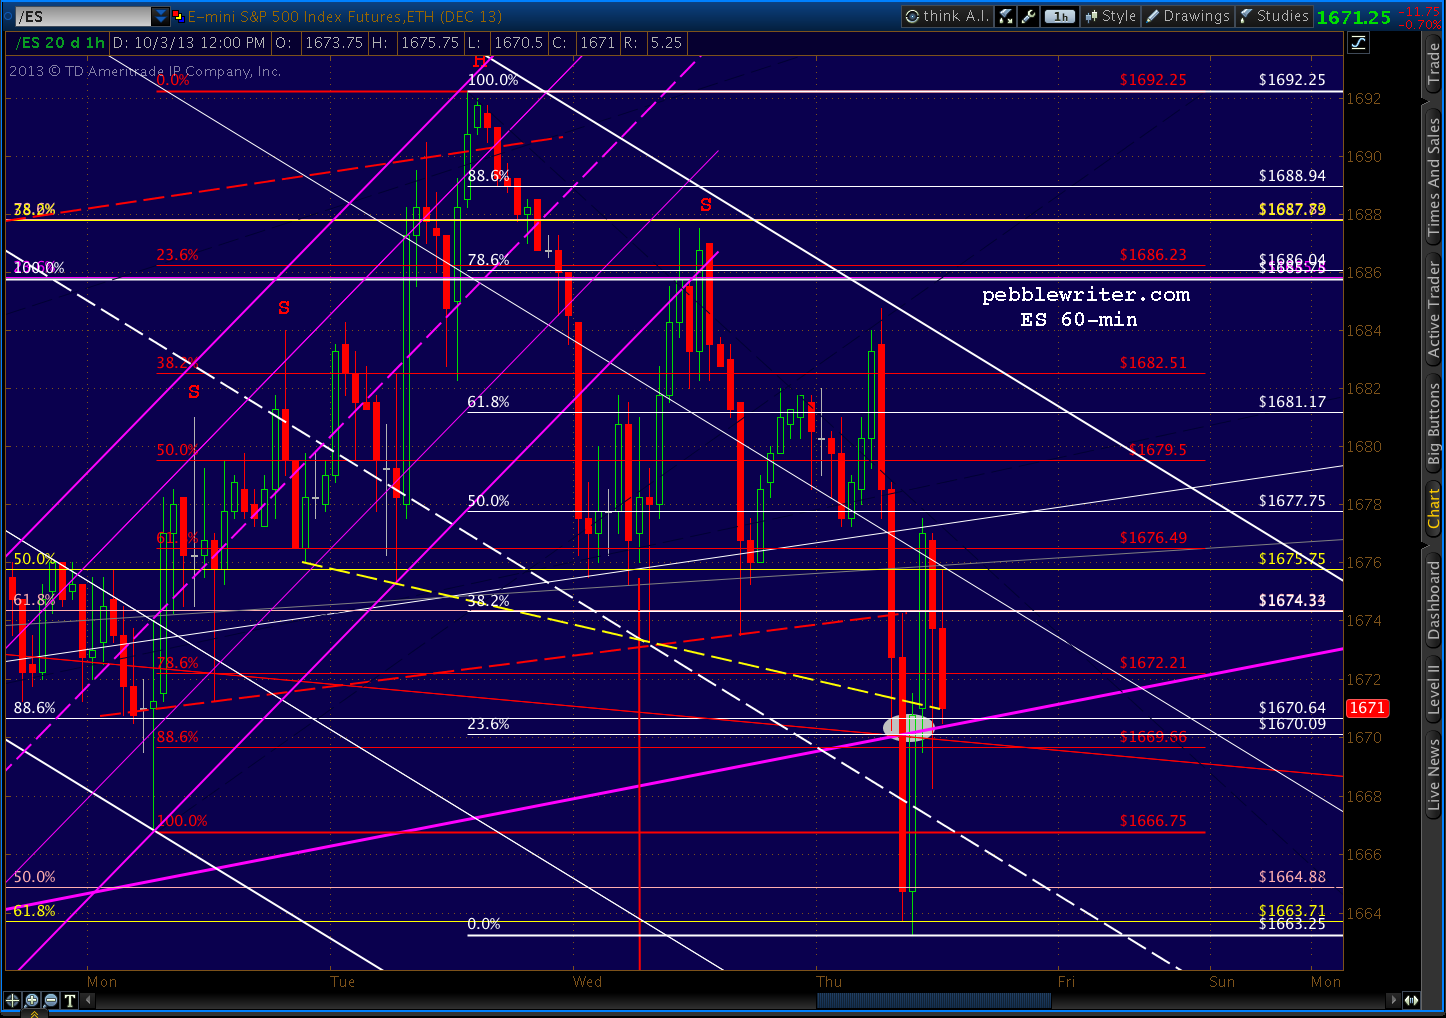
    Looks like a close right on the neckline of the latest (yellow) H&S.  For overnight traders, the purple line is the one that matters.  SPX is well above its purple channel line, so there’s room for a little downside overnight — say, 1671.
    I’ll be spending the rest of the afternoon filling out forms for the Fund — an unbelievable number of forms, actually — as we try to get all the accounts open asap.

    For those who have been waiting patiently, my best guess is that we’ll have documents as early as this afternoon or tomorrow, and wiring instructions as early as tomorrow or Monday.  With any luck, we’ll be up and trading by next Wednesday.


  • Charts I’m Watching: Oct 2, 2013

    The market is taking the shutdown a little more seriously this morning, with the E-minis currently off 11.5 points and the current falling channel seemingly intact.

    The market’s rise since Monday would make for a nice B-C leg of a Bat or Crab Pattern, but it’s too early to say.  I still like the red 1.272/purple .786 combo at 1590-1597, with a secondary target of the red 1.618/purple .886 at 1561-1573.

    Either would spell the end of the rising purple channel, but a tag on the white channel bottom is much more important and, in the long run, would do more for the bulls.

    DX is drawing very close to our 79.6 interim target — currently trading below the important support of 80 at 79.92.

    And, the USDJPY is selling off as expected — drawing nearer to the yellow midline at 96.34 and/or the neckline of the largest H&S Pattern (dashed, red) at at 95.80ish.

    UPDATE:  10:30 AM

    Lots of little — and, not so little — H&S Patterns setting up.  The latest targets 1657ish.

    UPDATE:  12:20 PM

    ES got a bounce up through the neckline and is backtesting the broken purple channel — probably to the purple .618 at 1685, with a secondary target of the .786 at 1688.

  • 8 Points

    That’s how much the S&P 500 futures initially sold off after Congress missed the official deadline last night.  Kinda sums up how much confidence we have anymore in their ability to accomplish anything.

    There should be some follow-through — same downside targets as yesterday. Though, look for the falling channel top to also be tested in the cash markets when they open.

    The dollar has almost reached our 79.60 target from Sep 20 [see: Quick Update] — briefly dipping below 80 this morning.

    This is a somewhat optimistic target, as the potential for a much larger drop is very real.  When the rising red channel from April 2011 broke down on the 18th, it opened up many lower harmonic targets.

    The most appealing one on the chart is 75.18-75.45.  This represents a .786 retrace (white grid above) of the red channel’s rise from 72.86 to 84.97, and dovetails nicely with the 1.618 extension of the smaller Crab Pattern in purple.

    It’s too early to estimate the timing, as neither the falling white nor the falling purple channels are very well developed yet.  For now, I’m assuming around the end of the year — though it could easily push into April 2014.

    Keep in mind that 80 is an extremely important level of support for the dollar index.  The Apr 1995 low of 80.14 marked the beginning of a 6-year rally that peaked at 121 in Jul 2001 as stocks were almost midway through their 2000-2002 crash.

    UPDATE:  10:23 AM

    SPX just reached the top of the falling white channel at 1691 (ES 1685) — great place to be short (with tight stops, of course: SPX 1696ish.)

    UPDATE:  3:55 PM

    With SPX about to close 10 points higher, I’d have to congratulate the PPT.  But, even the last-minute ramp job couldn’t produce a breakout.  I’d have no problem holding short in the E-minis overnight, as SPX only briefly peeked above 1696 and slipped right back down.

    The E-minis themselves backtested yesterday’s H&S neckline at the top of a channel, but couldn’t hold the level and appears to be done (for now.)  The pattern looks like a breakout, smells like a breakout, even quacks suspiciously like a breakout.  I just don’t think it is.

    I think it’s more of a fakeout, but would suggest stops in the 1696 range just in case.  Wouldn’t be the first time I out-thunk myself.

    The USDJPY should have at least another 1.30 to go, and I wouldn’t be surprised to find that today’s rally was more about relief at not having crashed and burned than optimism about political prospects.

    Don’t get me wrong.  If/when the Grupps get their act together, the rally should proceed with all due haste.  I just don’t see it happening just yet, and the charts offer just enough of a hint that I’ll give the bearish position a little more rope.

    Keep an eye on DX, which really should tag 79.52 before stocks turn around.

    GLTA.