

Month: August 2013

  • Charts I’m Watching: Aug 30, 2013

    Back in Carmel, where today’s high temperature should be a perfect 70 degrees (21 C.)  LA was great, but I had all the 105 degree days I need for a while.  Best wishes to Bella and Ed on their nuptials.  Thanks for including me!

    *  *  *  *  *

    SPX reached our 1636.81 reversal target as expected yesterday afternoon.  The eminis are up 3 pts this morning on disappointing economic news (bad is still good), so shorting at 1644 and going long at 1636 appears to have been the right decision — for now.

    As we discussed yesterday, a reversal at the red .786 might have been a set up for a bearish Crab Pattern down to 1620.84.   If so, prices should stay south of 1646.41.   We’ll watch to see how the market reacts to Chicago PMI at 9:45 and Michigan sentiment at 9:55 AM.

    Stops at 1636 just in case, as a reversal at the .618 could also produce a Gartley at the .786 or Bat at the .886.

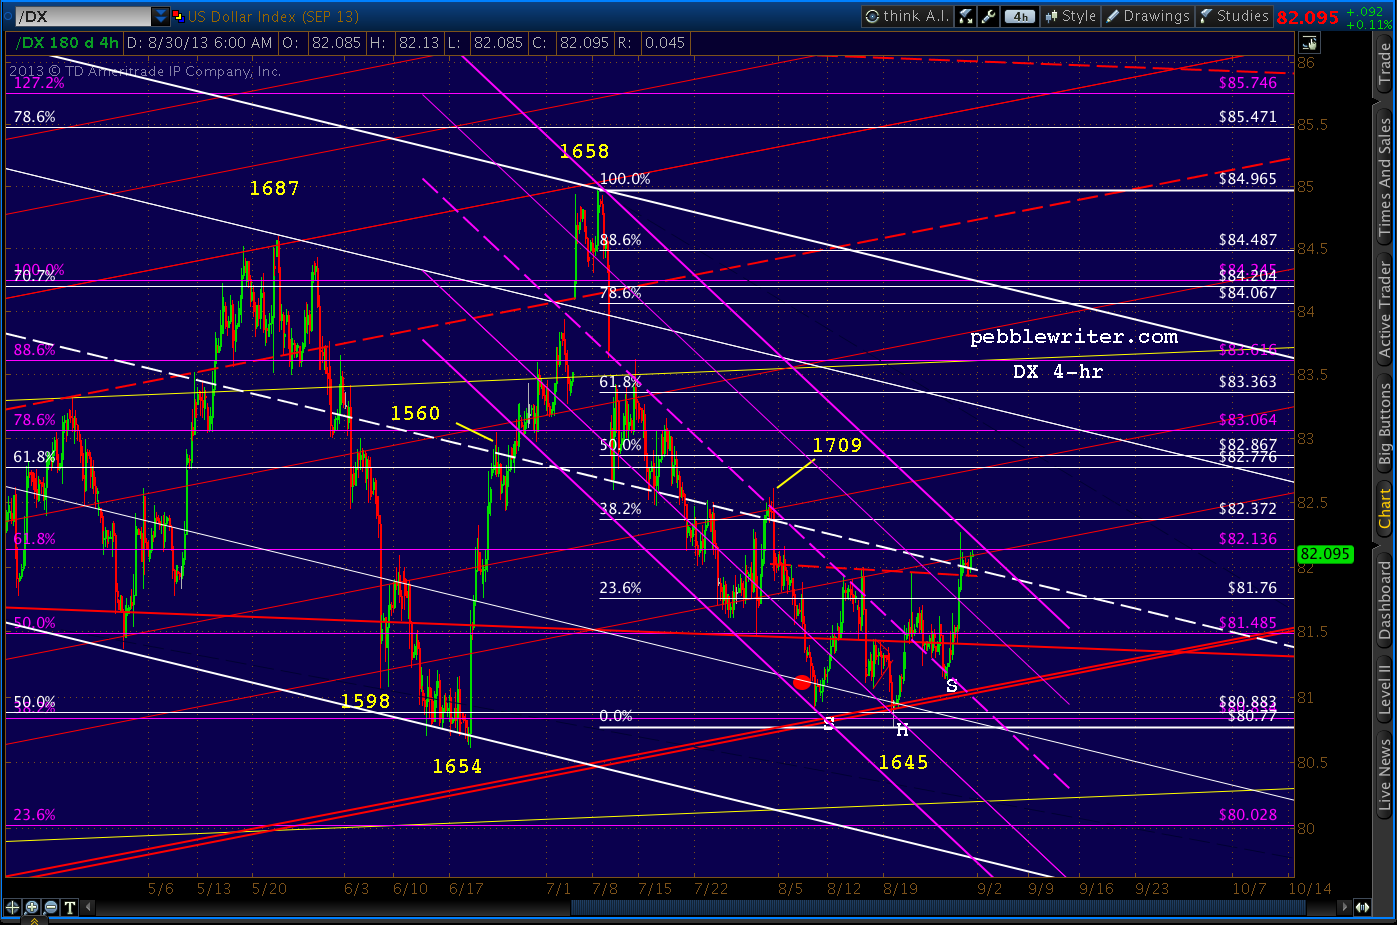
    The dollar reached the purple channel’s upper bound as expected — also the midline of the falling white channel and the rising red channel .146 line.  Also note the completed IH&S Pattern.  To say this is a critical moment for DX is an understatement.
    UPDATE:  10:02 AM

    Stopped out on the long position, so I’m switching to short here at 1636.

    As mentioned above, there’s a good chance of some serious whipsawing here.  Completion of a Gartley or Bat Pattern would mean another reversal at 1634.20 or 1632.65, which would establish nothing until we get a breakout or breakdown.

    A drop below 1630.88 would help the 1620.84 scenario.  Note the grey 1.618 in the same vicinity (1621.28) as the red Point D.

    Right now, SPX is sitting at the bottom of the purple channel.  So, the downside could pick up steam quickly if it’s breached.

    A breakout above 1646 would be a great start for the upside, but the direction wouldn’t be all that clear until we top 1669.51.

    The 60 min RSI isn’t all that helpful.  The red channel is bearish, while the purple is bullish.  Based on this chart, my preferred view is a strong intra-day dip to the purple channel bottom on positive price divergence, putting in a distinctive bottoming candle for the day at 1620.

    But, it is the last trading day of the month.  Wall Street hates to close out a month on a negative note (bad for business.)

    The daily RSI shows strong potential support at the bottom of the red channel that dates back to the 2011 lows.  No divergence there, as the tags have come at increasingly higher prices.  But, the low on Aug 27 followed another two quite closely — the first time that has happened in quite some time.

    At the same time, RSI was tagging the bottom of the falling white channel, which shows nothing but divergence. The succession of lower lows in RSI accompanied much higher lows on SPX: from 1401 on Dec 28, 2012 to 1560 on Jun 24 and now 1645, 1639 and 1629 on Aug 19, 21 and 27.

    Similarly, the three declining tags on the top of the white channel have accompanied higher highs on SPX: one each in the 1500s, 1600s and, a few weeks ago, the 1700s.

    The top of the purple channel also shows plenty of divergence.  Since the Nov 2010 tag (SPX 1227) the RSI highs have continued to decline even as SPX itself has risen.

    Divergence is a funny thing, though.  It can continue for a long, long time until rectified.  So, I don’t ascribe too much importance to the daily charts other than to note when RSI moves through a key channel line such as the drop through the yellow/purple midline this month — always a negative sign.

    The fact that RSI went on to register two successively lower lows and hasn’t been able to break back above the midline is also negative.  The fact that it’s occurring in the context of higher rates, tapering, a looming deficit battle, etc certainly raises the stakes.

    UPDATE:  11:15 AM

    SPX just tagged the grey .886 and bounced.  Keep an eye on the falling white channel for signs of a break out.

    Also, remember that 1620 itself isn’t the most likely target if SPX does take a dive.  The purple .618 is just below there at 1617.27, and — being on a larger scale — makes a much more appealing target.

    And, if such a dip didn’t recover intra-day, our A:B = C:D scenario starts to make a log to sense.  An exact replay would put SPX at 1582 on Wed Sep 4 (the yellow D.)  It’s a 3% move (each way), so I’d really like to see it play out.

    In fact, short of a break out today, I’ll probably go into the weekend short in order to be positioned properly (not recommended for nervous types, hedging recommended.)

    UPDATE:  1:15 PM

    Backtesting the purple channel bottom?

    UPDATE:  3:55 PM

    I’m tempted to hold short over the weekend.   The near-term looks quite negative from my standpoint — with those 1617 or 1577 targets looking particularly tasty.  But, I’ll cover my shorts here at 1631 and go to cash over the long holiday weekend just to be on the safe side.

    I’ll write more later.  Have a great weekend everyone!

  • Charts I’m Watching: Aug 29, 2013

    SPX finished the day very close to our initial target for the corrective wave, the bottom of the red channel and the .500 Fib at 1634.28.  Importantly, it closed within the large purple channel.

    I’ll look for an opportunity to go long this morning, probably at 1628-1632.

    The futures are off slightly, so there’s a very good chance SPX will complete the little Bat Pattern it has started to the .886 at 1628.96.

    The eminis are back within their purple channel as well, and could be done with the correction after tagging the .786 at 1627 or .886 at 1626.   However, I can’t rule out a small Crab Pattern intra-day to intersect with the purple .618 at 1611.37.

    The dollar broke out of its channel, completing its IH&S and running up to tag its .618.  It just backtested its neckline.

    If the fear trade and/or the emerging market debacle continue, it should be making a major reversal here at the bottom of the red channel.  But, there’s clearly resistance to be overcome.

    UPDATE:  9:33 AM

    Going long here at 1632, stops at 1627ish.

    UPDATE:  11:22 AM

    Potential resistance here at 1646, the red .786 and top of a possible new rising channel.    Note there’s a gap to fill at 1656.  The .707 at 1657.19 looks like a good short-term target.

    UPDATE:  12:33 PM

    Getting some weakness off that resistance.  I’ll play the downside for possibly 1636 or more.  Stops at 1647.

    UPDATE:  2:29 PM

    The market has seemingly nodded off… I have to duck into a meeting for the next 1-2 hours, but here’s my expectation:

    SPX continues to follow the tiny white channel to the .500 or (more likely) .618 at 1636.81, at which point it should reverse and move higher.  I would take profits there and switch long, but with stops at 1635 in case it goes on to tag the .886 or (more likely) the .786.

    If it reverses by 1630 or breaks out of the white channel, I’d be long — looking for 1638+. Any dip below 1627 is likely headed for 1621.

    GLTA.

  • Charts I’m Watching: Aug 28, 2013

    ES lost all its overnight gains and is trending lower.  Note the reversal off the falling yellow channel midline.  Will the PPT come to equities’ rescue?

    It appears likely to reach the combination small Crab Pattern completion at the 1.618 and larger purple .618 at 1611 — perhaps even on an intra-day basis — if it can’t hold current prices.

    Though, as I showed last night, the eminis are currently sitting at the bottom of the purple channel.  So, any venture lower stands a decent chance of reversing.

    I’m staying short on the opening, but watch out for the possibility of the channels to trump the harmonic influence.

    UPDATE:  9:39 AM

    We’re either bouncing or backtesting. I’m going long here at 1630 (ES 1628) with stops at 1627.46.

    The dollar has probably bottomed and is well on its way to completing a IH&S we charted last week.  Before, it was moving in tandem with equities.  Now, it will be the beneficiary of rising fear and uncertainty.

    The USDJPY reversed its foray back into the falling white channel and is heading higher — perhaps an IH&S in its future as well?

    For its part, SPX is clinging to the equivalent channel lines.  A failure to hold the purple line could easily mean a tag of the red 1.618 or purple .618 at 1620 or 1617 respectively.  A failure to hold there could mean the AB=CD pattern we discussed a couple of weeks ago to the purple .886 at 1577.

    One middle-of-the-road scenario (acceptable to PPT) would be a quick drop to 1617-1620 and recovery to the purple channel line by the end of the day so as not to disturb the daily chart — which isn’t nearly as scary as the short-term charts would indicate.

    The new, slightly less ambitious purple channel:

    As I mentioned last night, I’ll be in and out today.  Should be back in about 2 hours.

    UPDATE:  12:50 PM

    Back online…  SPX has backtested the 1.000 of the potential Crab Pattern.  If it can stay above 1640, it should set its sights on the red midline or even top. Crabs often rebound from the 1.272 up to the .886 or .786 (1642 or 1645) before continuing down to the 1.618.

    But, given the bounce on the new purple channel bottom, it’s quite possible the downside will be limited to this morning’s lows.  For that scenario to play out, there should be no more missteps.

    The nature of this Crab makes playing it very difficult.  If the market’s to recover, we should expect a small corrective wave 2 somewhere along the way — after a 14 pt reversal would be logical.  But, it wouldn’t be clear whether a 7-10 pt reversal right now is corrective or heading down to the 1.618.

    UPDATE:  1:18 PM

    I’ll play the short side here on any push through the 1.000, but it might be only a short-term trade.  Even a garden variety .618 retrace would mean a drop to 1632 — 14-16 points round trip.

    UPDATE:  2:30 PM

    I have to duck out for the rest of the session.  I expect the little decline we’re getting now (thank you, Mr Market) to bottom out around 3-3:30 at the .500 at 1634 or .618 at 1632, then go on to new highs on the day — possible as high as 1650 at the red midline.

    To be sure, the 1.618 is still very much on the table.   It just seems as though the urgency is out of the decline.  A reversal, or the calm before the storm?  I don’t know.  But, I like the looks of the daily RSI chart:

    GLTA.

  • Charts I’m Watching: Aug 27, 2013

    I ended yesterday’s post without the usual admonishment to not hold overnight unless you are capable of hedging and effecting stops overnight.  Last night’s futures action is ample proof of why.

    War jitters have sent the futures tumbling overnight — but right to the .886 retrace of the latest move up.

    I’m assuming that SPX will do the same when it opens, dropping 15 points to the red .886 at 1642.91 and testing the bottom of the purple channel again.  I’d close any longs asap and play the downside to as low as 1640ish, and look for a bounce there.

    The dollar is taking it all in stride…

    And, the USDJPY is near support at intersecting channels as well as its own .886.

    UPDATE: 9:34 AM

    SPX just dipped below 1641 and should get a bounce within the next point or so.  I’ll switch to a long position here with stops at 1638.

    We’re well into the red channel again, so this should resolve one of two ways: a reversal by the end of the day that climbs back out, or a tag of a prominent red channel feature such as the midline at 1635 or bottom at 1620.94 (also the red 1.618 extension.)

    I’ll hold long unless prices push below last Wednesday’s low, in which case I’d go along with the fear trade.

    UPDATE:  9:45 AM

    So far, so good.  But, keep an eye on the 1639.49 low.  A dip below probably means a trip to that 1620 mark on accelerating volume (so far anemic.)

    I have to run out for several hours (in LA today) but will post later in the day.

    UPDATE:  EOD

    SPX held the 1638 stop/support for several hours, but in the end couldn’t recover.  The Syria rumors are coming fast and furious, and it’s certainly beginning to look like a shooting war.

    As mentioned above, a plunge through our 1638 was cause to go short with an initial objective of 1635 (didn’t hold) or 1620.94 — where the 1.618 and .618 reside.

    The next support isn’t until our original target from our downside scenario of a few weeks ago — 1577, though the .786 isn’t a bad fit depending on the timing.

    The eminis present a different view, however.  A stop right here solidifies the lower bound of the rising purple bound (it’s broken on SPX.)

    I’ll be in and out of appointments tomorrow but should have the opportunity to post before the market opens and periodically throughout the day.

  • Update on AUDUSD: Aug 26, 2013

    Not that long ago, AUDUSD served as a great indicator for US equities.  It still is at times, but the slide since April has been pretty steady.  The charts I posted last Jan 11 haven’t needed much updating:

    At the time, a Bat Pattern had completed at the top of a corrective channel (in white, above) after the breakdown of a rising wedge.  It looked fairly bleak for the pair.

    And, in fact, the Sep 2012 high of 1.0623 never was broken.  Seven months later, AUDUSD has reached the bottom of that white channel.  Seems like a good time to revisit the charts.

    continued for members(more…)

  • Charts I’m Watching: Aug 26, 2013

    The dollar continues to hang in there, with strong support at the bottom of the rising red channel and a potential bottoming pattern (IH&S.)

    For now, it’s a bullish sign.  But, DX has been somewhat bipolar lately.  Moving in union with stocks until there’s a bump in the road, then shooting up more rapidly to reflect any rise in fear.

    The SPX is in the midst of breaking out after completing its own IH&S.  I remain short-term bullish and will play the long side on the opening bell with an immediate objective of 1666 and then 1670-1672.

    Friday, SPX broke out of the corrective falling red channel.  As long as it remains in the rising white channel, it has the potential to surprise on the upside.

    This is day 3 of a potential Zweig Breadth Thrust.  As we reported last Thursday [see: The World’s End] the indicator broke through and backtested .40 (the ratio of advancers to advancers and declines) and needs to reach the .615 mark (shaded area) by next Thursday (10-sessions) in order to signal a break out.  It’s more than halfway there.

    UPDATE:  9:53 AM

    SPX reached our initial target — the red 1.618 and purple .382 combo at 1666.22.

    We should get a pause here, perhaps to backtest the broken yellow neckline of the latest IH&S.  It’s playable, but likely won’t drop more than 1662-1663 as anything further would jeopardize the rising white channel.

    Just saw a news flash that Dick Bove of Rafferty Capital downgraded JPM to “hold” since it is apparently the target of a “government vendetta.”

    I don’t know about a vendetta…  JPM has received a pass at every turn, no matter the offense.  Any penalties it has received have been mere slaps on the wrist.  It would take boatloads of penalties to ever negate the largesse the Fed has bestowed on JPM.

    JPM is one of the prime beneficiaries of QE.  I’d go so far as to say it’s practically a pure play on the likelihood of continued QE.  Thus, its chart is instructive.

    A narrow rising channel broke down after a recent Crab Pattern completion (the purple 1.618 at 55.86 — which might have been the better place to downgrade the stock.)

    But, the subsequent drop to the 1.272 (at 50.51) is a typical basing move before a potential next leg up.  And, note that there’s a bigger rising channel that would fit quite nicely — with a midline running right through 50.51.

    There are plenty of other patterns at work here — not the least of which is the recent tag of the .786 (56.06) of the drop from its all-time high of 67.17 in 2000 to 15.26 in 2002.

    If the Fed feeding tube were to actually be withdrawn, I can see JPM having plenty of downside.  But, the charts indicate the Fed is more likely to continue to prop up the financial sector for as long as it takes — and, that’s a very long time.

    continued for members(more…)

  • Update on USDJPY: Aug 26, 2013

    USDJPY completed a second white channel backtest and a second purple channel midline backtest and is clinging to support: the midline of a parallel channel (in grey below.)

    The odds are probably 50:50 whether it drops to backtest the falling white channel it broke out of last Thursday in the 93.38 range or heads up to test the 99.94 high.

    The rising white channel from last summer is finished; and, the harmonic picture is bearish.

    But, the big yellow channel midline hasn’t been seriously threatened yet.  A surprise move to the upside would catch a lot of bears unprepared.  And, the 200 DMA, now at 94.24, is fast approaching. With SPX having recently punched through 1576, it’s important to the bulls that USDJPY hold its SMA200.


  • Update on Gold: Aug 23, 2013

    Gold reached the target we discussed last week — the white .886 and purple 1.618 Fib levels at the middle of a long-term channel.

    As I wrote on Wednesday, if it can punch through 1395, the next move is a shot up to 1551-1561 in the next week or two.  Getting past there may take some doing. The safe bet is to take profits and revert to short with tight stops just in case.


  • Don’t Let Us Down

    You can always count on the Fed, or so it seems.  As SPX was teetering on the brink of a 100-pt plunge the past couple of days, the Jackson Hole Gang came together to keep the dream alive.

    To them, our modern-day rock stars, I dedicate this classic…

    Interesting side note to this performance…  It was January 1969.  The Beatles were just about over.  They hadn’t performed together publicly for two years and were at each other’s throats as they struggled to finish “Let it Be.”

    On a whim, they hauled all their equipment on the roof of their building in the dead of winter and performed for half an hour for startled passersby.  Finally, the police arrived and shut them down.  It was their last “concert” together.

    I thought it apropos, as the Fed moves forward into the post-Bernanke era.

    *  *  *  *  *

    The eminis are up 6 points at present and have broken out of the latest falling channel.  This preserves the bullish purple channel we’ve been following, the path to new highs.  Whether the market will stay on that path is anyone’s guess.  But, for now, the market likes what it hears.

    BTW, the labels above aren’t harmonic.  Just showing an A-B = C-D potential that illustrates our downside case — which is still on the table until ES breaks 1705.

    UPDATE:  9:35 AM

    SPX just tagged the top of the red channel at 1661.83.  We’re getting a pullback here that could still back test the IH&S neckline at 1655.  But, it’s just as likely the pullback is only to the broken yellow .786 line at 1660.  Staying long unless that level is taken out.

    UPDATE:  9:54 AM

    We’re seeing some weakness through 1660 and the 1658.92 high, so it appears a back test is coming.  Traders might want to play the pullback (I will) but it should pass.  The neckline is around 1655, and the white channel bottom is around 1653, so set your stops accordingly.

    UPDATE:  10:08 AM

    That should do it for the downside.  Back to a full long position at 1655, stops around 1652 (or the bottom of the white channel.)

    I’ll take a moment and review the scenarios we’re watching — either of which could still play out.

    continued for members(more…)

  • Isn’t it Odd…?

    Does anyone else find it odd that the Nasdaq suddenly went dark just 10 minutes after AAPL completed a H&S Pattern targeting a 30-pt drop…

    …the day after reaching our target from July 31?

    If I didn’t know any better, I’d think TPTB found a new way to ensure the markets remain “bullish.”

    Maybe these “circuit breakers” we hear so much about are actually circuit breakers?