Month: December 2012

  • Charts I’m Watching: Dec 6, 2012

    ORIGINAL POST:

    We can’t call the corrective wave over just yet.  There’s still potential to one of those fibs or channels we discussed yesterday before the 3rd wave down gets going.

    But, RSI is still showing no breakout potential on any time frame.

    A 50 – 88.6% retracement is considered “normal” for 2nd waves.  This one had a little reversal at a little over .618 on the largest white scale, which opens up the possibility of a Gartley (which completes at the .786) or a Bat Pattern (completes at the .886.)

    As the chart shows, the .786 is at 1418.27 and the .886 is at 1420.82.  Each of them looks possible, and one of them is very likely if SPX edges up past 1415.56.  If it does, my leading candidate is the .786 at 1418.27 — especially if we get a little reversal at 1413.50 — the .786 of the smallest red pattern.

    That would set up a Butterfly Pattern on the little red pattern which completes at its 1.272 at 1418.27 — intersecting nicely with the white pattern’s .786 at 1418.27.  Such a price point intersects with the channel lines (as drawn, but not yet firmly settled) at the end of the day or very early in tomorrow’s session.

    If SPX can’t get past 1415.56, then the downside harmonics (represented by the small purple grid) are in play, and the initial target is back to the 1398 level (previous low, and a Bat Pattern .886.)  Once prices move past 1398, the decline should accelerate.

    UPDATE:  12:30 PM

    If the analog were to play out exactly as before, with no deviation from the past pattern, we’d not see any higher prices at all.  In fact, we’d be back below 1343 in the next day or so — starting this afternoon.  But, that’s a bit much to expect, given the big deviations we’ve already seen within each wave.

    UPDATE:  3:15 PM

    Lots of excitement around AAPL the past couple of days.   A couple of weeks ago, after AAPL soared 90 points in 7 sessions and was approaching 600, I was a little skeptical [see: AAPL update.]  I posted the chart below, and nervously took a stand.

    Combining all the above, it’s easy to imagine a scenario where prices drop to 500 into the end of the year, but can’t quite seal the deal on the H&S pattern.  A nice bounce there and rally into February would fit nicely with my general equities forecast (see below.)

    AAPL gained 4 more points over the next couple of sessions, then took a swan dive that has seen it lose nearly 75 points in less than a week.  Here’s the same chart, updated for the actual price action.

    Aside from the fact that AAPL did what we expected, nothing’s really changed.  There’s a H&S pattern that would complete at about 504.  Given the number of hedgies and mutual funds rushing for the exits, who could be surprised if AAPL went ahead and completed it?

    But, I’m not beating the table for that scenario, only because a bounce just shy of completing the pattern better fits with my general equity forecast.  AAPL came within 3 points of a .886 retracement of the bounce from 505 today (and 14 pts shy of the H&S completion) so there’s ample reason for a bounce.

    It could easily stay in the little white channel, forming a falling wedge into the year end as the rest of the market melts down a bit.  Personally, I wouldn’t have anything to do with it in my portfolio unless it was an iron condor or the like.  The volatility is too great and I don’t like the odds in either direction.

    More later…

  • On Our Way

    For anyone experiencing a slow response from the site this morning, it’s not you.  GoDaddy is on the case, and I hope to have some resolution soon.  I sent out the first update via email rather than wait forever for page loads.  Please take this opportunity to subscribe to twitter — another back up available to us:  https://twitter.com/pebblewriter .

    Also, a quick shout-out to a member of this site who, without knowing, has made life more bearable for me of late.  Only 100 feet from where I sit overlooking the beautiful Pacific, someone has been preparing a lot for their new house.  For the past three weeks straight, a 20-ton excavator has been jack-hammering solid granite from 8am to 4pm.

    While slowly going (even more) nuts, I discovered the music of David Parkhurst Crane [website].  It’s both uplifting and serene, and gently guides me back to a saner place.  An added bonus: it’s instrumental.  So, I don’t get distracted (or add to the excavator’s din) by trying to sing along.  Thanks, David, and I hope I haven’t embarrassed you too much.

    ORIGINAL POST:

    This morning, everything is still on track.  We’re getting the bounce at 1400 we anticipated in yesterday’s post [see: Without a Net.]  We haven’t had a significant bounce yet since shorting Monday at 1423 [see: At Last.]

    The key to any additional upside will be if SPX leaves the little white channel established since the top.  The top of the channel is currently around 1408-1409.  A bounce should be limited to 1420.82 or so, the .886 of the move down thus far, and the top of the purple channel that’s guiding the downside in the big picture.

    If it ramps up but reverses at 1409, then obviously the downside will accelerate.

    The 60-min RSI supports the idea of a decent bounce here.  Note we’ve reached the bottom of the yellow channel.

    UPDATE:  12:05 PM

    We broke out of the white channel and are working our way back up.  A typical .618 retrace would stop at 1413.99.  But, there’s a potential channel widening (small red channel) to be had at the .786 at 1418.27 (it would have to hurry) or the .707 at 1416.26 late in the session.

    At some point during every sell-off, the falling channel has to widen or morph into something else.  We won’t know exactly which until this bounce completes and we resume the downside.

    For those looking to capture the larger move, no reason to chase the bounce; it’s likely nothing more than a blip on the way much lower.

    UPDATE:  2:55 PM

    The site seems to humming along again.  The bump got as high as 1415.56 and, since then, has been furiously — well, pretty much nothing.  The two possibilities I ventured this morning are still on the table.  A tag of the purple channel would mean about 1420 as of 3:00PM (the .886 is at 1420.86.)  The red channel I drew is presently up around the .707 at 1416.26.

    SPX has formed a pennant-looking pattern which hints at 1428ish.  While I definitely don’t expect it to play out, this is why we use stops.

    The 30-min RSI is mashed up against a channel line, so it could break either way.

    But, the longer-term picture is still negative — and should remain so as our forecast continues to play out.

    continued for members(more…)

  • Without a Net

    The toughest moments for those of us who chart publicly are those right after calling a significant top or bottom.  There are some instances when pretty much everyone and their mother can see a turn coming.  Other times, it feels like you’re sailing through the air, frantically searching for the catcher and hoping he hasn’t chosen this moment to take an unannounced coffee break.

    The first wave down after any significant top is just plain fun.  It worked!  Sit back, bask in the glory, etc.  Then comes the corrective wave.  Heart-in-throat time.  You know it’s going to retrace some of that first wave down, but how much?  Most chartists develop sweaty palms around 61.8%.  Your stomach starts churning at 78.6%.  At 88.6%, time for your favorite vice.  And, God help us if it’s a double top.

    Following an analog is generally the worst.  Virtually no one else sees it coming, and there is a long list of reasons you’re probably wrong.  Taking a tour around the net last night, that certainly seems to be the case now.  The euro is soaring, the dollar is tanking, and the market has spurted 80 points in two weeks — only 50 points from a five-year high.

    It’s made even worse if the first wave down didn’t break out/down of whatever chart pattern it was in.  Yesterday’s reversal was impressive — going from up almost 8 points to down 8.But, we never quite reached my 1424.41 target — coming up .68 short — not to mention the Inverted H&S target.

    And, we haven’t yet broken down from the rising wedge. A re-test of the high is officially on the table until that happens — hence the importance of using stops.

    Once the wedge is broken, the next support is usually either an important Fib level or a morphing of the wedge into a channel.  In this case, we have strong horizontal and Fib support at 1400.  If we convert the wedge to a channel, it has a mid-line currently around 1402 and a channel bottom around 1390.

    A rising channel would be bullish, of course.  And, I haven’t a bullish bone in my body right now.  We draw it, though, because we have to try to get inside the head of all the bulls out there and figure out where they’re likely to jump in and buy.  Channel mid-lines and bottoms, as well as important Fib levels, definitely qualify.

    UPDATE:  11:35 AM

    Nice reversal off this morning’s highs again, turning a 4-pt gain into a 4.5-pt loss where SPX bounced off the 10-day SMA (in red below, currently 1405.37.)  The SMA 20 (white) is down around 1392 and, like the 50 (blue, 1419), is due to continue falling. Fifty sessions ago was Sep 20, two sessions post the Sep 14 high of 1474.  So, all else being equal, the SMA 50 should start coming down as those higher components to the moving average roll off.

    The 200-day moving average (thicker red) is down at 1385, so it’ll be a while before the 50/200 cross.  And, we are officially back below the 100-day (thicker yellow) at 1410.59.  Look for the 50/100 cross in the next few days.

    The next battles involving moving averages will likely come at 1380, involving the SMA 200 and the SMA 20 at the intersection of the bottom of the rising white channel and the top of the falling red channel.  The 50% retracement of the 1343 to 1423 rally is at 1383.54, which intersects with both channels on Thursday.

    So, we’ll keep an eye out for a significant bounce Thursday at 1383ish.  Remember, the .786 of the 1576 – 666 crash is right there at 1381.50.  And, bulls will want to limit this “correction’s” downside to the next Fib level lower — on the way to new highs, of course.

    The EURUSD, in the meantime, has reached Sunday’s upside target of the .886 at 1.3084 and has completed a fairly decent looking rising wedge of its own.

    UPDATE:  12:10 PM

    The dollar has reached the bottom of the white channel we charted Sunday [see: DX Update], just beyond a .618 retrace of the move up from 78.725.  It appears to be basing for a move higher.

    I’m expecting a 5% move by around the end of the year.   What does that mean for stocks?

    continued for members

    (more…)

  • At Last

    Nothing has changed since our last post Friday.  We have nearly reached 1424.41 — the lower end of the target range established on Oct 31 [see: A New Old Analog.]

    If the analog remains on track, today should be the start of a large correction — perhaps in conjunction with the ISM report due out at 10 EST.

    I’m shorting here, with stops around 1430.

    UPDATE:  10:05 AM

    One of the uglier ISM reports we’ve seen in a while. From growing to contracting overall, with every category either contracting or slowing except for production — which (oops) is ramping up as demand contracts.

    Looks like the reversal has begun.

    UPDATE:  12:00 PM

    The reversal has begun in earnest now.  I’ll spend the new hour or so reviewing the downside targets.  First, a little treat appropriate to the day.

    I had the great pleasure of seeing the incredible Etta James at the Hollywood Bowl in 2008 and the Monterey Jazz Festival in 2002.  Her voice somehow conveyed both her troubled past and her elation at being on stage, sharing her amazing gifts with an appreciative audience.

    continued for members(more…)

  • EURUSD Update: Dec 2, 2012

    The overall trend since 2008 remains down, with EURUSD likely on its way to the .618 retracement (largest white pattern) of the rally from 2000 to 2008 at 1.12 in either January or (more likely) May 2013.

    This lines up roughly with a 1.272 extension of the Jun 2010 to May 2011 rally (purple) and the 1.618 extension of the rally beginning in July 2012.

    continued for members… (more…)

  • DX Update: Dec 2, 2012

    The US dollar remains in a rising channel within long-term channels that point to very different outcomes.

    The rising white channel intersects just ahead with the larger falling white channel upper bound, the rising red channel mid-line and the 75% bound of the falling purple channel.

    Whether the red or purple channel carries the day will depend largely on whether the ECB or the Fed can deflate its currency the fastest.

    But, the intermediate-term picture is clear:  if DX can hold the white channel, the next move should be much higher.

    continued for members… (more…)

  • Zweig Breadth Thrust

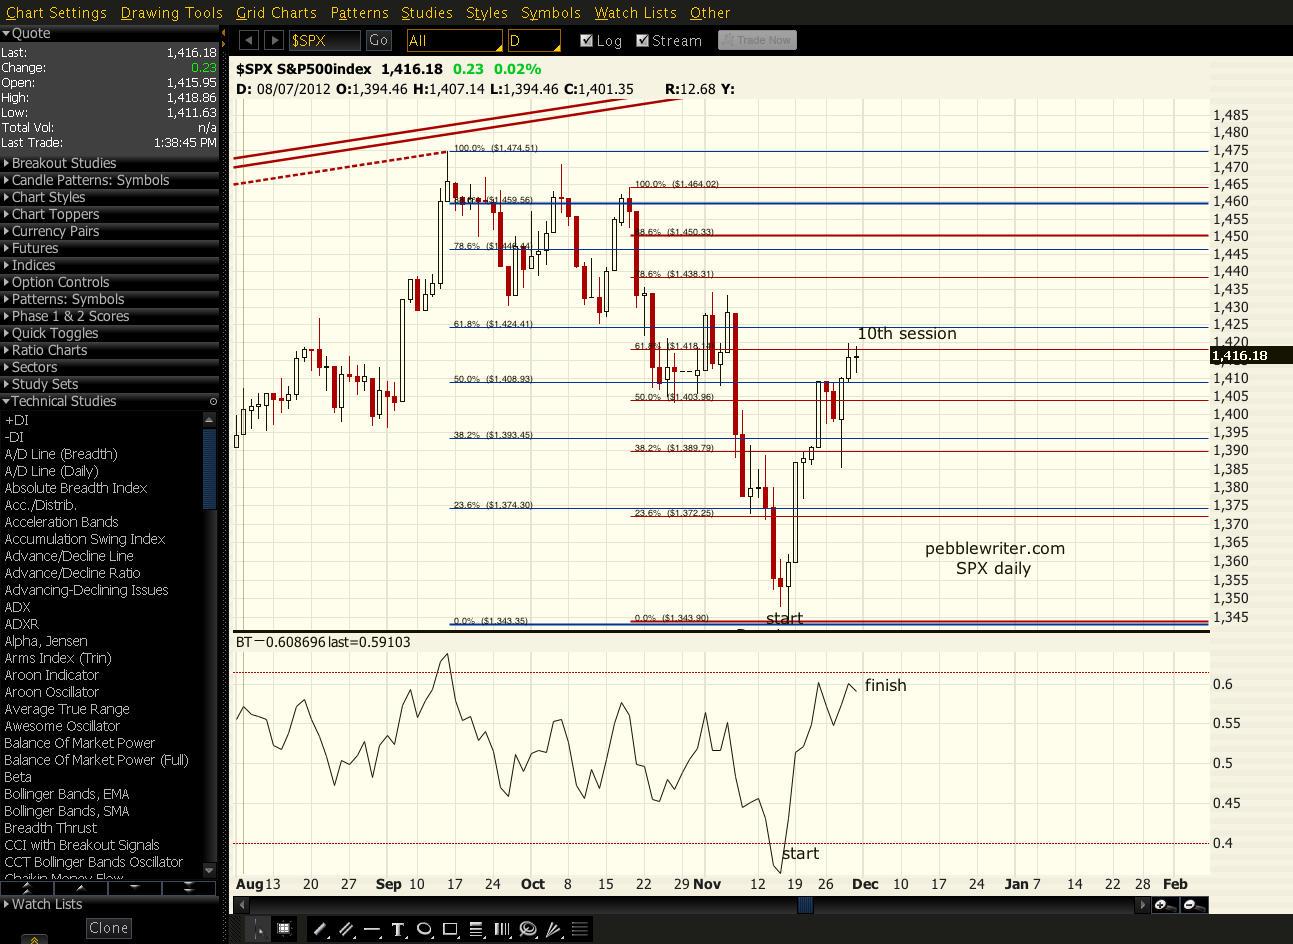
    Came close Friday, but didn’t happen.  A ZBT requires a move from .40 to .60 in 10 sessions or less.  Here’s a successful signal from Sep 2011:

    And, here’s where we ended up Friday — the 10th session from the .40 cross:

    Ditto for NYSE & DJIA too, BTW.