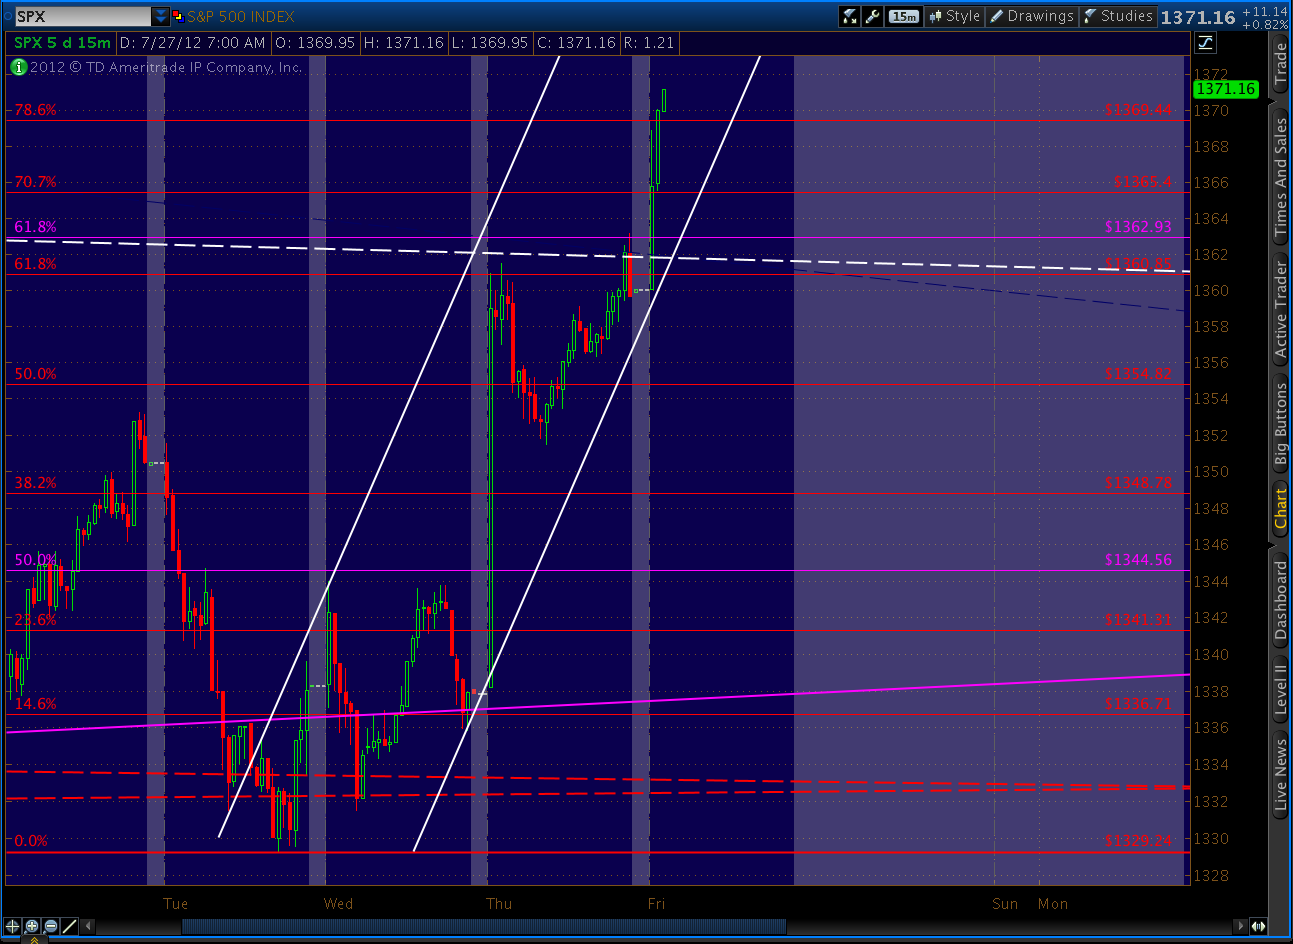
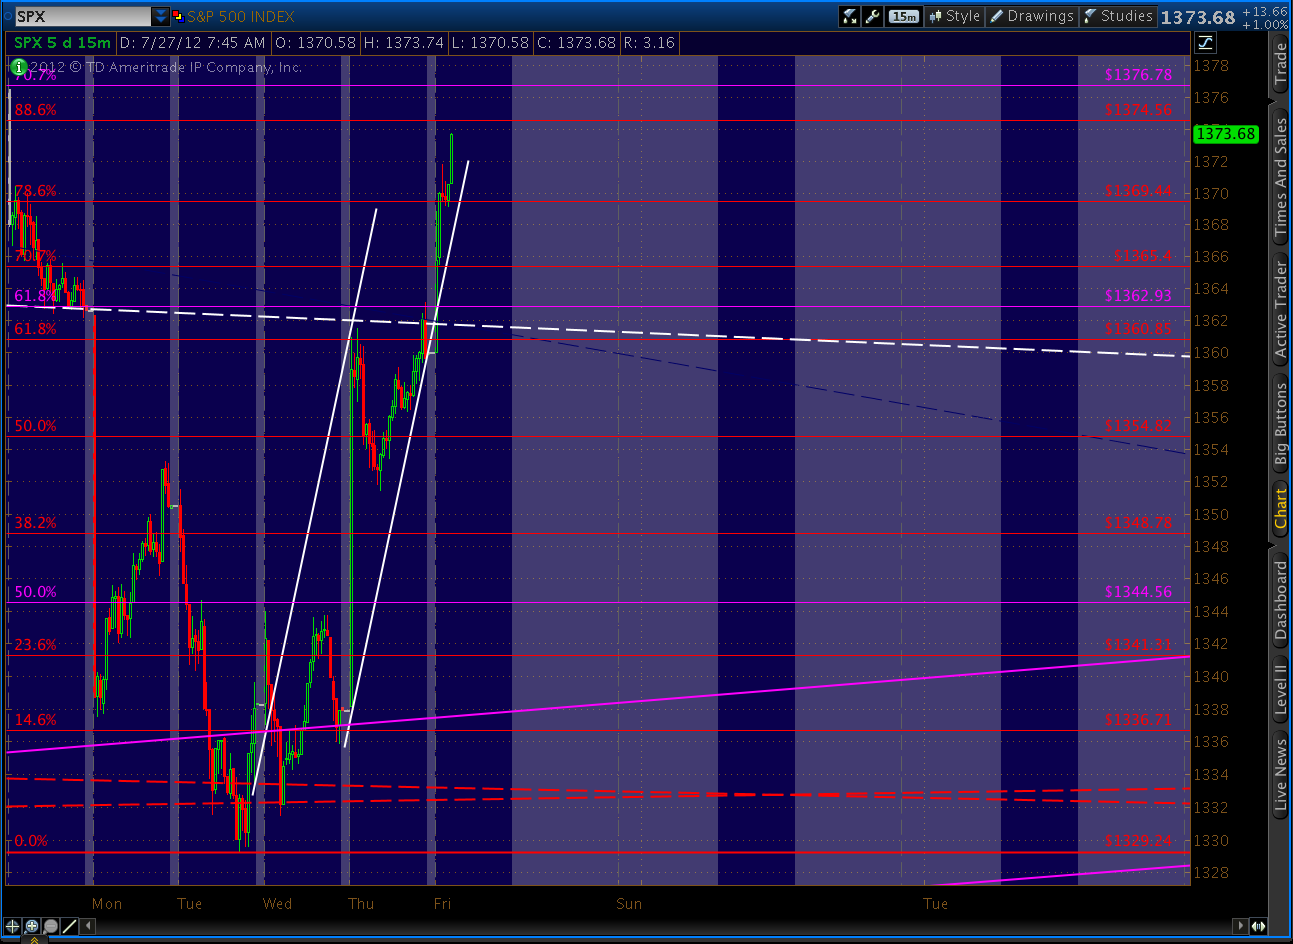
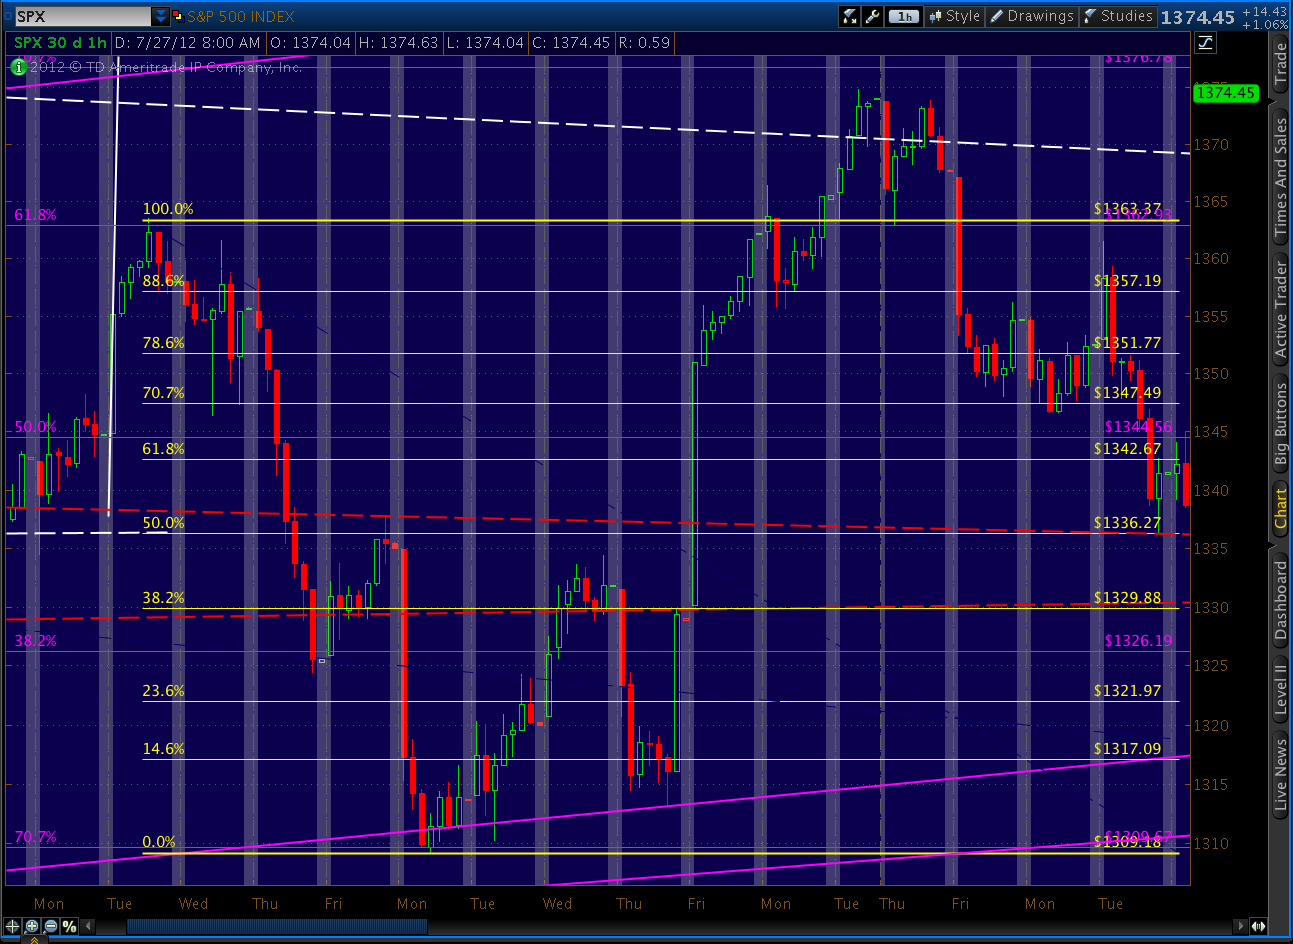
SPX might be tracing out either a flag or pennant pattern on the 15-min chart. While either could portend higher prices (2/3 of the time), a flag would mean lower prices first — probably down into the mid 1370s.
At first blush, the market seems to be respecting the last high of 1380.39 on July 19. I suppose it makes for a more positive wave structure.
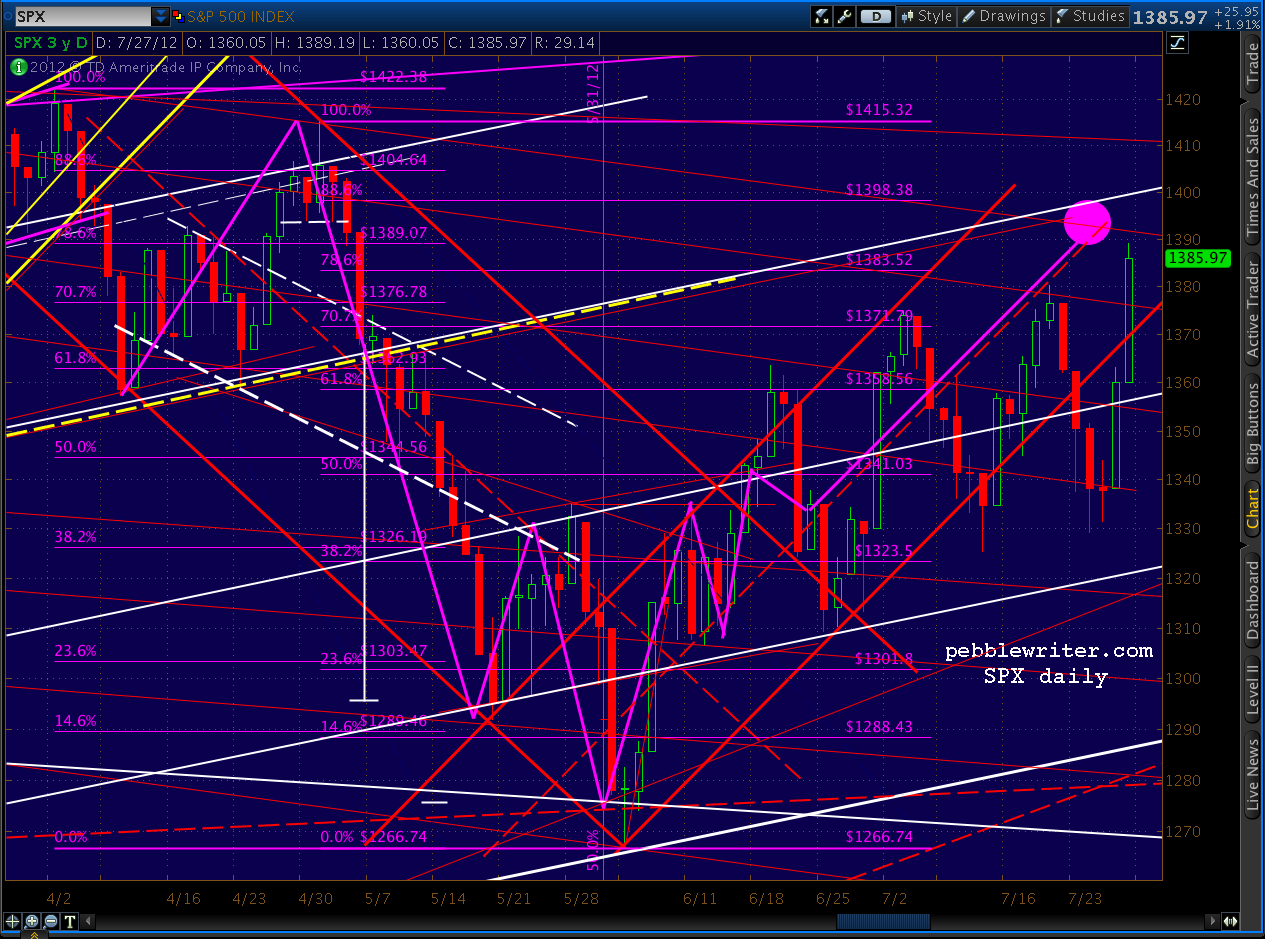
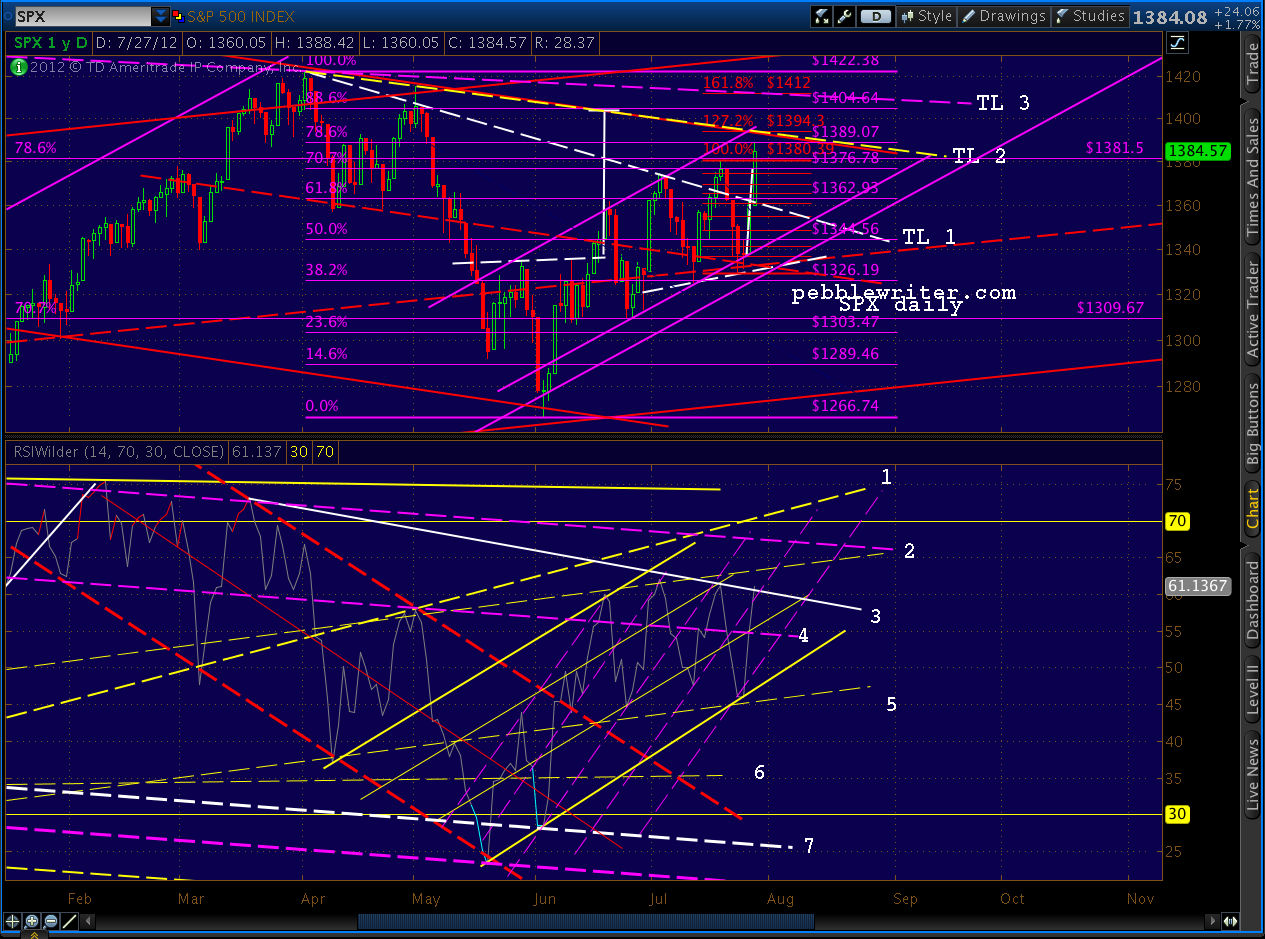
But, I suspect the bigger worry for bulls is the Fib .786 at 1381.50 (in yellow). This retracement from the 1576 to 666 plunge (Oct 2007 – Mar 2009) was only recently exceeded again, and a real, live bull market shouldn’t have any difficulty retaking and defending it. Here’s the big picture, again:
We’ve been blessed with a real trader’s market the past few months. Had we simply held our April 2 shorts (at 1422), then covered and gone long on May 23 (at 1298, I was early), we’d be up a respectable 215 points (15%) as of Friday’s close.
There’s certainly nothing wrong with a 15% return in 4 months. It beats the heck out of a buy and hold strategy which would have left us down 33 points (-0.49%)
By paying attention to harmonics and chart patterns, however, we registered 685points over the same period for a 49.25% return.
Looking back, our forecast was eerily accurate. Here’s the chart I posted on June 11, a slightly revised version of a June 1 forecast [see: Mixed Signals.]
The forecast line is the solid purple line rising diagonally across the chart in the middle of the red channel. I was expecting a quick decline from 1335 to 1308, then a rise by July 25 to 1389. I punted on the likely wave shape, drawing a straight line down the channel midline from June 22 on.
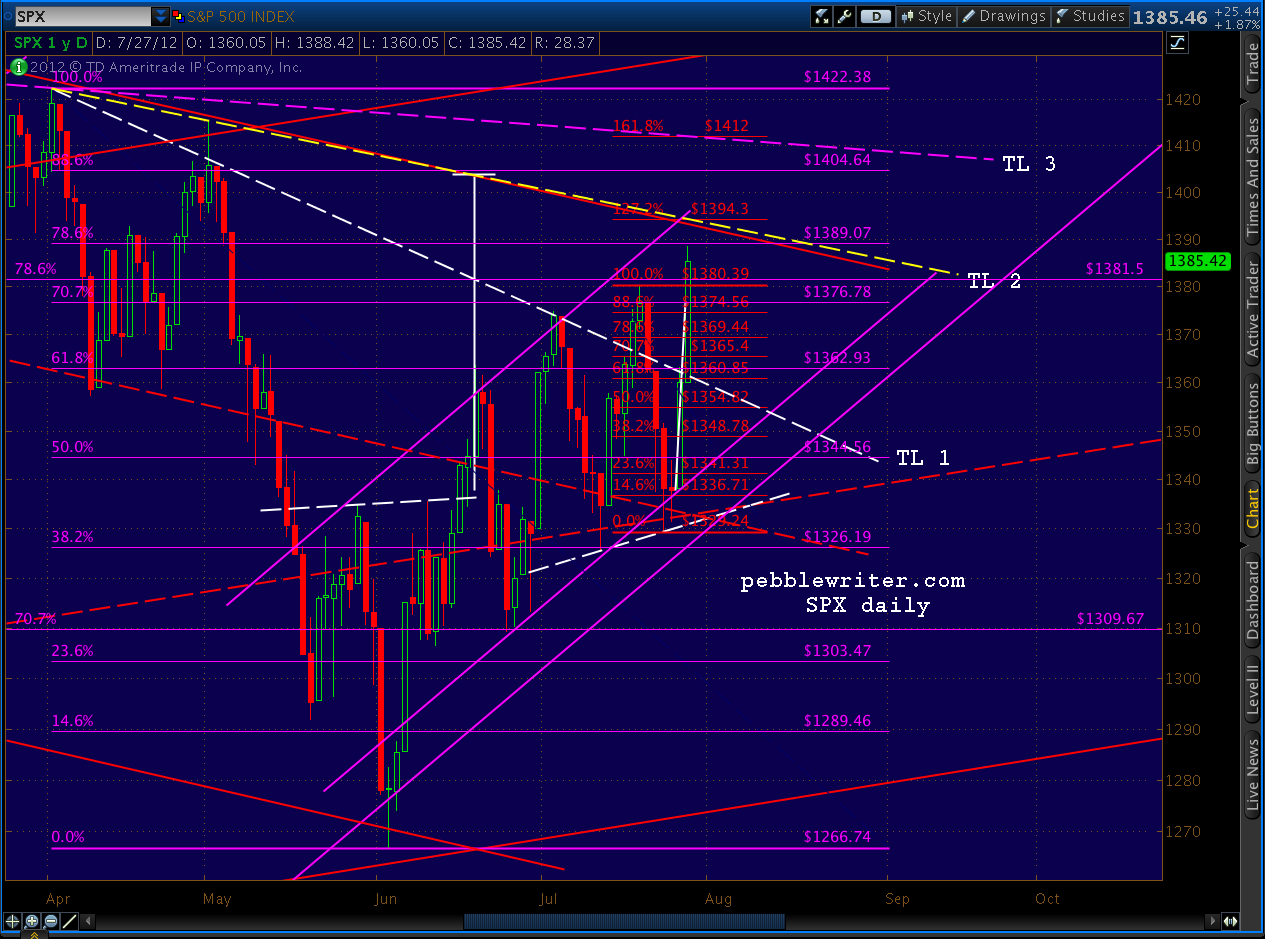
We got the decline the next day (to 1307)… and followed that with a rise to 1389 by July 27 — only two days later than expected. Here is the exact same forecast, superimposed on the actual market results.
I’m not aware of anyone who correctly anticipated the wave moves. I’m glad I didn’t embarrass myself by taking a wild guess. But, the channel worked very well — until the July 12 dip necessitated a slightly tamer slope.
Earlier today, a friend described his attempts to capitalize on the rise since early June using options. He had the right direction, the right target and nearly the right timing. Yet, profits had been anything but automatic.
I attribute the difficulty to the crazy wave structure we’ve seen since June 25. It’s been a tough time to stay ahead of the daily swings. In the past 38 sessions since 1266, only 3 featured daily swings of less than 10 points. Fourteen had daily swings of 19 points or greater.
Because we have so many new members over the past week, I’d like to suggest you check out the post: How to Use Pebblewriter. It’s a good general overview of how my process works. And, if Butterfly, Bat, Crab and Gartley Patterns sound like gibberish, check out the pages under Harmonics in the Learn tab on the main page. I will try to update the How to Use Pebblewriter page over the weekend.
There are still a handful of the 37 2nd quarter discounts available. These are annual memberships for $500, a 37% discount (in celebration of our 37% 2nd quarter results) to the new annual price ($800) which will be in effect tomorrow. Details here.
If you’ve recently signed up for a monthly or quarterly membership, consider upgrading while these are still available.
* * * * * * * *
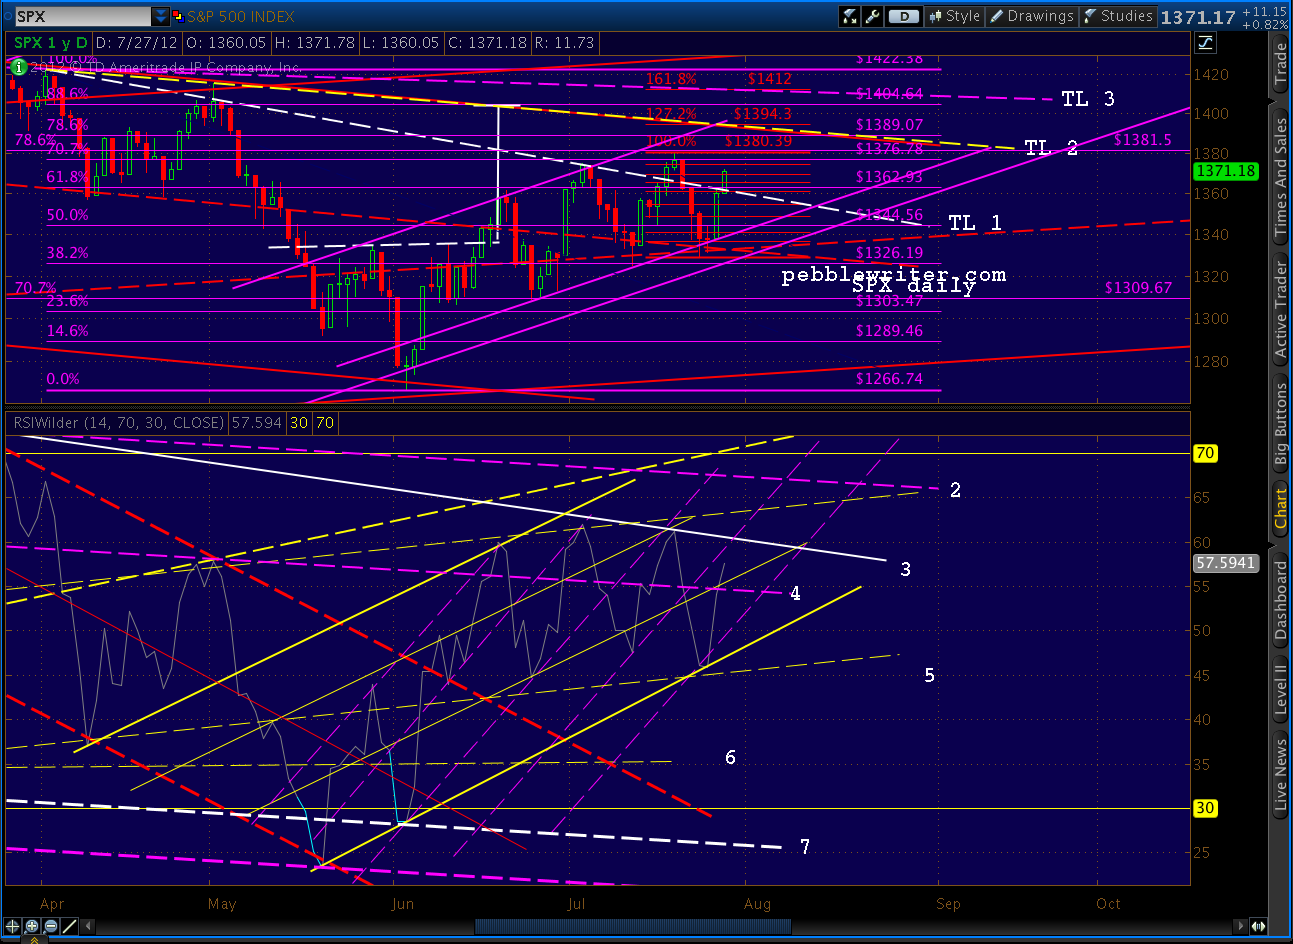
We just retraced a Fibonacci .786 of the 1380 to 1329 drop from last week. A pull back at 1369.44 to say, 1348 – 1360, would be helpful in establishing a small Butterfly Pattern (in red, below) to go with our larger Bat/Gartley (in purple.)
A Butterfly would work nicely here, as it completes at either the 1.272 (1394) or the 1.618 (1412) extension — both in the vicinity of our other targets. The lower target of 1394 also lines up pretty well with TL 2.
If we don’t pause here, look for a reversal at the .886 at 1374.56 in the construction of a Crab Pattern (also completes at the 1.618, or 1412.)
The RSI shows we have a ways to run before running into serious opposition — so my money is on the .886. The intersection of the white TL (3) and the purple dashed line should be our next hurdle — probably at the .886 or even a previous high.
As always, when the market is ramping strongly, look at the 15 or 30 min charts for how the channels are behaving.
Any deviation from the general uptrend will appear here first. The harmonic levels clue us in as to the potential turning points.
UPDATE: 11:00 AM
The channel holding nicely as we approach the .886 at 1374.56. I expect a little pull back here, but keep an eye on the channel just to be on the safe side.
Some strong rallies barely pause, and it’s always frustrating to watch the market continue to move after you’ve pulled out. An example was the rally between Jun 19 and July 3, which plowed right through all the usual suspects and didn’t even take a breath until the previous high.
But, it had already made a strong reversal just shy of the .500 mark, and was working on a Crab Pattern when the channel and TL #1 applied the brakes.
An alternative to anticipating these turns (intra-day anyway) is to continue raising your stops. Just know that market makers know where your stops are, and love to push the market just enough in each direction to stop out those who aren’t watching before letting the market resume its ramp.
More later.
UPDATE: 11:30
We’re getting a nice reaction off the .886. I’m pulling some longs and will try a few shorts here at 1375 — but will likely go long again immediately if we push through 1376. I view this as a very short-term trade, and it doesn’t affect my view that we’re going higher.
But, again, I’m watching the little channels for signs that it isn’t working or is developing into something more. My target on the downside is the .786 at 1369, but it could go further to the .618 at 1360.
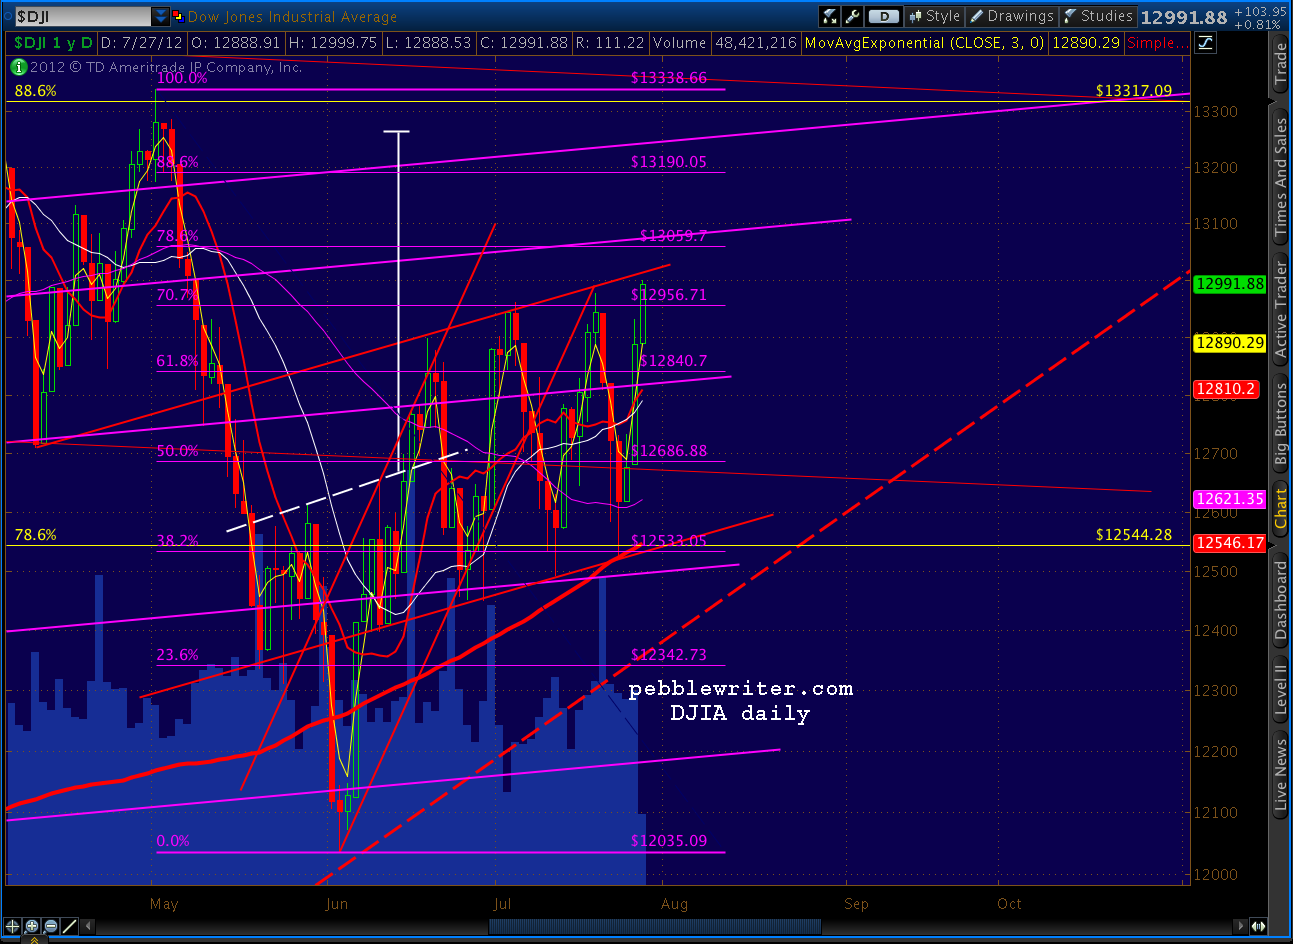
DJIA’s high for the day is 12,999.75. How cute is that? Interestingly, it is bumping up against its channel line on the daily chart. Can’t tell exactly, because there’s a little wiggle room in this chart, but there could be some resistance between 13,000 and 13,015.
Re SPX: Since we already had a 10-point reversal at the .618 of this latest pattern, there is no reason that we must have a reversal here at the .886. Bat and Crab Patterns form around .618 Point B’s all the time, completing at the .886 and .1.618 respectively. But, a reversal at the .886 helps create ambiguity — a hallmark of the recent market action.
More later.
UPDATE: 1:30 PM
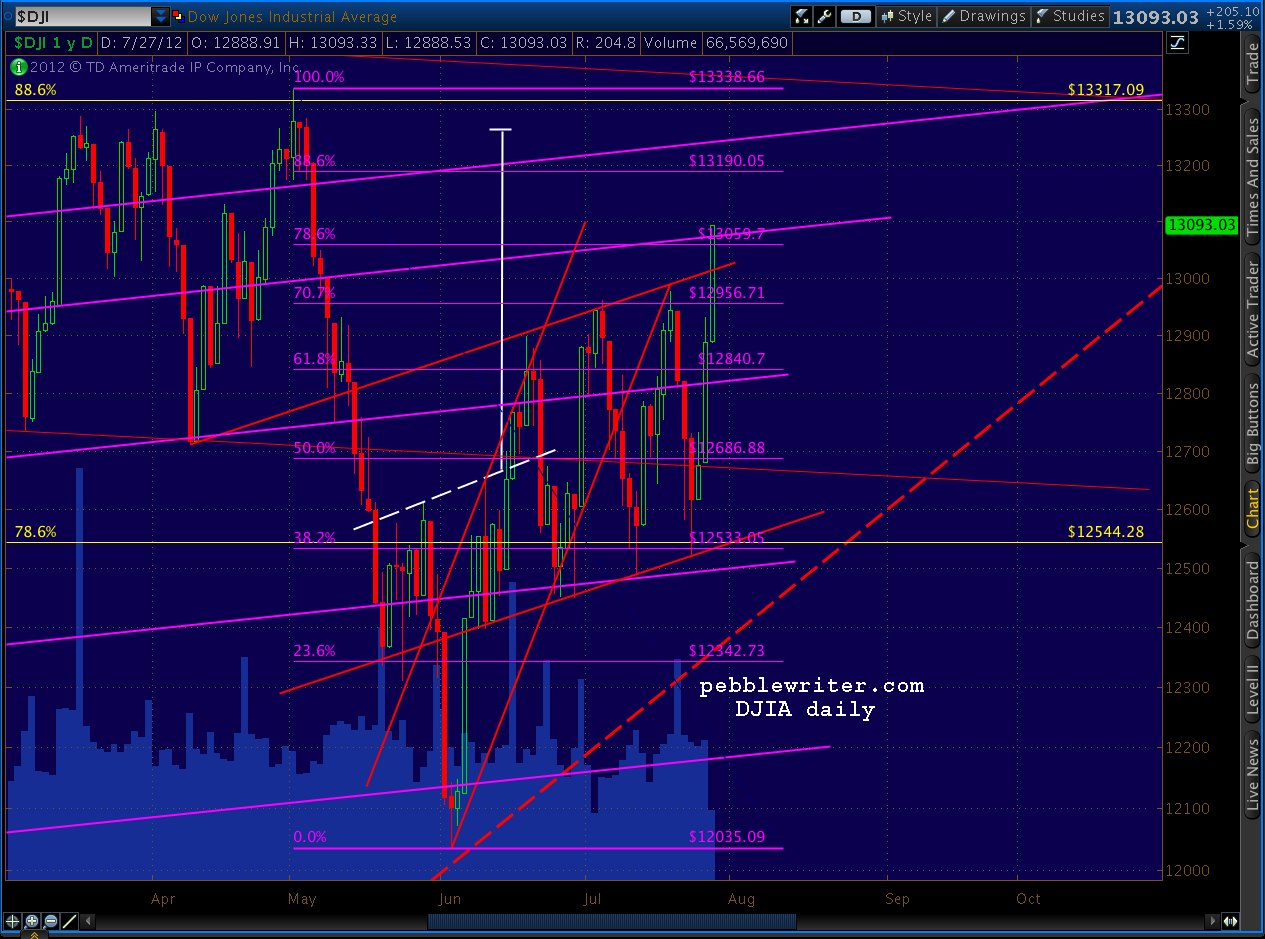
DJIA had a nice break out of its channel – very bullish. Even though it’s likely to back test either the channel or at least put in a little reversal at the .786 and the purple channel line, this is positive for equities.
SPX is closing in on its .786 at 1389, which has been the lower end of our target range since early June. Look for a reaction there.
If we’re still going strong, TL 2, the 1.272 of the smaller Crab Pattern and the purple channel are all just above at 1394.
Is it worth going short at these levels? The daily RSI has slightly exceeded #3, and will mostly likely close right on it. A tag of #2 probably means either 1394 or 1404 — depending on how much of a reaction we get at 1389.
I suspect getting back to #1 will mean a new high such as 1433. But, again, it depends on how much of a reaction we get at 1389.
German Finance Minister Wolfgang Schaeuble and Wall Street spokesmodel Timothy Geithner are due to meet on the island of Sylt in far northern Germany. It’s somehow appropriate that these two lovebirds will be kanoodling on a remote island of shifting sands as far away from Southern European trouble-makers as possible (without slipping over the border into neighboring Denmark, which has wisely clung to the Krone.)
What pillow talk can we expect? They’ve already scheduled a press conference, which means it’s something good, right? Or at least we’re supposed to perceive whatever they say is positive… like mom and dad explaining how the divorce will be a good thing.
We also have the FOMC meeting coming up next Tuesday and Wednesday. While it’s not inconceivable, this equity rally does make it marginally tougher for them to announce a full-on QE3. At 1389, we’re only 2.3% off the highs of the year and 11.8% off the all-time highs (the Dow, less than 8% off.)
More on this over the weekend…
UPDATE: 2:45 PM
Considering holding long over the weekend? Check out the channel we charted this morning… it’s now more of a rising wedge.
The yellow dashed line is TL #2, one of three channel or trend lines that converge right about now (give or take a day or two) at 1394. It would be unusual for prices to continue to march in tight formation all the way to the apex at 1412.
Rising wedges usually break down at their .618. A price of 1394 today or Monday would represent a .786 retracement in both time and price (of the entire wedge.) The wedge is currently about 8 points from the upper bound to the lower. On Monday, that declines to about 6 points. So, clearly, something’s gotta give.
I’ll stay long until we break down out of the wedge or until we tag 1394, whichever comes first. If neither occurs by the end of the day, I’ll have some tough decisions to make regarding the weekend. If you’re in the same boat, I encourage you to stay with us through the last hour of trading. I’ll post more if anything of consequence occurs.
We’re up over 4% since going long at 1331 on Tuesday, and I’m not crazy about giving it back.
UPDATE: 3:30 PM
Other charts suggesting at least a pause here:
COMP daily
Oops, just tagged 1389.19 — officially reaching the .786 and the bottom of our upside target range since early June. That’s good enough for me. I’m going into cash for the weekend. I know I’m leaving money on the table, but I want to sleep well this weekend.
I wouldn’t be surprised if the market bumps up to 1394 intra-day on Monday just to make the TL tag official. I’ll reassess over the weekend.
BTW, here’s how our rising wedge finished the day. Broke down from the tiny wedge inside the small wedge, and closed right on the small wedge’s lower bound. Gotta love it.
Congratulations to all of our new members. If you went long at 1331 this past Tuesday with at least $11,500, you’ve earned back your annual membership fee in only 3 days!
Our decision to go long again at 1331 is paying some nice dividends, with SPX up over 30 points in the past two days. If we can hang on through tomorrow, we should be up over 50% since inception (March 22.)
A little reminder… a few days ago I announced a 37% discount to the first 37 new annual members in celebration of our 2nd quarter results (up 37%!) If you’re already a monthly/quarterly/semi-annual member, we’ll just tack it on the end of your current membership. If you’re already an annual member, tell a friend and earn 3 free months when they sign up. There are still 11 spots left, so grab ’em while you can. This deal ends tomorrow, when new rates are announced. To sign up, click here.
In my old days on Wall Street, this would be a great time to start indexing. Institutional asset management is all about beating your benchmarks and quartiles, and every manager I know would absolutely sit on a lead like this and ride out the rest of the year essentially owning the S&P 500. But, you all know me better than that, right?
I am an ardent believer in the chart patterns, channels, harmonic patterns and technical analysis that have enabled us to capitalize on rather than fall victim to volatility. It’s hard work, for sure. I start around 5:30 am and often nod off around midnight — still charting.
But, the results are worth the effort. We certainly won’t be on the right side of every move every time; my goal is to get most of them right by sticking to our proven methodology, and avoid being sucked into positions based on hope or fear.
One of our members (known here as Beach Justice) is a professional poker player; he recently offered me the following sage advice:
There’s a saying in poker: “Don’t be results oriented,” which simply means that just because your play didn’t work out and you lost the hand, that doesn’t mean it was wrong, and thus you shouldn’t bitch about it. Profitable situations in poker get annihilated by low-percentage cards all the time, but if the expected value of the play was positive, that’s all that matters and the profit will be there over the long run.
Trading the is the same way, just because a particular forecast doesn’t work out for whatever reason, it doesn’t make the position a bad bet. If I make 10 trades with an estimated 3:1 risk reward and I get stopped out on all 10 of them, as long as the analysis was good that’s fine.
Anyway, as simple as that concept is, I never see traders discuss it and just thought it might be helpful in teaching trading. We’re here to take good gambles (and on pebblewriter.com, learn how to find them) but all a good gamble does is offer an edge, it doesn’t guarantee it will pay off every time.
Perhaps a blog about something like this will reinforce to any readers (or haters if you somehow have them), that it won’t always work out, and there’s nothing wrong with that. So just a suggestion in case that’s helpful.
Thanks, BJ; it’s extremely helpful. Because, I have no interest in sitting on our lead and/or playing it safe. God willing, we’ll keep doing what we’re doing and the results will sort themselves out.
And, thanks to all of you for your emails yesterday. I will strive to make my posts more succinct for those who want the headlines, and still offer excruciating detail for fellow chart rats.
More charts coming shortly.
UPDATE: 3:30 PM
Not much going on since this morning’s ramp. Still long, still looking for higher. Though we tagged the .618 of the most recent dip, so we can expect the usual pull back. Keep an eye on the 15-min channel for signs of anything more than that.
I’ve been scanning various indices to see what, if anything, they might have to say — ideally in harmony, if not in unison.
First, let’s orient ourselves to the longer term channels. The set shown on the first chart above stem from some pretty authoritative fan lines from the 2007 top and 2009 bottom.
So, when we chart the various upside targets based on channels and trend lines, they’re not the least bit arbitrary.
TL 3 is the top fan line off the 2007 top. TL 2 is parallel to another fan line off the top. TL 1 is pretty obvious, and has already been broken anyway. And the purple channel guiding the upside since 1266 is formed by a fan line off the 2009 and another line parallel to it.
The most likely turning points as we continue upward will be the intersection of these fan lines and key Fibonacci levels — such as the .786 at 1389 and the .886 at 1404. Remember, 1404 is also the target level of the inverse H&S pattern from June — indicated in white.
The purple channel itself allows for any of these potential targets, whereas the rising wedge that had been under construction maxed out around 1404. That wedge still resonates with me, because so many wedges, when they break down, go back and tag the original apex price level. Here’s what I mean:
The same thing just happened on DX in a very nice payoff to our call of a top on Tuesday [see: Update on the Dollar.]
It’s happened so many times to me that I actively look for it now, and I find it interesting that a pretty clean RW can be drawn with a 1404 apex.
From current prices, the various upside targets represent only a 2.5 – 3.8% increase for SPX. The other indices are similarly positioned. NYA, for instance, needs only 3.5% to reach its inverse H&S target, or 4.3% to reach its Fib .786 at 8091.
DJIA needs 1.3% to reach its .786 and 2.9% for its IH&S target.
And, RUT is only 6.9% away from its .786 and IH&S target, both of which are at 821.
Bottom line – not much further to go before it’s do or die time. I have to run out for a meeting. I’ll post more later if I can.
Hi, I’m pebblewriter and I’m a chart geek. With that confession out of the way, I have to apologize. While some of my fellow chart geeks would love nothing more than twenty pages on the correlation between stocks and the core temperatures of migratory nematodes, others just want to know where the market’s heading today.
In broker school in the last century, they cautioned us that when someone asks what time it is, they’re probably not asking how a watch works. I will attempt to be more mindful of both audiences going forward and stifle my Faulknerian tendencies.
I went long at yesterday’s bounce off the dashed, red channel line yesterday (1331ish), but with the understanding that a break of the trend line will likely send SPX down to test the big purple rising channel line — currently around 1316. I raised my stops a bit from 1324 to 1329.
I’m cautious about laying out these “rules” as gospel. They’re not. Quite often, when my evil plans aren’t coming together, I’ll search around for some corroborating evidence (well, first I’ll reach for some Oreos, depending on how badly I blew it.) Bottom line, I sometimes change my mind and give the markets a little more breathing room than I originally planned.
Stops are a wonderful thing, but they’re often just a (necessary) substitute for common sense and clarity of thinking. Market makers are very prone to pushing markets around just enough to screw all the investors with stops (in all the logical places) before allowing a more sensible move to develop.
So, if you want to have some context to what’s going on, read more than just the headlines — mine or anyone else’s. Sometimes it helps to know how the watch works. We’ll both sleep better.
There are no shortage of reasons for the market to crash here and now, plunging to below zero and not surfacing again until it pops out in Tian’anmen. But, I see more and more groundwork being laid for QE. Witness this story in last night’s NY Times.
I think we’re fast approaching the “pull out all the stops” stage of the market where careers are at stake in New York, London, Tokyo, Hong Kong, Singapore, Shanghai, Paris, Frankfurt, Sydney and Amsterdam — not to mention DC and a few other key capitols.
more in a few…
UPDATE: 2:00 PM
We’re getting a decent bounce here. The key, as always, is where we close.
I was asked below about AAPL. The short answer is yes, I watch it just about every day. No other volatile stock has as much sway in the markets. If the market is able to rally on a day when AAPL is tanking, for instance, it says a lot about the market’s inner strength.
Here’s the heat map TOS produced for NDX at 10am this morning:
I had a feeling we were in for something big last week when AAPL failed to extend the rising wedge (accented in yellow) and break through the latest white channel line off the April highs.And, rarely has AAPL’s RSI chart been clearer. Note the dashed red line running across the top of the latest peak, and the white channel lines that caught the downside this morning.
Like the rest of the market, RUT is exhibiting either a pretty deep retracement in the midst of a triangle wave higher or something more onerous — the early stages of a wave 3. While the jury is still out, I believe the charts favor the former.
RUT finished a Bat Pattern (in red below) yesterday — this on the tail end of another Bat pattern that I posted just the other day.
Yesterday’s low also registers as a .618 retracement of the AD leg of the first Bat pattern (.618 of 729.75 to 820.44.) which is a typical payoff to a Bat pattern completion.
The rising wedge we’ve been following will have pretty convincingly widened to a channel if it’s able to close at these levels. We just reached the .886 of the latest dip, meaning we’re likely near the bottom of this latest move.
The proposed channel lines (purple) are parallel to some pretty important ones, seen here in a 3-yr daily chart. So, there’s a good chance that they’ll hold up over time.
Note how the smaller purple channel is parallel to the larger one in which it resides. The only thing that troubles me is the price action around June 4. I don’t like leaving a few days out of the channel pattern; it feels like a bit of a cheat.
So, I think we have to at least be open to the idea of a drop to the larger channel line — in line with the June 4 low. Such a drop would be to around 1316.
Note that I’ve moved the red channel line down a smidge, lining it up with the Oct 27 high. It gives us a bit more room on the downside, today.
There’s also an apparent H&S pattern that’s been set up with the (now failure of the) latest move higher. In studying the pattern, though, the left shoulder and head are almost exactly the same height — 57 points. In a proper pattern, the head would be higher than either shoulder. But, sometimes these things bend the rules a bit, and that could happen here.
The key will be whether we can maintain the 1325.41 low from July 12. If so, we have a series of higher highs and higher lows – no matter how bearish things feel. If not, there are plenty of downside targets from which to choose — including the aforementioned 1316.
If you weren’t stopped out this morning, 1324 might make a good choice to place a stop, with 1316 the next stop.
UPDATE: 3:45 PM
SPX has formed a pretty clean-looking falling wedge on the 30-min chart. It’s not definitive, however, as it has the potential for widening/lower prices.
We tagged two major RSI TL’s on the daily chart, as well.
Likewise, VIX has nearly reached an important intersection of several channel lines and has, as yet, failed to retake a higher high than the presumed H&S right shoulder.
There is significant negative divergence on the dollar on both a daily and weekly basis.
DX is also very close to completing those harmonic patterns it hasn’t already completed.
It’s approaching the .707 of the largest (yellow) pattern, tagged the 1.272 of the next largest (purple) pattern, tagged the 1.618 of the red pattern, nearing the 1.618 of the pale blue pattern and the 1.272 of the smallest Butterfly pattern, seen in the chart below.
DX is also approaching the price level of the last rising wedge apex — which is the next best thing to an actual back test to the RW itself. No guarantees — because the dollar is suddenly the asset everyone wants to own — even if it costs money to do so.
I have a bunch of charts to post this morning. Check back around 10 AM EDT.
Looks like I jumped the gun Friday, getting back in too early after scoring 15 points on the downside. We have a substantial cushion, being up 626 points/45% since inception on March 22, but I really hate giving any of it back on a off-hours dump like this.
As I posted Friday:
If you didn’t get short ahead of time, the likely downside of this push is the small channel bound at around 1364. I don’t think it would be worth jumping in at this point. Of course, if we break 1360, it’s a different story.
Having a stop at 1360 doesn’t help much when the market gaps open down 20 points. So, we’ll focus on where we’re likely to end up today.
While the upper bound of our rising wedge has been pretty clear, the bottom has so far refused to present a crystal clear picture. Whether or not to include which tails has left the exact slope muddled, which means it’s difficult to anticipate the probable low this morning.
There is a trend line (yellow, dashed) in the daily RSI that indicates a bottom is already in, but it’s not a TL or channel line I’ve been following, so it warrants further study.
It caught the tumbles on Apr 10 (-28.25), June 11 (-42.25), June 25 (-24), July 12 (-19.75) and is thus skilled at putting a stop to big drops. It has just been tagged this morning. (more…)
Bat Patterns are one of the more common harmonic patterns. They are similar to Gartley Patterns, except that the AB retracement can be anywhere less than the Fibonacci .618 of the XA leg and the AD leg completes at the .886.
Because the AB leg can be anything < .618, we have to be a little careful as we approach the .618. A reversal at .600, for instance, could be a Bat or a Gartley that came up a little short. So for those that are close enough to go either way, we’re cautious around the .786 (the Gartley completion) too.
Likewise, a presumed Bat pattern that is approaching the .786 on its CD leg can throw us a curve and put in a bigger reversal there than at the .618. If this happens, there’s a pretty good chance we need to move the Point B to the .786 and prepare for a Butterfly Pattern extension to the .1.272 or 1.618.
Likewise, a Bat Pattern that completes at the .886 could evolve into a Crab Pattern — which features a Point B anywhere up to the .886. The pattern above, for instance, could be just the XA and AB legs, with an ultimate completion at the 1.618 of 892.12. Bottom line, either play a minor reversal at the .886 or have a pretty clear idea of the medium and longer-term potential.
In the chart above, for instance, there’s a trend line that should provide support near the last session’s low. So, there’s a decent chance that the existing reversal is all we’ll see. As always, stops are recommended just beyond the expected target just in case the pattern fails — as it does about 30% of the time.