Month: July 2012

  • Update on RUT: July 5, 2012

    RUT is again nearing its previous highs of 856 (July ’07) and 868 (May 2011.)  It’s already exceeded the .886 of each of those, and is rapidly approaching the .886 retracement of its most recent dip from 848 to 730 (March 27 – June 4, 2012).

    As charted back on June 15 [see: Forecasts, Darts and Ouija Boards] we completed an Inverse H&S pattern that reversed the traditional H&S completed on May 8.

    continued…

    (more…)

  • The Fork in the Road

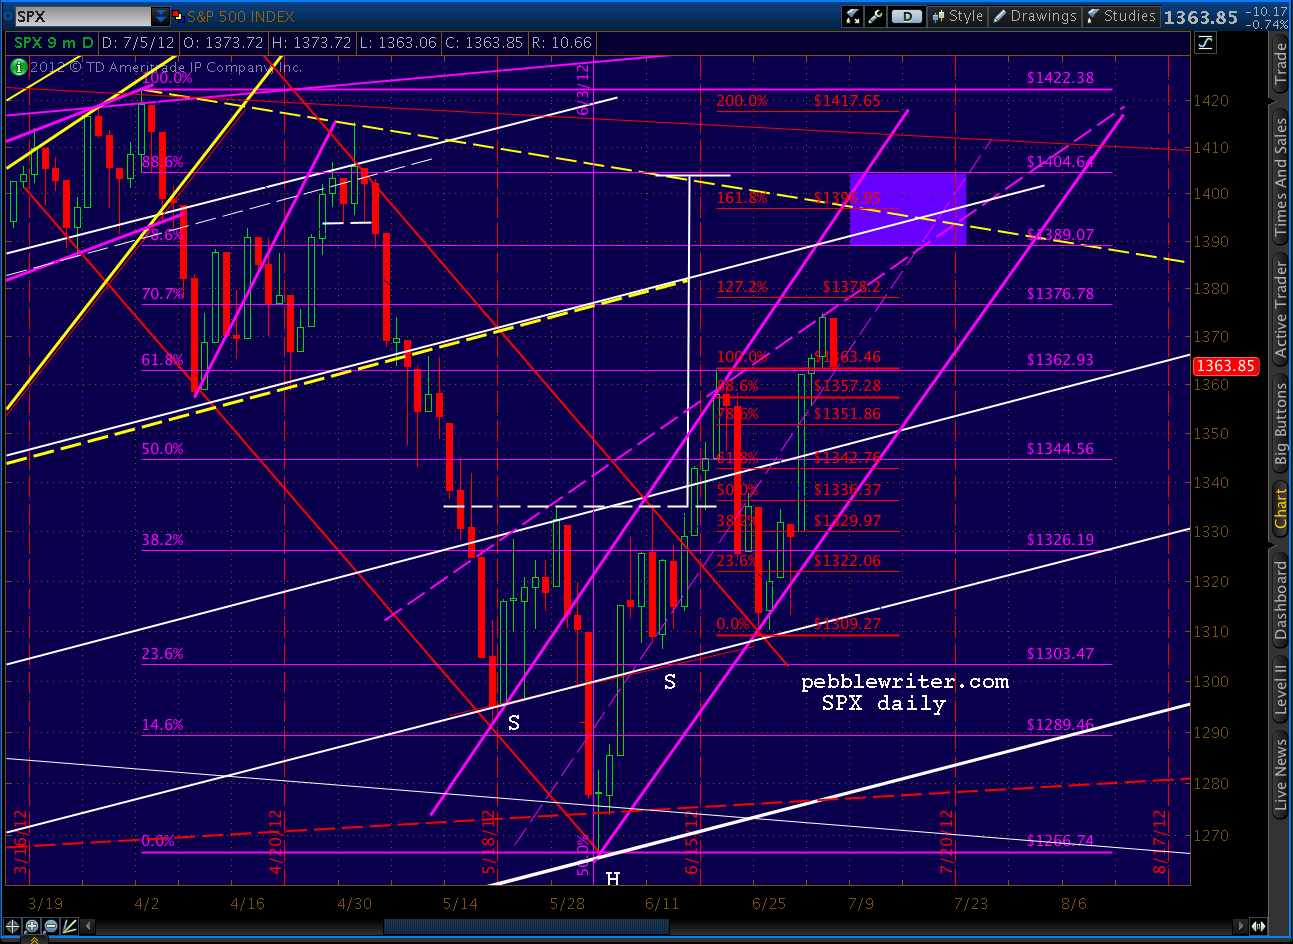
    We’re getting everything we anticipated on Tuesday, with the notable exception of that 1.272 tag at 1378.20 before a reversal to 1363 [see: Going For It.]

    “Note that the 1.272 of 1378.20 is very close to the larger (purple) pattern’s .707 of 1376.78 — lending credence to the idea of an interim reversal there.  The likely target is the Fib level around 1363 — the larger pattern’s .618 and our previous high.”
    We only reached 1374.81 instead of 1378.20. But, as we discussed Tuesday, the close at 1374.02 (on the presumed rising wedge upper bound – purple, dashed line) strengthens the case for the rising wedge pattern.

    It’s important.  While either the rising wedge or the channel could get us to our price targets, it has huge implications for what happens next.

    Rising wedges spell the end of an uptrend.  Channels can go on for a long, long time.  So, which is it?

    Note our price target — the highlighted rectangle that ranges from 1389 to 1404.  The channel can get there quite easily — as early as Monday or Tuesday of next week.  The rising wedge doesn’t reach those prices until the 17th or so.

    I suspect the biggest deciding factor will be the upcoming summit of European Finance Ministers on July 9-10.  There are several issues at play.

    The recent Spanish bailout announcement boosted markets because, in a nutshell, banks would get up to $100 billion directly (asset purchases) from the ESM.  Importantly, existing debt would not be subordinated to the new debt and the ECB would gain more control over the various sovereign central banks.

    Now, with Eurogroup/ECOFIN only a few days away, some serious problems remain with the “solution.”  First, the ESM doesn’t actually exist yet.  As the effective successor to the ESFS, its existence requires approval by member states representing 90% of the capital base.  So far, Finland, the Netherlands and Slovakia (combined, about 9%) are balking. As long as everyone else is aboard, this should not be an issue.  But, if not…

    Second, Germany is balking.  Not Angela Merkel, of course, but seemingly everyone else is dead set against backstopping failing foreign governments and banks.  They are justified, as we discussed at length when Greece was in the cross hairs.  Why should Germany, with a retirement age of 67, put itself on the line for countries whose retirement benefits kick in at age 60?

    Pulling out now would be a no-brainer, if not for the fact that so much of the German economy relies on its less fortunate neighbors.  Sales, production, suppliers, investment, etc — it’s a tangled web.  The $64 billion question is whether Germany would suffer more pain/expense from pulling out now or from seeing the whole mess through to the bitter end.

    Germany’s constitutional court is considering an injunction that would impede ESM ratification.  Oral proceedings are scheduled for July 10.  German Finance Minister Martin Kotthaus has been quoted as saying he doubts whether the troika (EC, ECB and IMF) can approve the ESM by Monday.

    Last, even if the ESM survives the various challenges, will it be enough to do the trick?  Nearly 40% of the fund’s capital contributions would presumably come from Italy, Spain, Greece, Portugal and Ireland.  Add in France, and the total is closer to 60%.  Can the ESM maintain its value if 40-60% of its guarantors are in or near insolvency?

    This situation is very fluid, and has potentially devastating consequences.  I highly recommend staying on top of the steady flow of news from sources such as Zerohedge.

    More charts for members will be out in the next hour or so.

     

  • Going For It

    ORIGINAL POST:  11:15 AM

    In something akin to a recess appointment, the market is making a run for our target area (the rectangle in the chart below) during a holiday-shortened trading session.  We’ll look at the chances it has of getting there and the most likely impediments.

    First, the little pullback we had to the midline yesterday was the 10-15 points I’d been discussing.  I wondered whether we’d get something bigger, but this morning’s action lays that option to rest.  It does, however, open the door to a bigger pullback at the 1.272 coming up.

    continued…

    (more…)

  • Reality Check

    ORIGINAL POST:   9:50 AM

    The ISM Manufacturing Report on Business is due out in a few minutes.  The details can be found here.

    It’s worth noting that the majority of global ISM reports have come in worse than the previous month and in a contracting state.  Zerohedge article and chart here.

    As I mentioned Friday, we are due for a little pull back.  It’s a midline of our rising RSI channel, which doesn’t always matter, but can frequently be good for a short-term trade.  I’ll be watching closely for a reaction off these numbers.

    Stay tuned.

    UPDATE:  10:05 AM

    The US has joined the party and is now doing the contraction limbo along with most of the euro zone countries.  The overall index fell from a modestly positive 53.5 to a modestly negative 49.7.  This is the first official contraction in PMI since July 2009 (readings below 50 indicate contraction.)

    Prices suffered a serious setback with a drop of 10.5 percentage points to 37.  Exports, impacted by a higher dollar, are also down significantly.  Put them together, and you get a new order reading that fell  12.3 points from a moderately positive 60.1 to a negative 47.8.

    Offsetting the negative manufacturing report somewhat is a better than expected Census Bureau report on May construction spending. Total spending was up 0.9% versus expectations of +0.2% and April growth of 0.3% (revised to 0.6%.)

    These are the seasonally adjusted figures  (the unadjusted figures aren’t very much off, for a change.)

    My take on all this…  manufacturers like to run near full capacity.  They’re able to use their inventory, plant and equipment and labor force more efficiently and will likely see higher profits as a result.

    Most real estate developers I know have to run at full capacity.  They’re leveraged up the wazzu and, like sharks, will die if they don’t keep moving forward.  Debt is usually against a project, rather than their personal balance sheets, so if they can find a bank dumb enough to lend on something — they’re building it.

    Given the choice of which tea leaves to read, I’ll go with the ISM report.  Even unjustified overbuilding can lead to positive economic knock on effects.  But, like consumer spending (that continues to rise despite a contraction in consumer income) there’s a real risk that the move won’t be sustainable.  We need a side of substance to go with our form.

    UPDATE:  11:10 AM

    Now, onto our charts:

    (more…)

  • Update on COMP: July 2, 2012

    July 2, 2012

    COMP appears to be following a set of channels within a much larger channel we identified months ago.

    Whether it has the wherewithal to rise up out of the large red channel remains to be seen.  In the meantime, we’ll focus on the short to medium-term picture.

    (more…)