Month: June 2012

  • So Crazy It Just Might Work

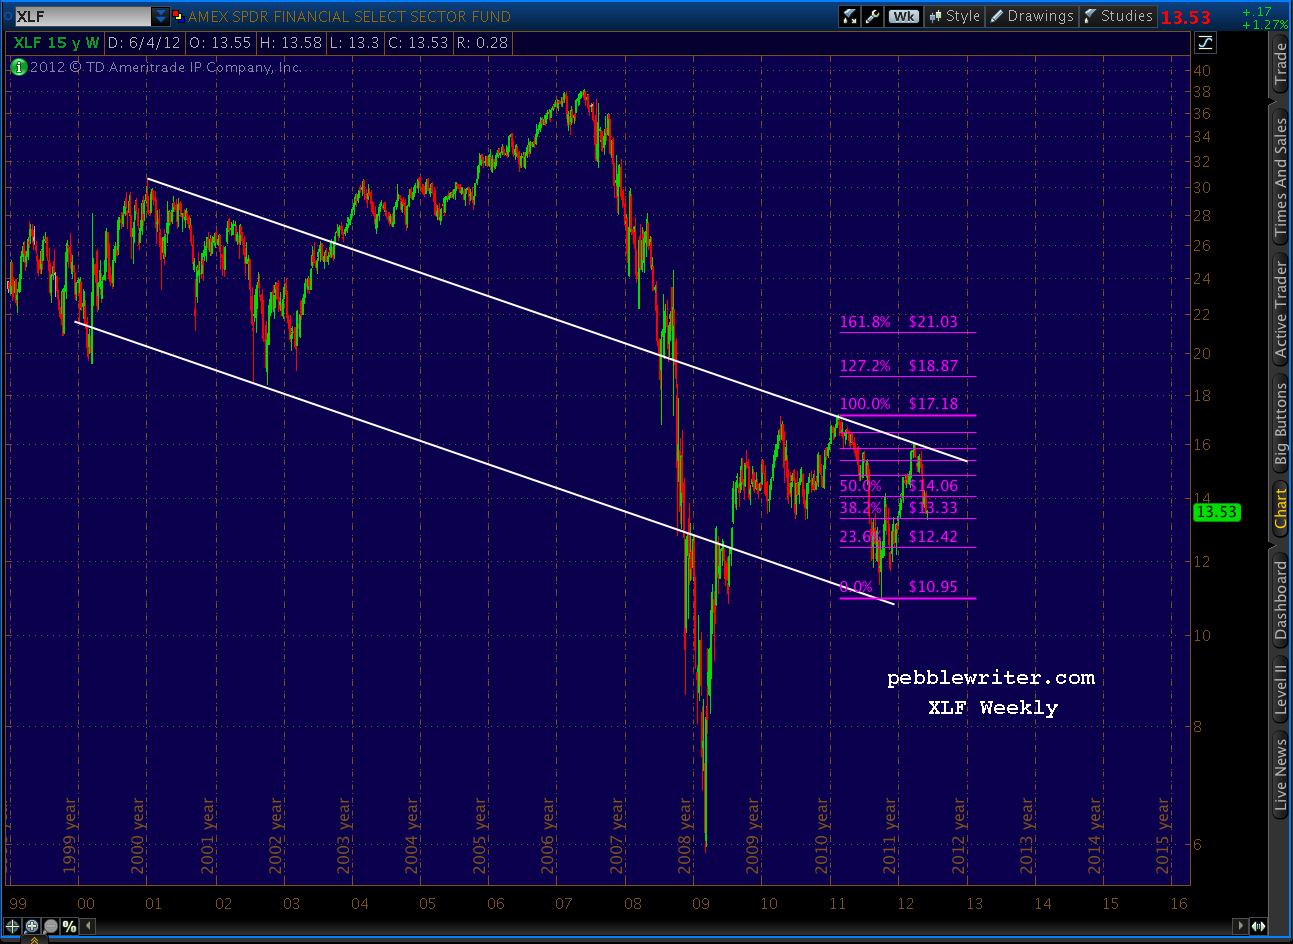
    As a member correctly pointed out in his comment on XLF Update, a ramp in XLF would mean some big returns for important components such as BAC, C, JPM, etc.  This is very true.  Though it pains me to say it, I think banks are ready for a bounce.

    I sold all my remaining JPM, GS and MS puts today.  I jumped on the downside March 27 when JPM was 46 [see: End of the Line], GS was 127, and MS was 20 [see: Lots More Where That Came From.]

    I bought puts, but even straight-up short positions would have made some decent returns over the past nine weeks:

    JPM:       46 – 32 = 31%
    GS:       127 – 92 = 28%
    MS:    20 – 12.50 = 38%

    But, all good things must come to an end, and I think the tide is turning for financials.  Don’t get me wrong…I still think they’re dead meat in the longer term.  I just think we’re looking at a sizable bounce here and now if — and let me be clear, it’s a very important IF — the rumors are true and Kumbaya Banking and Quantitative Whatever are back.

    If not, this entire exercise isn’t worth the bytes it’s written with.  The financials, along with just about everything else Bloomberg quotes, will roll over and die.  OK, with that huge caveat out of the way — and before you laugh me out of cyberspace — here’s what I’m looking at.

    My targets are as follows…

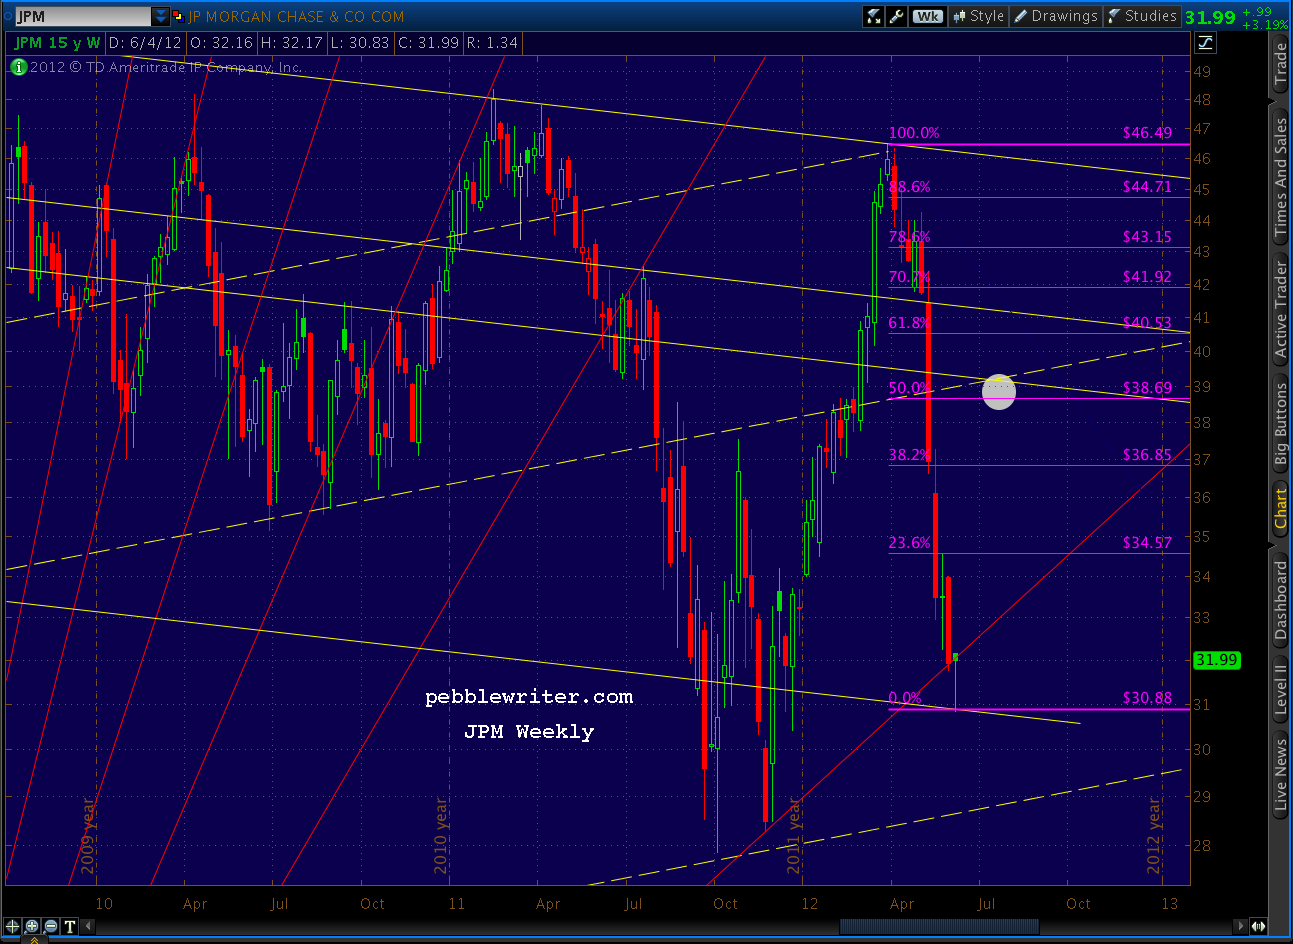
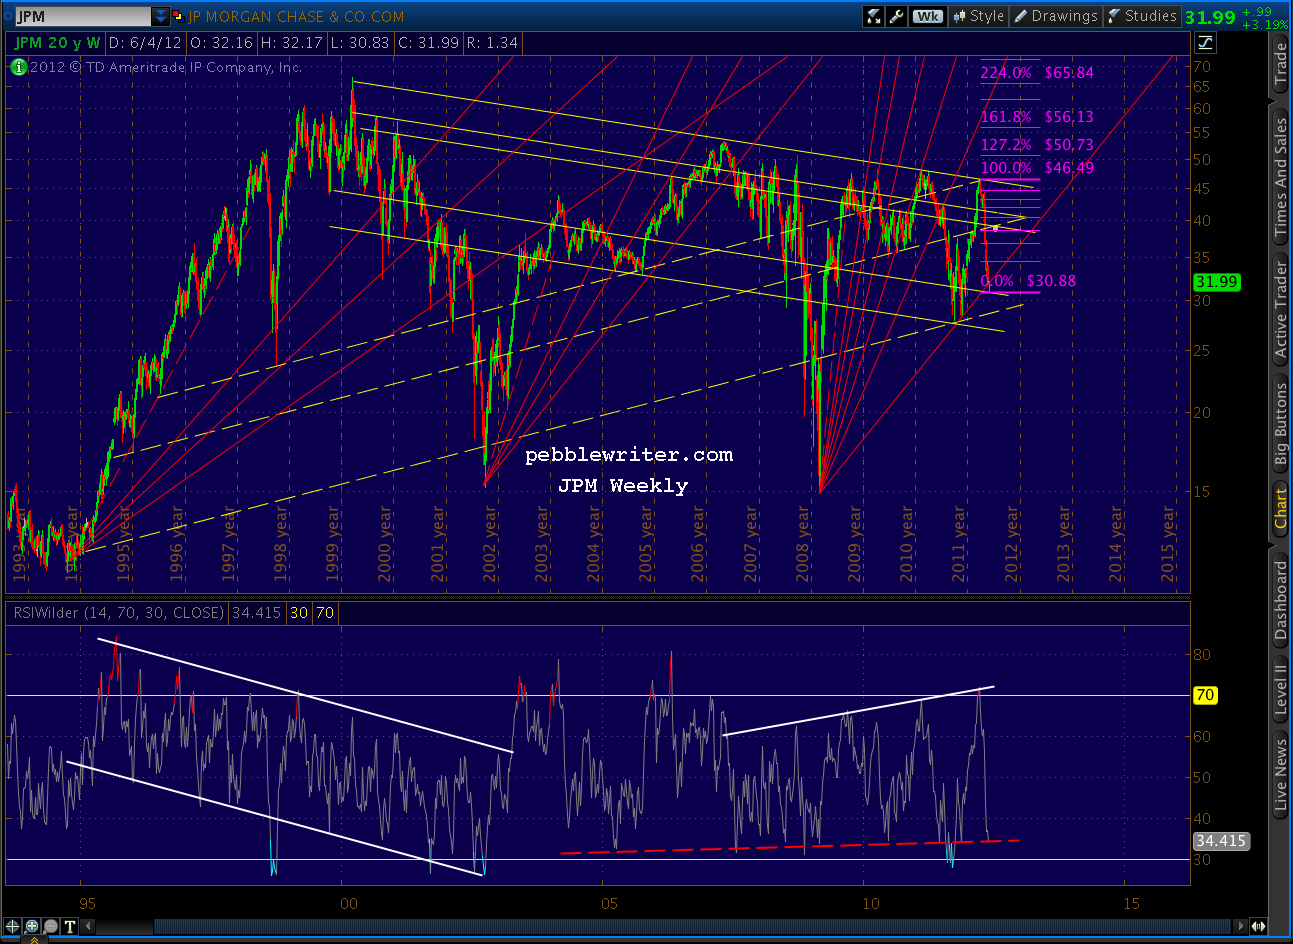
    JPM:  today’s close = 31.99, price target = 38.69 (+21%)
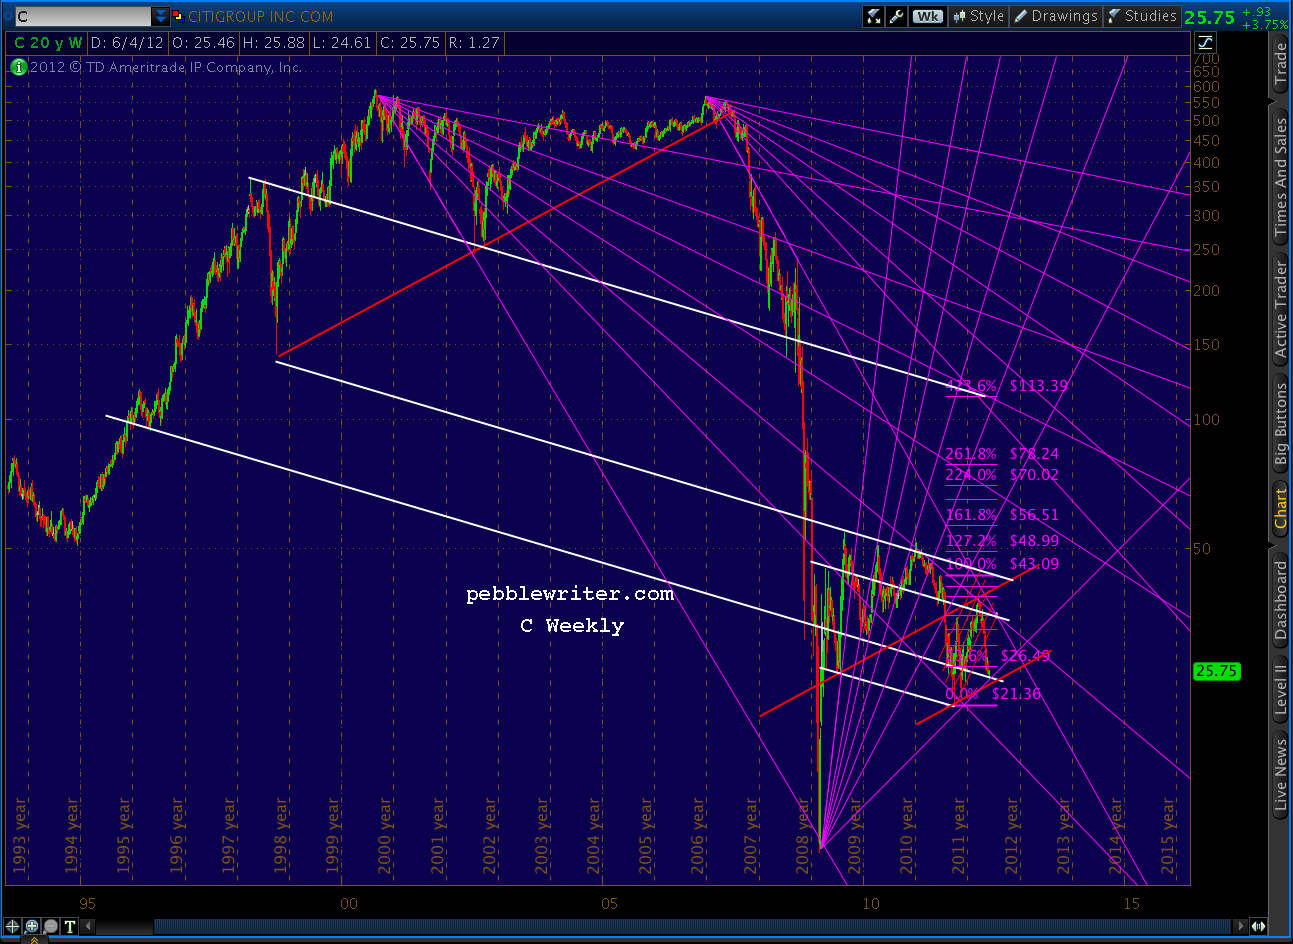
    C:       today’s close = 25.75; price target = 34.79 (+35%)
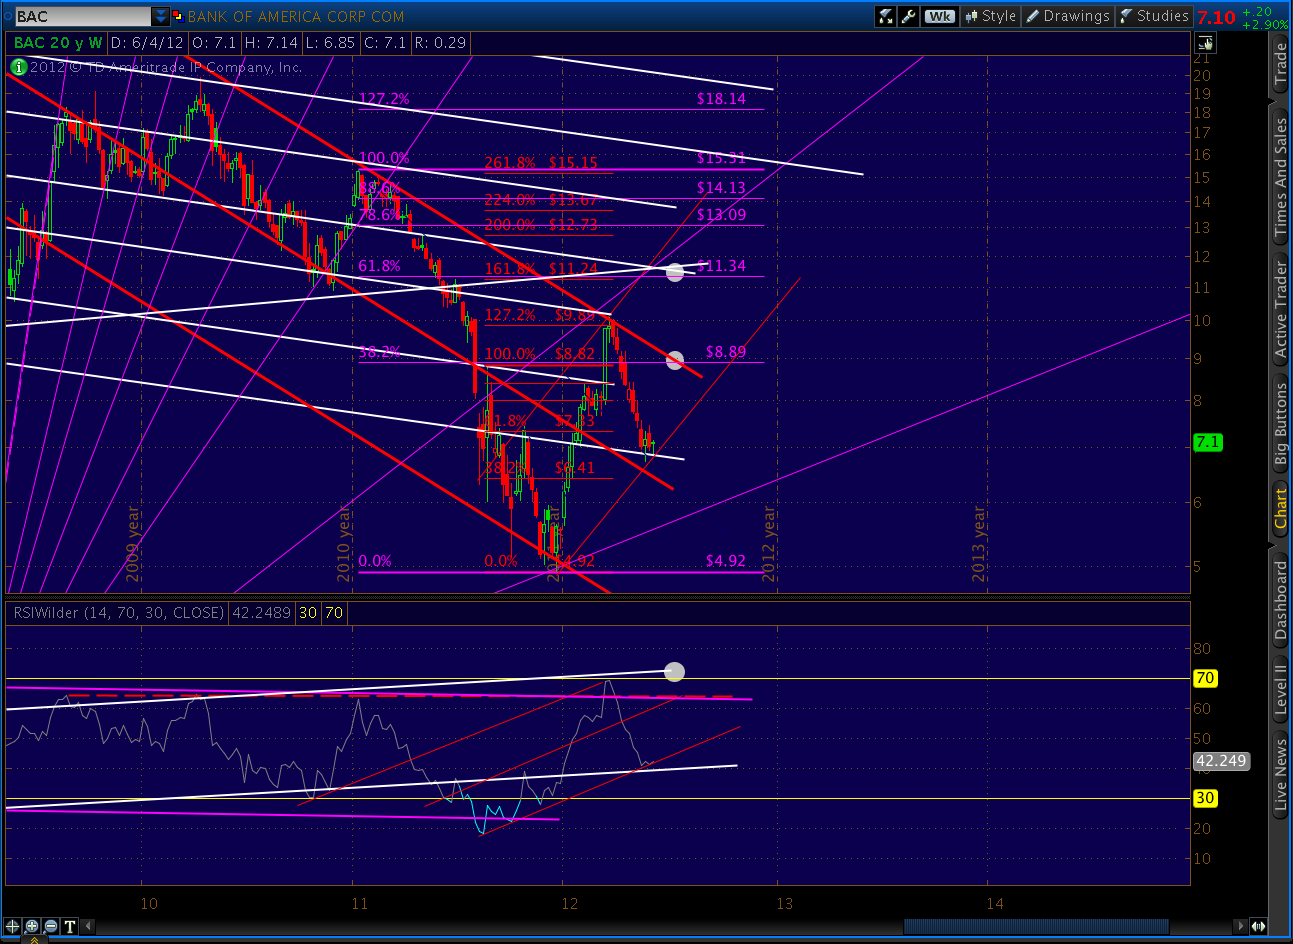
    BAC:    today’s close = 7.10; price target = 11.34 (+60%)

    JPM:
    CITI:

    BAC:

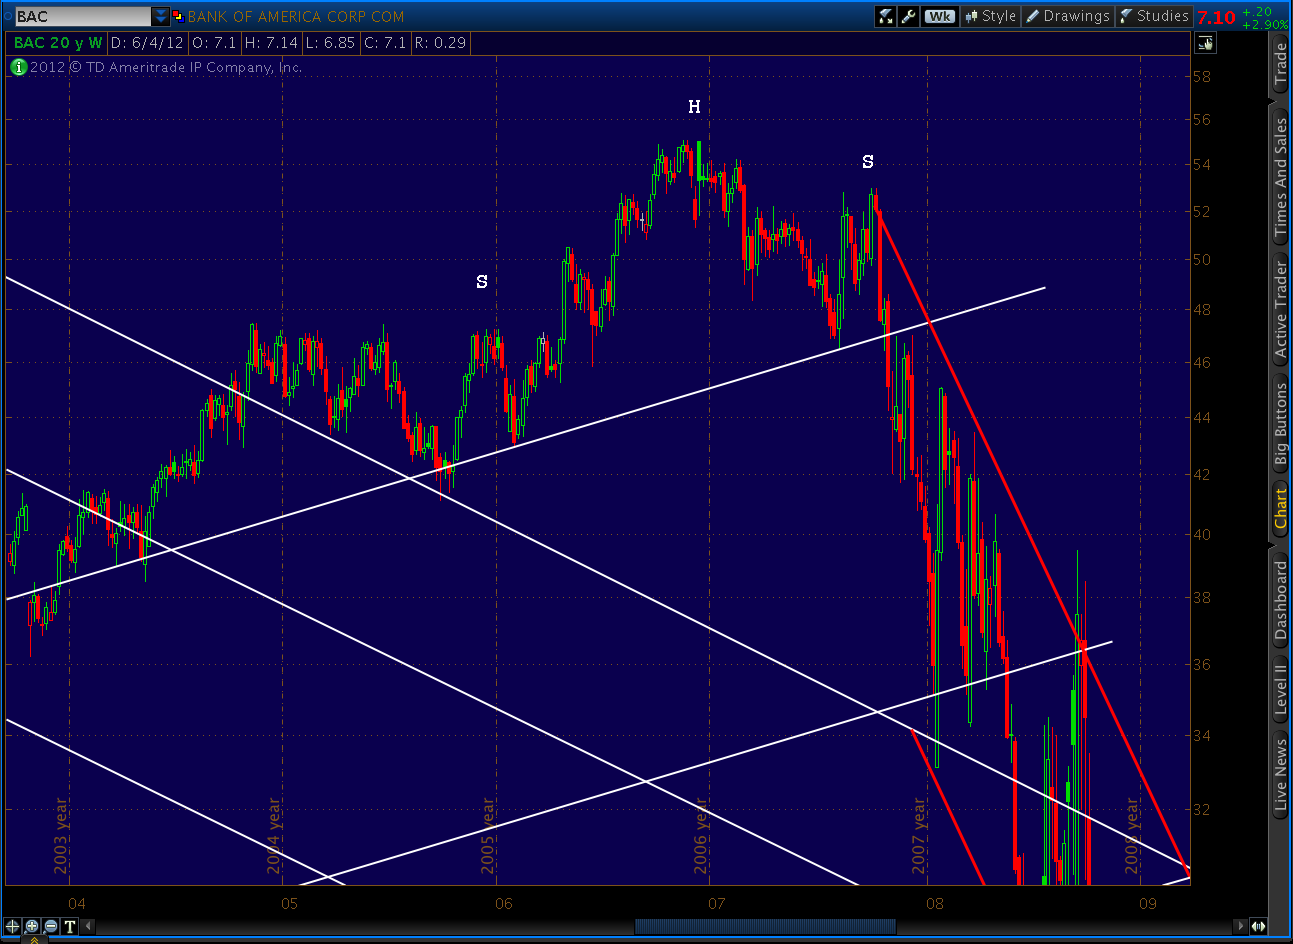
    My favorite.  It starts with this little H&S pattern back in the 2007 market top.  Keep an eye on those ascending trend lines.
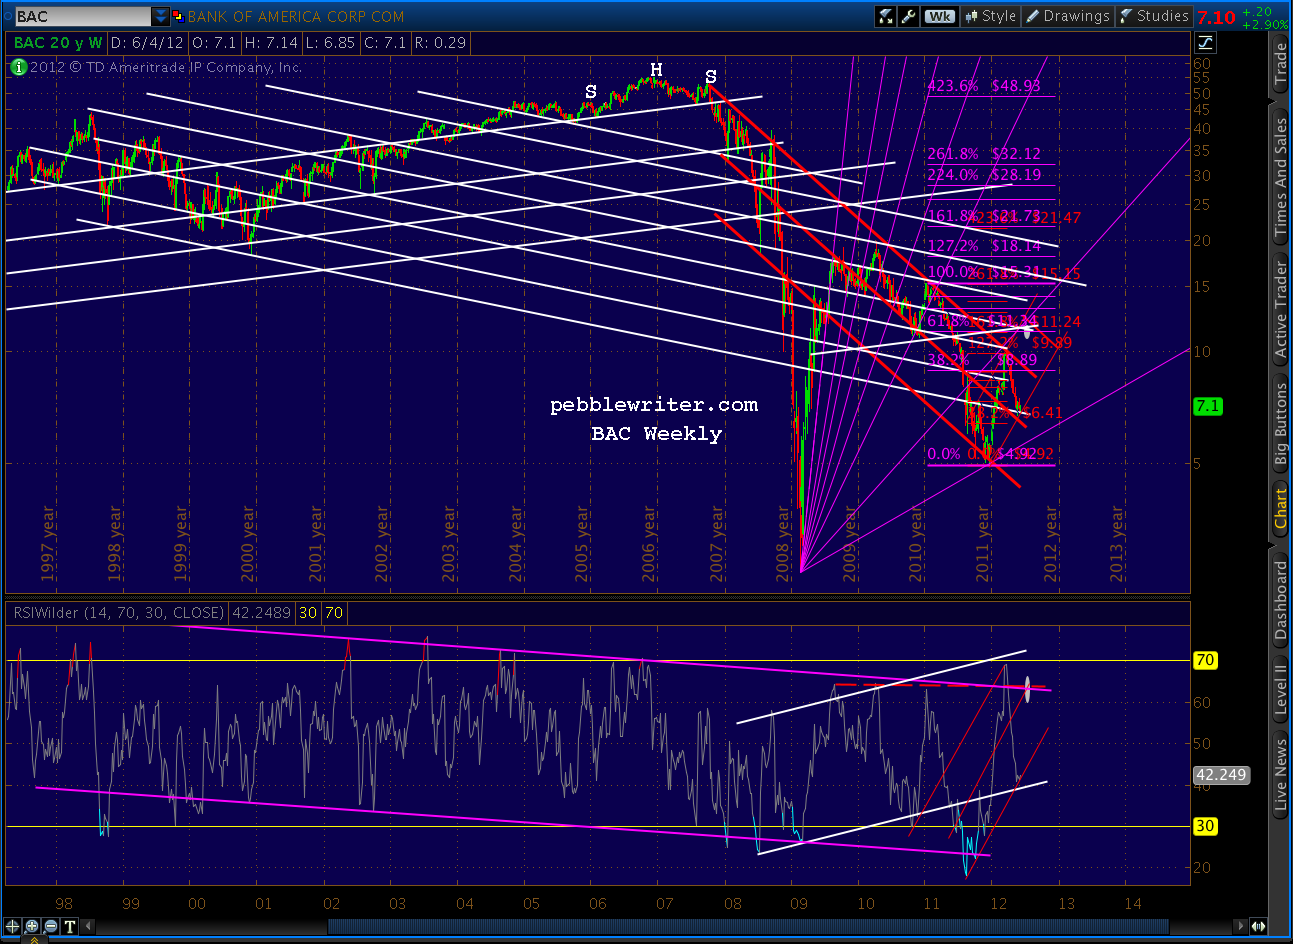
    Here they are again, on the bigger picture, along with some descending ones, and a nice little channel (red) that works pretty well since early 2009.  Couple of nice channels on the RSI, too.
    This one’s a bit of a long-shot, because it means breaking the red fan/channel coming down from the right shoulder up there, but the RSI channel makes me wonder if we might just make it up to that 61.8/1.618 Fib level.  If not, I think 8.89 is a safe bet.
    So, there you go.  Earlier today, XLF July 15 calls sold for .09 and the August 14’s went for .49.  If I’m wrong, they’ll probably go to negative eleventy-hundred.  Then again, it’s so crazy it just might work!


    Right about here, my attorney would want me to remind you this is not an investment recommendation — nor is anything on pebblewriter.com.  Investing is risky, and options are a particularly effective way to end up living in a van down by the river.  For full risk advisory and other legal disclosures, read this.

  • XLF Update – June 5, 2012

    Financials play a pivotal role in the markets.  They led the way as they enabled the previous run-ups and bubbles, and they led the way down when the house of cards was revealed for what it was.  The survival of nearly all markets is hanging by a QE thread, so we’ll take a fresh look at XLF to see what the charts are saying.

    We’ll start with the weekly chart going back to inception in December 1998 — lot of water under the bridge with this ETF.

    Fortunately, for us analyst types, it’s been very amenable to chart patterns and Fibonacci analysis.  Consider this chart, that helped me call a top in banking stocks in late March [see: End of the Line and Lots More Where That Came From.]  Note the well-defined channel and the Gartley Pattern reaction at the .786 Fibonacci level.

    I’ve put together a series of charts that, I think tell a pretty compelling story regarding XLF’s future.

    continued…

    (more…)

  • Oil’s Balancing Act

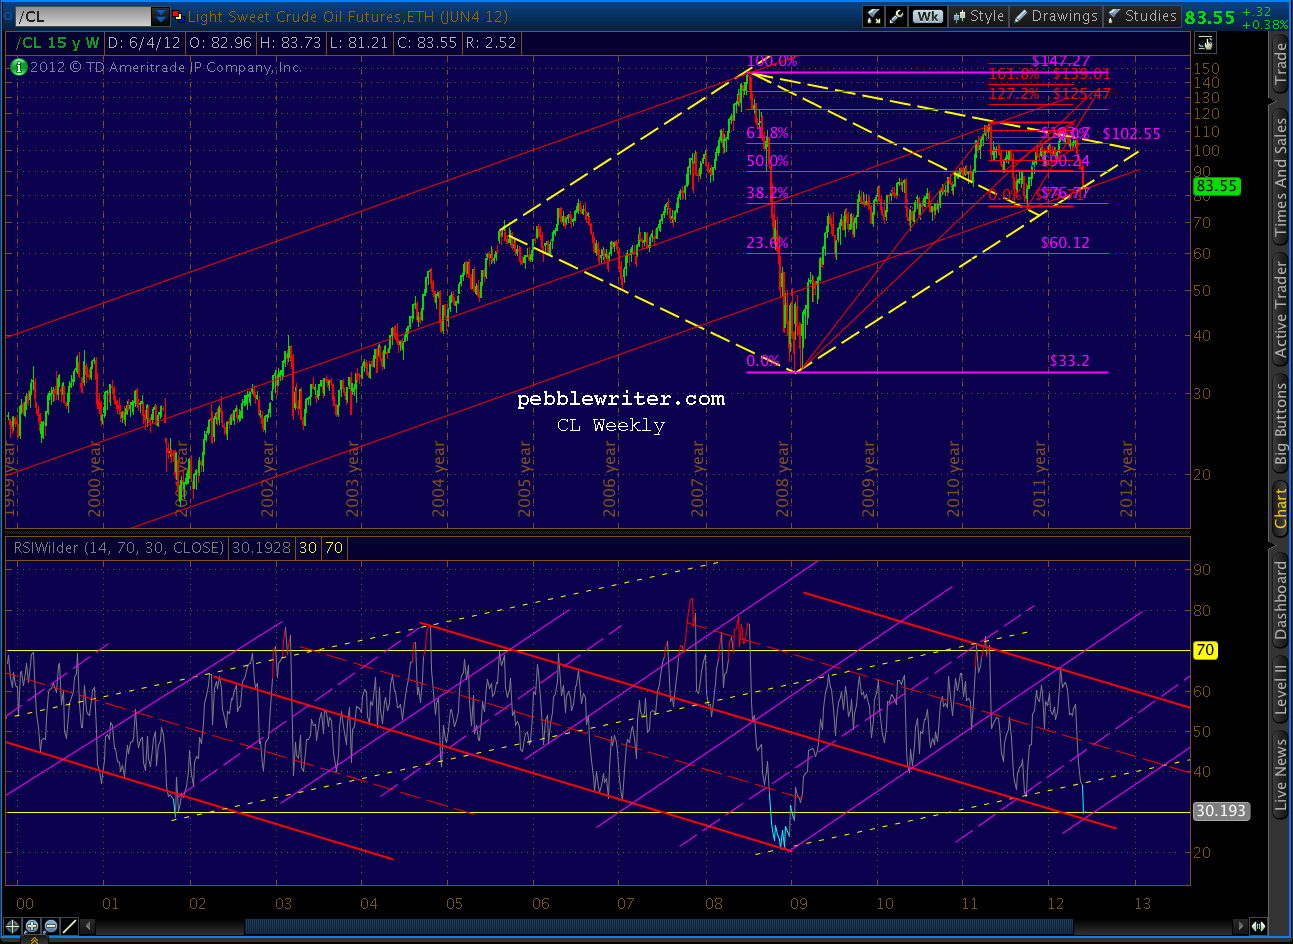
    Many readers have been asking about oil.  It’s not that I haven’t been interested, it’s just been a real bear to analyze.  Here, after a dozen hours of racking my brain, is where I see it.

    Like many stock indices and currencies, Crude Light (CL) is at a critical stage.  It reached 114.83 after breaking out of a diamond pattern in April 2011, only to back test the diamond six months later at 74.95.  It then retraced .886 of that plunge, setting a lower high of 110.55 in February before plummeting once again as low as this morning’s 81.21 (the .886 is just below at 79.01.)

    CL now balances on a precipice, where a move in either direction is likely to be huge.  We’ll examine why, and which course is more likely.

    continued…

    (more…)

  • NYA Update – June 3, 2012

    The May 8 forecast for NYA was for the index to plunge from 7815 to 7340.  The forecast worked out well, as Friday’s low was 7286 (a quick 7% return, yay!)  As noted in that update, 7340 doesn’t really match up with any particular Fibonacci levels.  And, it doesn’t intersect with the rising wedge until early August (the highlighted oval.)

    I didn’t really see it taking that long to play out, and the market obliged for a change.  It also obliged by precisely tagging the fan line I had drawn off the Oct 2007 top (yellow, dashed) and one of the parallel horizontal channel lines (redrawn as red, dashed line E for emphasis.)

    We still haven’t landed exactly on a Fib level, so we either just overshot the .500 or haven’t yet reached the .618 target of  7145.  Deciding which it is presents some interesting questions.

    continued…

    (more…)

  • Channeling VIX

    VIX has very nearly reached the channel mid-line, Inverse H&S and Crab pattern targets I posted back on April 18  [see: VIX at a Crossroads], though we’re 2 days behind schedule.

    Our IHS target was 28.10 and the Crab pattern target was 27.12, expected to occur on May 30.)  Friday’s high was a very close 26.71.  It’s close enough to be considered complete, but a little follow through Monday morning would tie things up in a nice neat bow.

    continued below…

    (more…)

  • The End Game

    Although the attached is a presentation on the current status of our wounded economy — limping onto the field one last time, hoping against hope that the steroids will last another 15 minutes, it also describes the turn your relationship with friends and family will take when sharing with them your scary new world view after reading this presentation.

    Best read it when you’re not going to be around civilians for a while.  From hedge fund manager Raoul Pal of Global Macro Investors: The End Game.


  • Why I’m Buying

    ORIGINAL POST: 10:05 AM

    I’m a bit surprised the Plunge Protection Team didn’t protect 1292 (but I imagine it means a Fed governor or the Bernank himself will be making an appearance sometime this morning.)

    I had set a mental stop level of 1295 yesterday, given the ongoing weakness in the euro and inability of the market to close positive on the day.  Two schools of thought going into the NFP release this morning: (1) that they would manipulate it upward, as usual, or; (2) that a brutally honest (hence, depressing) number would clear the decks for QE.

    I think the enormity of the miss (69,000 vs 150,000 expectations) clears the deck — and then some.  From a charting standpoint, it doesn’t hurt that we just completed a bullish Crab pattern at the bottom of a pretty convincing looking falling wedge with the SMA 200 just below current prices at 1284.56.  So, I not only lifted my remaining stops as the market fell this morning, I am buying more here at 1287.

    (more…)