Month: January 2012

  • Charts I’m Watching: January 5, 2012

    UPDATE:  1:40 PM

    I’ve been doing a lot of work with RSI lately — particularly with trend lines and, today, looking at harmonics.  I was somewhat surprised to see that relative strength moves in harmonic patterns just like underlying stocks.

    The past three major turning points (P2, Minutes 2 and 4 of Minor 1) came as RSI completed a Fibonacci .886 retrace of the previous decline.  Now, as we’re trying to determine whether Minor 2 is over or in the process of ending, it’s very interesting that RSI is, again, approaching the .886 of its recent decline.

    I know this chart is a little busy, so I’ve split it into two parts:  the first shows the time periods involved and the second expands the RSI study pane to better show the Fibonacci retracements. 

    As of 1:55 PM, RSI stands at 61.5 versus the .886 target of 61.9.   It’s also hard to miss the fact that it’s closing in on the red dashed overhead trend line that’s marked the past five significant reversals.

    ***

    After a 12-pt drop, SPX has recovered for a 5-pt gain.  But, we’ve clearly broken the channel that was guiding the upside since Dec 16.

    With this last little spurt, SPX tagged again the major channel midline (yellow, dashed), completed a double top (triple if we count 1292) and completed a little Butterfly pattern that looks ready to reverse. 

    In the meantime, EURUSD broke through the latest diagonal, completed its Butterfly to the 1.272 extension…so far.  As we’ve seen lately, these things can and do extend to the 1.618 which would be 1.2723.

    XLF, which we’ve been watching for the past few days, touched it’s descending broadening wedge upper bound today, reaching 13.55 (versus our 13.65 Gartley target.)  That could be the end of the run, or we could get one last push up to 13.65 before the downturn.  Stay tuned.

    ORIGINAL POST:

    Setting aside all the noise and confusion, the market still hasn’t managed to break 1288-1292 — the mark necessary to signal a move higher to 1307.  So, for now, we’re left with a 1292 Minor 2 top followed by a .886 minute [ii] retracement of a 130-pt minute [i] of Minor 3 down. 

    If we break 1288-1292, then Minor 2 gets moved over to that new high, and we look for the beginning of Minute [i] of Minor 3 down.  Either way, the market is set to tumble significantly from either here or slightly higher than here.

  • Charts I’m Watching — January 4, 2012

    UPDATE:  12:00 PM

    Taking advantage of the lull in the market to clean up more of the channel lines.  I’m also charting the 1306.50 target via the rising channel (versus rising wedge) just in case we do break 1292.

    Note, 1306.50 is the harmonics target.  There are actually four different trend line targets depending on whether you include the candle shadows on May 2 and/or July 7.

    The market is almost even on the day, but looking at the past several days it appears to be tracing out a small Gartley pattern.  We’re searching for the Point C right now (which, conveniently for the bulls, will be slightly higher than 1275.46 in order to avoid one of those nasty 5 waves down.)

    From there, the .786 beckons at 1263.59 — near the bottom of a broadening descending wedge.  A .618 retrace of AD would then be back to 1276.59 — roughly where we are now.  The RSI on the 15 and 60-min charts support this scenario, as does EURUSD.

    The 60-min chart shows a Butterfly pattern in the works, with a reversal at the .786 Fibonacci.  An extension to the 1.272 would sink through the diagonal support to 1.2799 and set up a back test of the diagonal.

    UPDATE:  10:15 AM

    Update on yesterday’s XLF chart.  I think the broader market is going to have a tough time with the upside case unless financials can take part.  Looks like there will be great difficulty in exceeding 13.65.

    The key to watch will be the gap close at 13.07 — off 2.96% from yesterday’s high.  A return to 13.65 from there would be +4.44%.  A downturn in fulfillment of the larger Butterfly pattern at 10.07 would be -23% from 13.07, -26% from 13.65.

    All things being equal (are they ever?) my hunch is we’ll close the gap, then rally to around 13.65 before plunging to 10.

    There’s a little Gartley in the works on the 15-min chart that would support this move.   Its .786 is, conveniently, 13.08 — a penny from the gap fill.

    ORIGINAL POST:  9:10 AM

    Even with yesterday’s price action (on below average volume), we’re in pretty much the same position as Friday.  We have reached some key harmonic targets, meaning a reversal could happen any time, now.  But, a logical alternate lingers just above at 1307.

    As the chart shows, we reached the 1.618 extension of the small Butterfly (yellow) pattern yesterday at 1282.18.  A .618 reversal would indicate downside to 1261.50 — more than enough to close the 1268 gap from Dec 27.

    The medium-sized pattern is a bit more problematic.  Its Point B slightly exceeded the .618, so technically it shouldn’t qualify as a Crab, yet it’s extended out to its 1.272 — which is neither fish nor fowl.   Crabs reverse at the 1.618, which is at 1306.50.  Remember 1307 is the alternate upside target we’ve kept an eye on since Oct 25.

    Should we exceed 1292 (1288 according to more knowledgeable Ellioticians), 1307 becomes the primary target for completion of Minor 2 and resumption of the bear market.  There’s certainly ample bullish momentum, although the situations in Europe and Iran or any of the economic news expected out this week could change that in a hurry.

    If we are able to reverse after closing the gap, we will likely continue higher in a rising channel that’s the equal of the falling channel that took us down to 1202.

    But, note that the same price action still fits in a much more bearish rising wedge scenario too.  I’ve drawn it with a 1307 apex, but these things rarely go the distance (2/3 is common) and are subject to alteration along the way.

    The currency picture continues to argue the bearish equity case.  EURUSD, despite its decent bounce yesterday, is following the exact same path we detailed last week and remains in the fast lane of a set of channels I drew months ago.  The channel and a fan line were tested but held.  If we break below the diagonal at 1.28-1.29, the next step should be down to 1.2464.

    The dollar tested its rising channel, but so far has bounced back nicely.  It’s working on completing a Crab within a Crab that should see prices advance to 82.568 and then 83.872.

    More shortly.

  • The Calm Before the Storm: January 3, 2012

    UPDATE:  3:45 PM

    The financials have been a huge part of today’s rise.  But, a quick look at the daily XLF chart shows a bumpy road ahead.

    Note the proximity of the upper trend line of the descending broadening wedge.  The last two times that TL have been tested, a severe sell-off ensued.  Note, also, the bearish Gartley pattern that’s formed since late October.  The .786 reversal is at 13.65 — a mere .18 above today’s high.

    But, the most damning evidence of all is the RSI trend line.  XLF’s rallies have all come from a break of the downward sloping trend lines over the past two years.  Each of them eventually peters out when the RSI rises to the trend line from the Apr 2010 high (dashed, yellow.)  It’s obvious that the current rally has virtually no room to run.

    In other words, this rally should be very short-lived.  I wouldn’t be surprised to see a shooting star candle on the day, followed by a test of the trend line connecting the recent lows.  If it’s broken, watch for XLF to trade sharply lower towards single digits.

    UPDATE:   1:15 PM

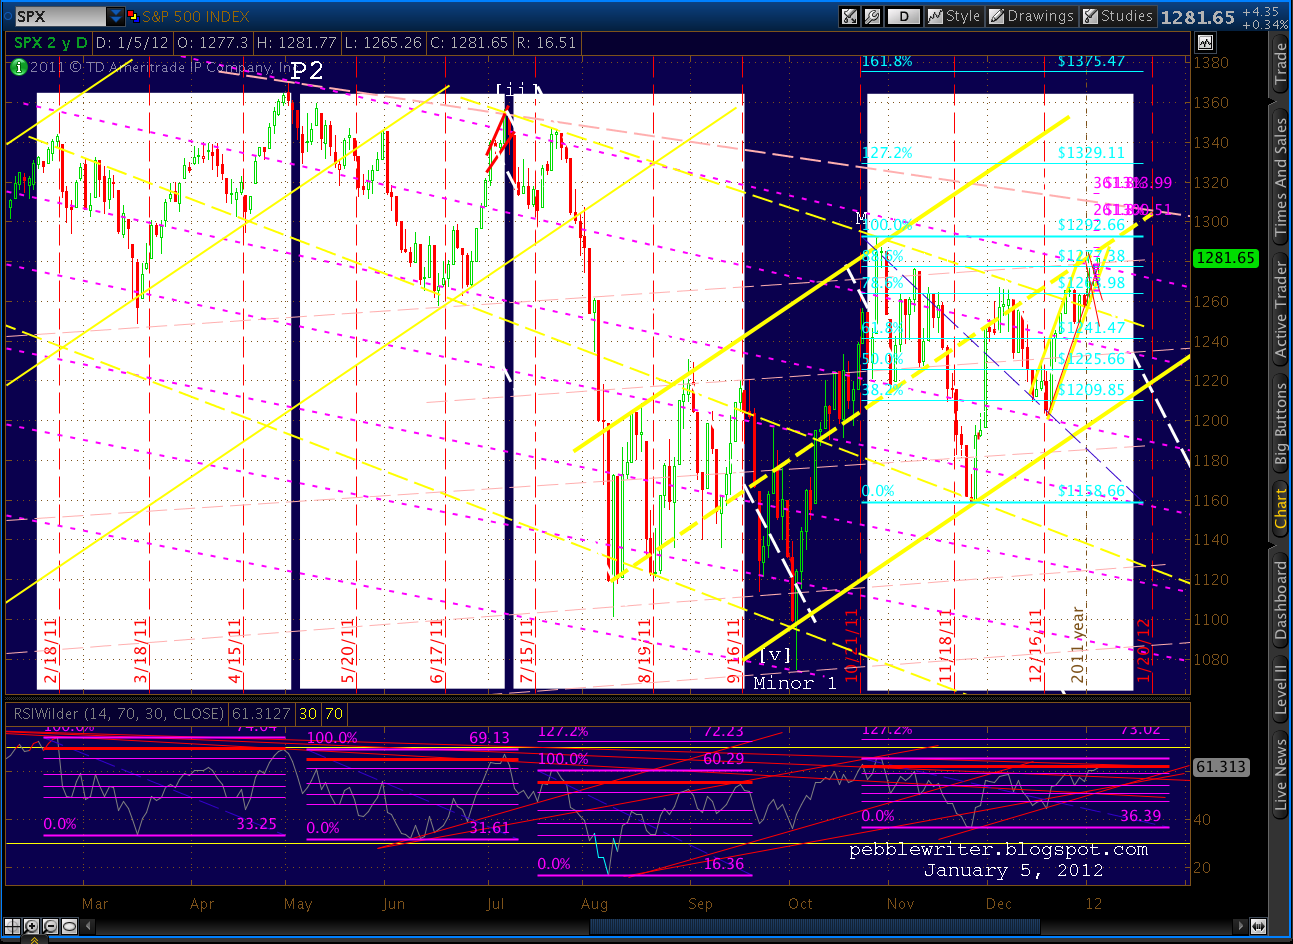
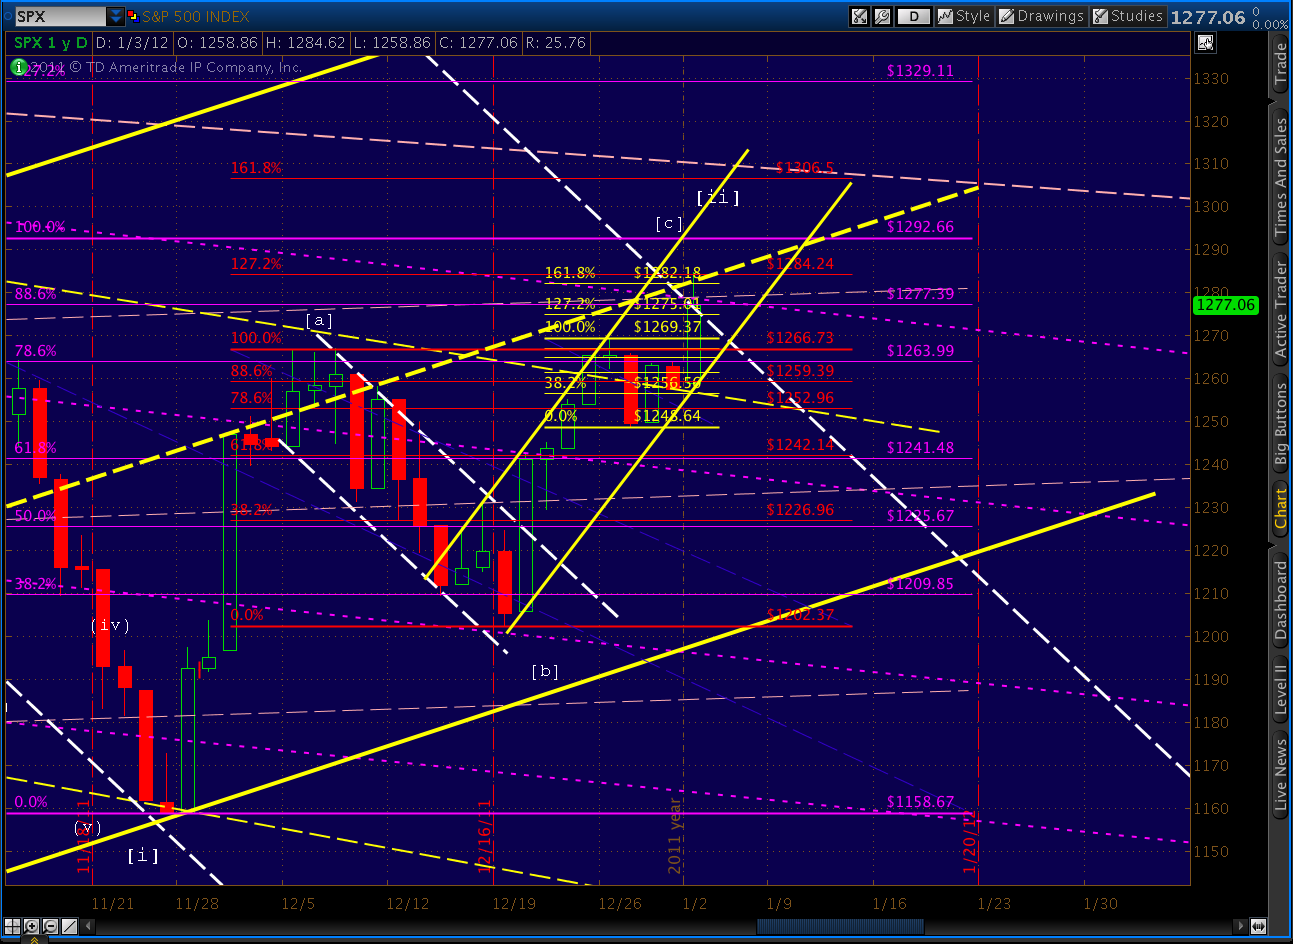
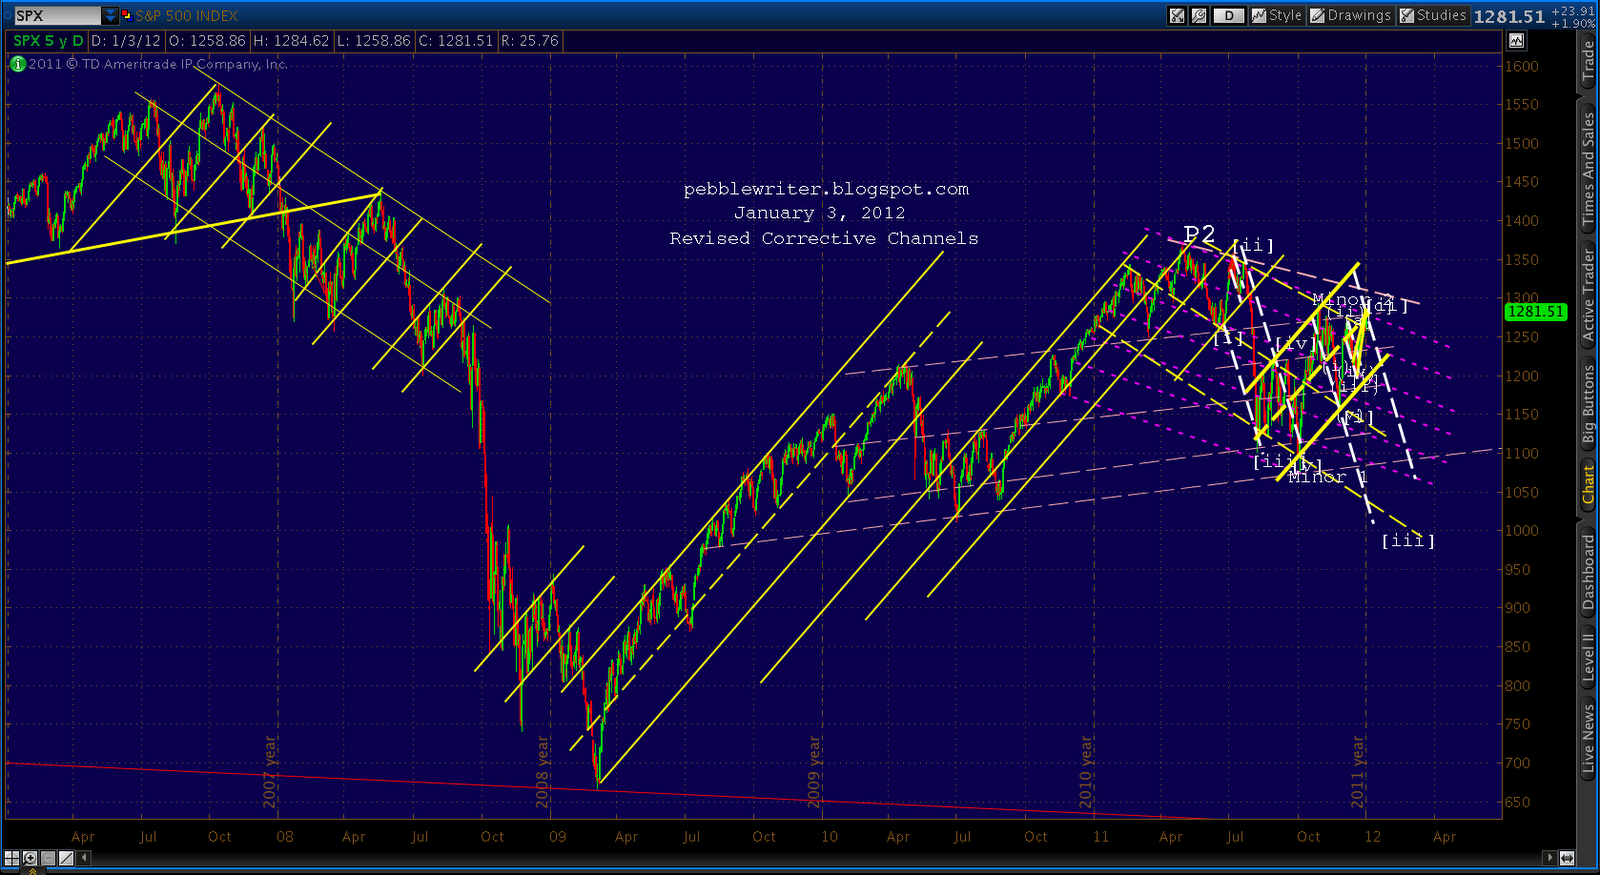
    This morning’s rise has convinced me to revisit the channel lines guiding this corrective Minor wave 2.  The chart below shows the original in red, along with the revised lines in yellow.  The dashed line is the channel midline — the point at which the SPX has currently come to rest.

    I think these channel lines do a better job of capturing the highs and lows in Wave 2, even though they result in a midline overshoot in the first few days of December.   A good test for validity of channel lines is how well parallel lines worked in the past.  In short — very well.

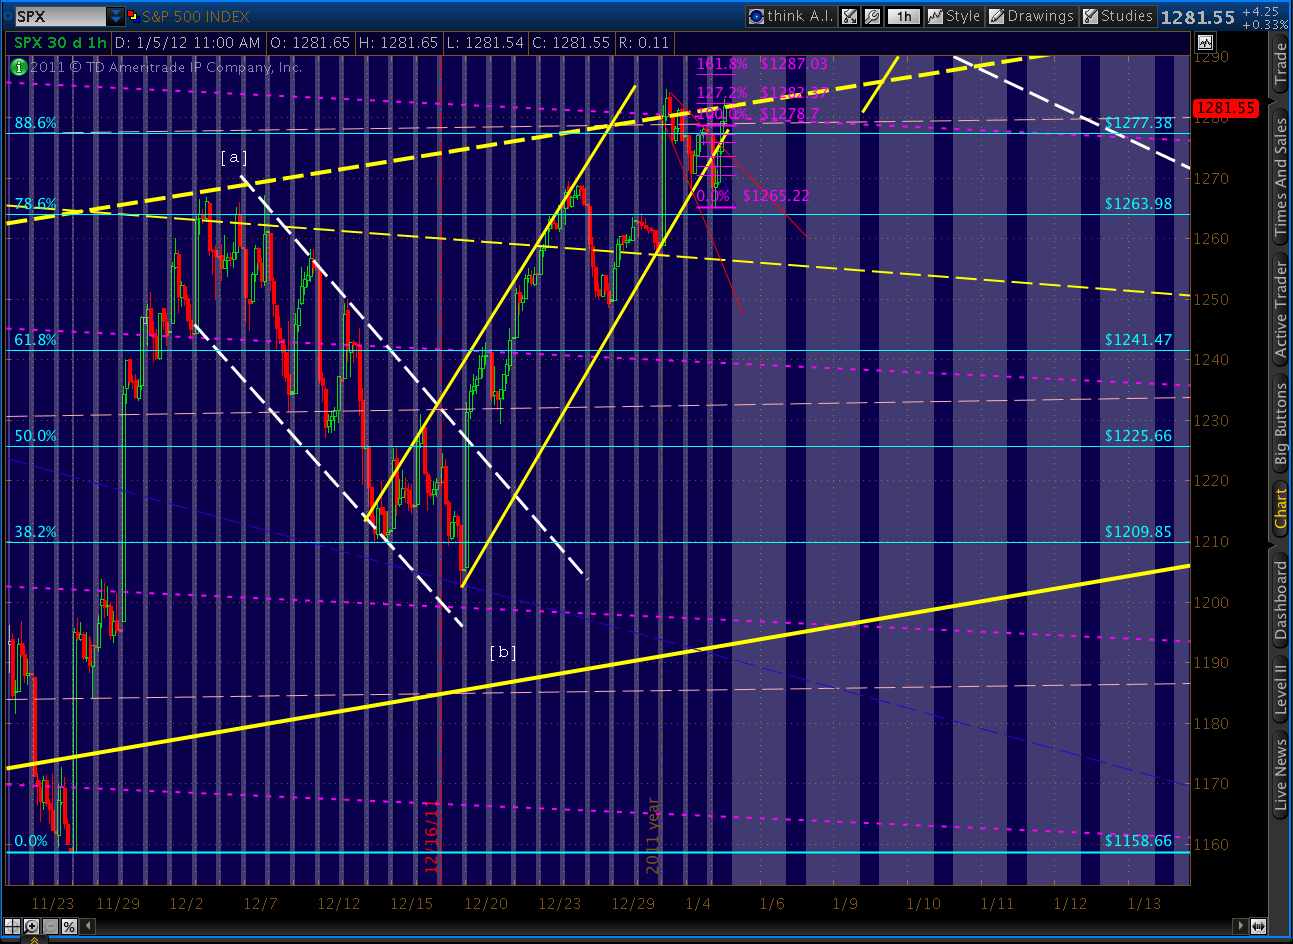
    Here’s a close-up of the new channel.  Note the 3-way intersection of the midline with both rising and falling background channels.  It won’t matter to Wave 2 anymore, but trend lines of the same slope will play a role in defining the Minor 3 bumps.

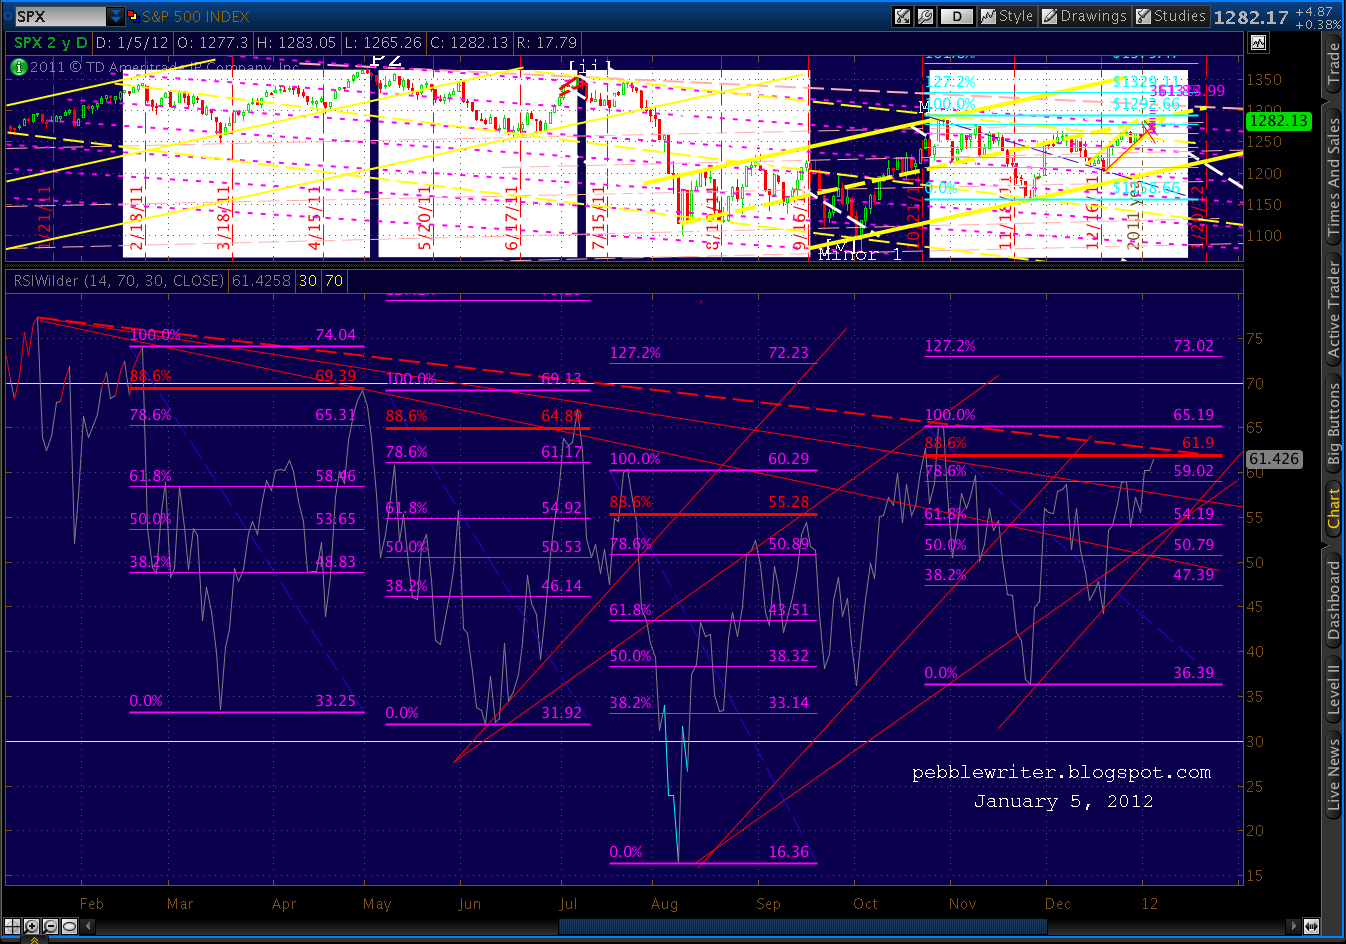
    And, the longer term view of the revised corrective channels:

    The fan lines from 2007 and 2009 (shown in log scale) do a very good job of depicting the two potential tops of Wave 2.  The red one indicates that a 1307-1330 top is a possibility, while the yellow one argues that the top is already in.  Some of you might remember the yellow line from previous posts, sometimes called the “fan line that just won’t quit.”

    UPDATE:  9:35 AM

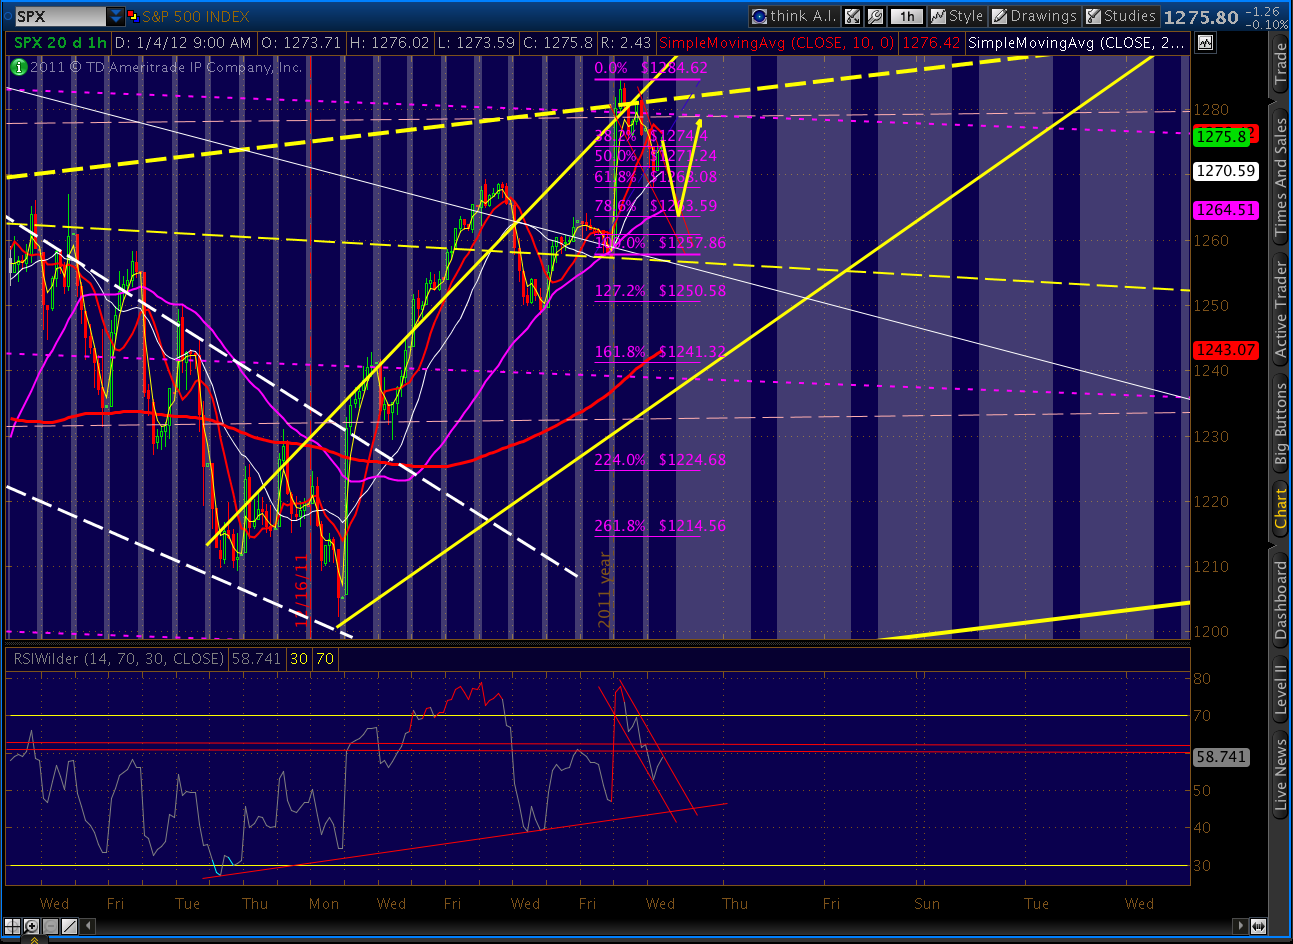
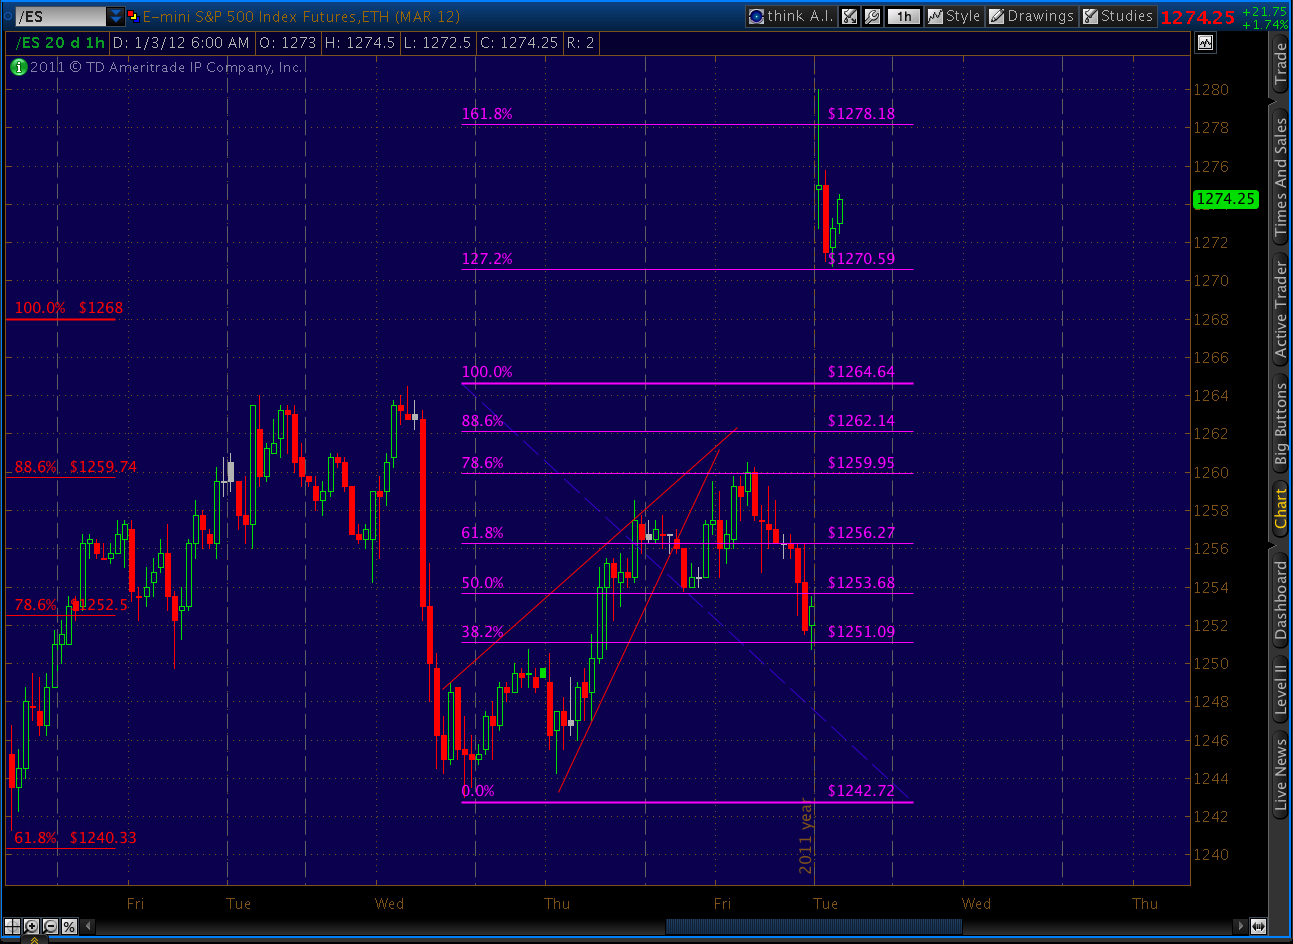
    So, the 1.618 it is.  And, there’s the negative divergence on the 60-min chart, right on schedule.  And, the dollar is way oversold.  The big question is whether we’ll reverse at 1282.18 or push higher.

    Any way you slice it, that makes for a pretty obvious 5 waves up from 1202.

    UPDATE:  9:15 AM

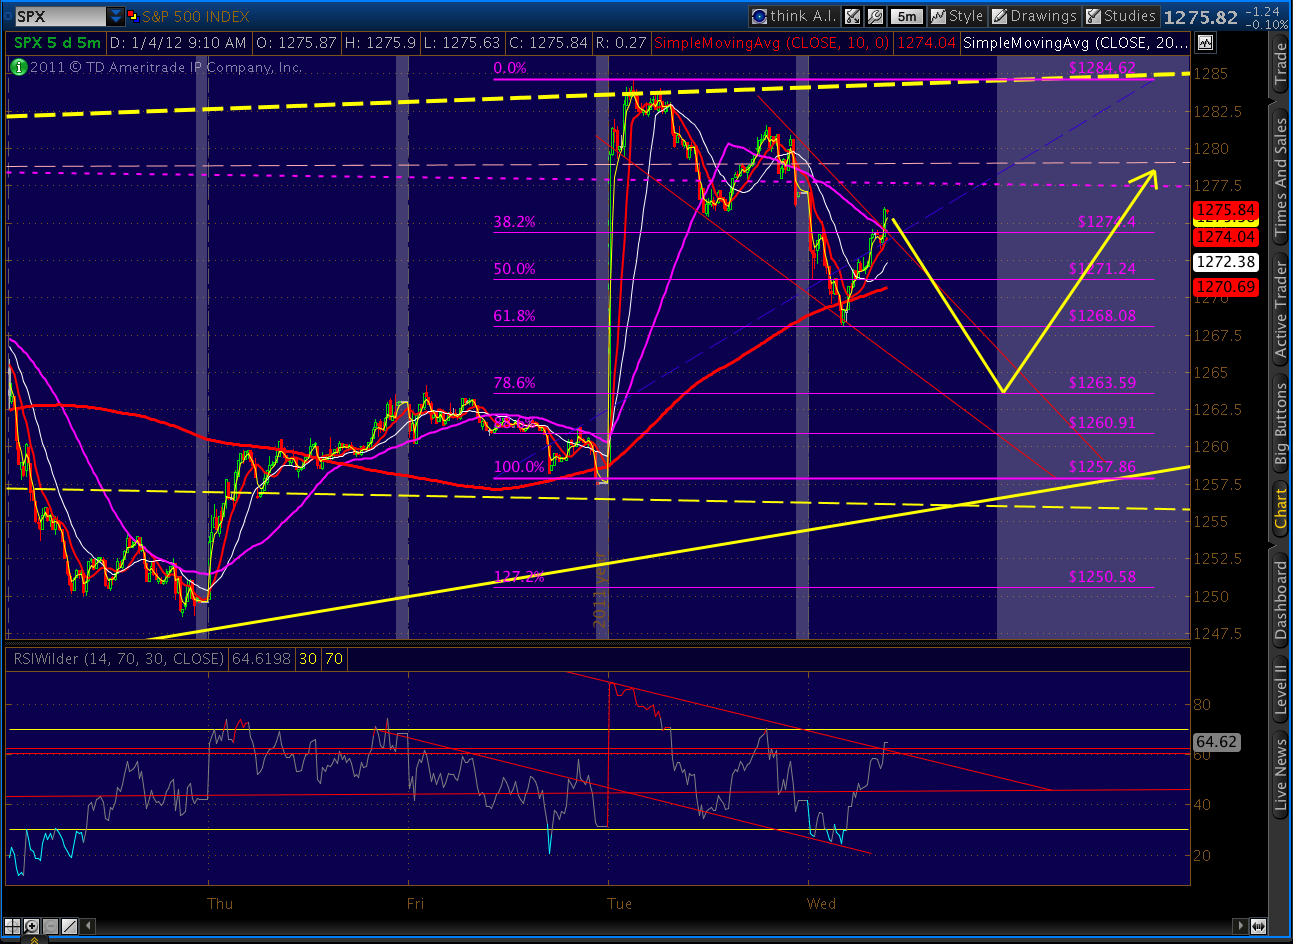
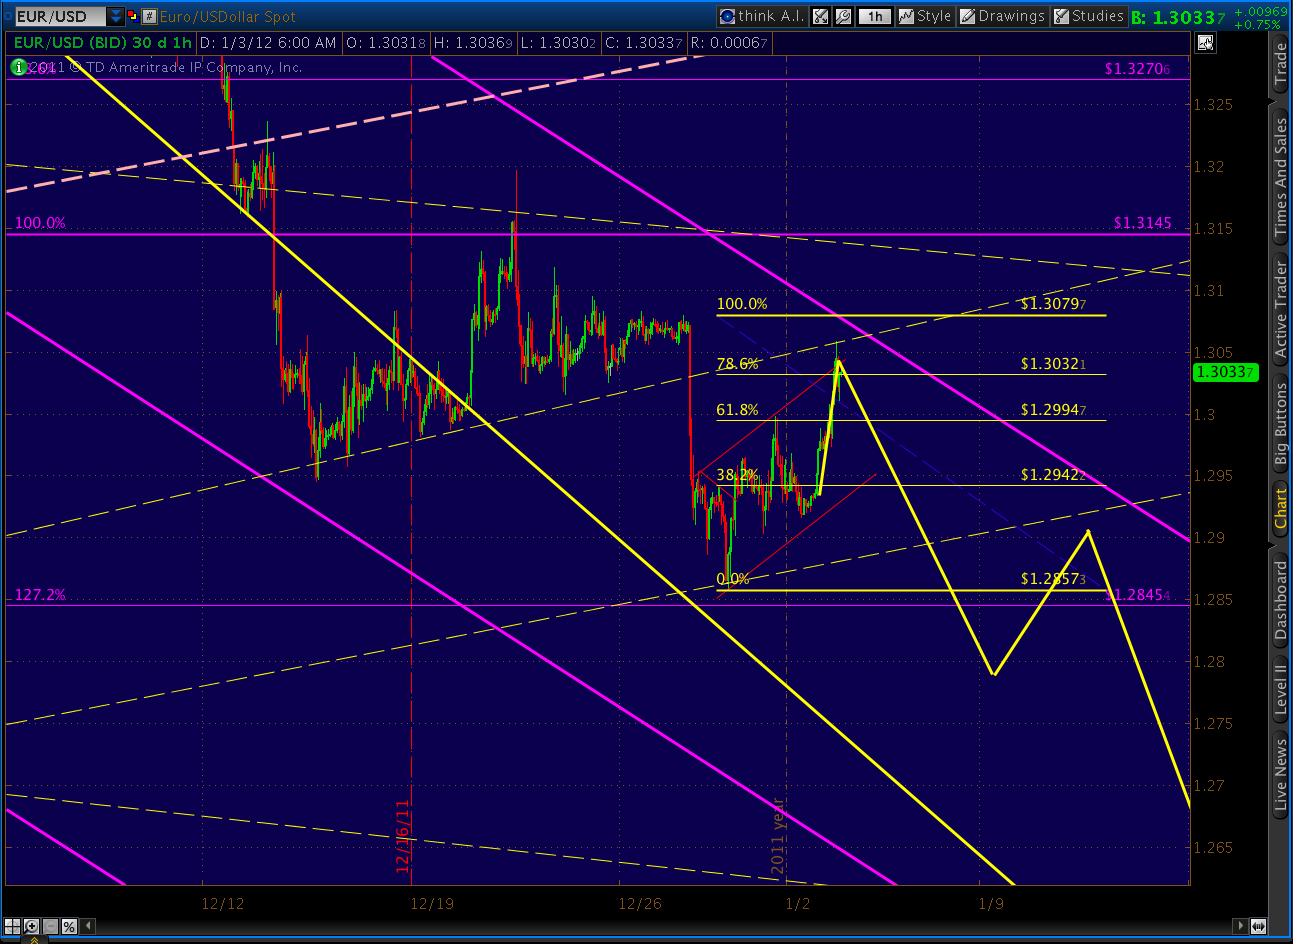
    We got slightly more of a move than I expected from the EURUSD, with a rise to the .886 (instead of the .786) and a perfect back test of the last fan line to have been broken.

    Consequently, the eminis have reached the 1.618 extension rather than the 1.272 which is much more typical of Butterfly patterns.

    A similar move in SPX after the open would result in 1282 (the 1.618 extension) rather than 1275 (the 1.272).  It would also almost certainly produce some striking negative divergence across the board.  Can we still gap and crap before 1292 is endangered?  ISM manufacturing data will be released at 10AM. 

    ORIGINAL POST:  JAN 3, 2012 1:30 AM

    [note:  this post was originally appended to the last Fractal Update post — which was getting a little unwieldy.  I’ve left it both places so as not to confuse folks even further.]

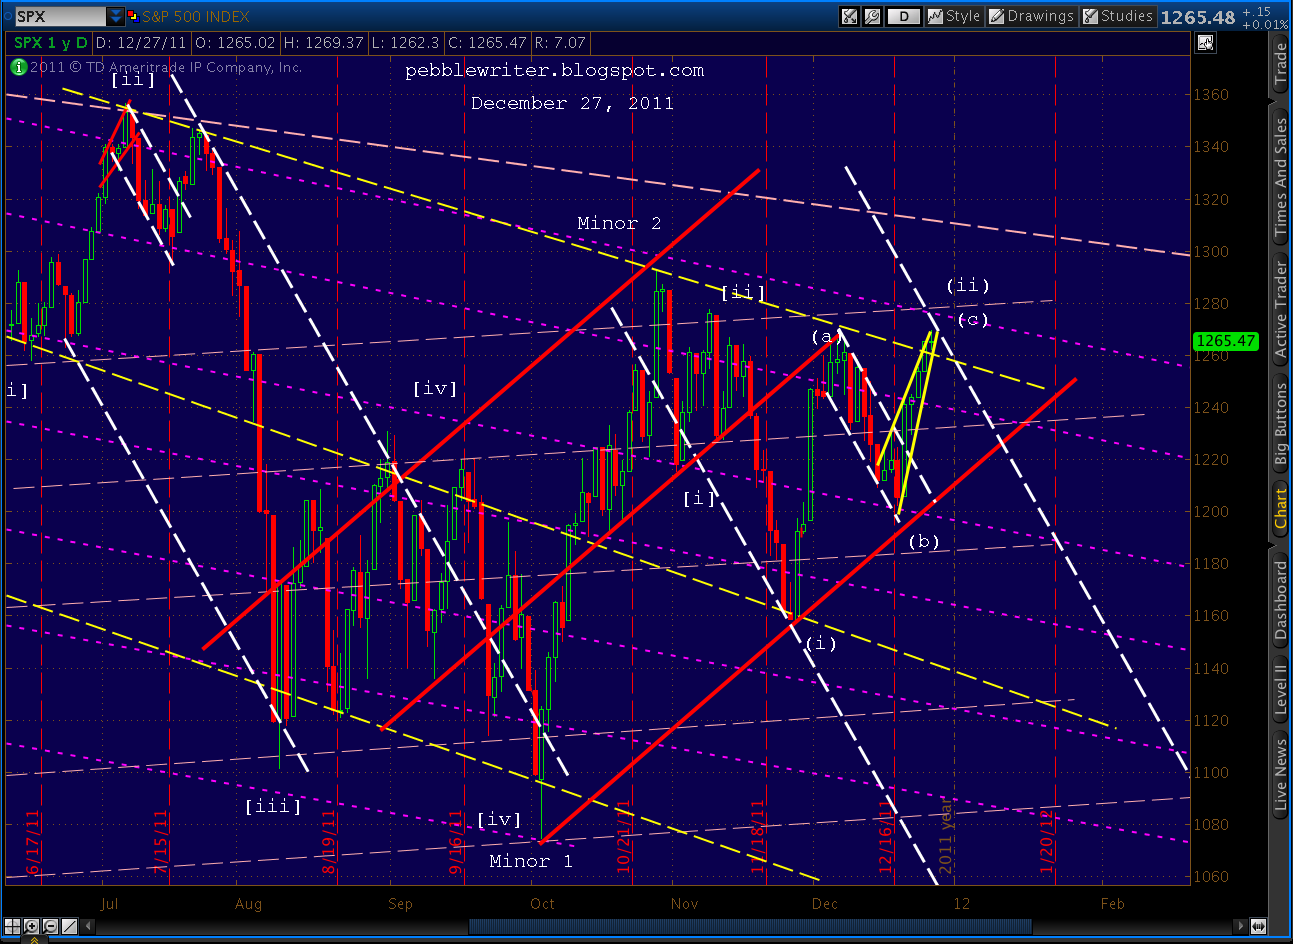
    Looks like SPX left us with a Butterfly setup last Friday.  If it plays out, it would reverse around 1275.01 — which is dangerously close to a key Elliott Wave price level (we also have a well-established downward sloping channel line there.)

    Note that the Nov 8 high was 1277.55.  Depending on how one counts the move off the 1292 top, 1275 is too close for comfort to that previous high.   It’s also just a few cents off the .886 retracement of the 1292 to 1158 move.

    Here’s how the EW count appeared to me last week.  I wrote that we were about to commence Minuette (iii) of Minute [iii] of Minor 3 of Intermediate 1 of Primary 3. 

    If we break 1277 (but not 1292) it means the move from 1292 to 1158 was Minute [i] of Minor 3 , with the three wave retracement to 1277+ being Minute [ii].  This actually makes more sense, as Minute [i] in Minor 1 was 112 points.  It’s likely that the same degree move in Minor 3 would be as large or larger.

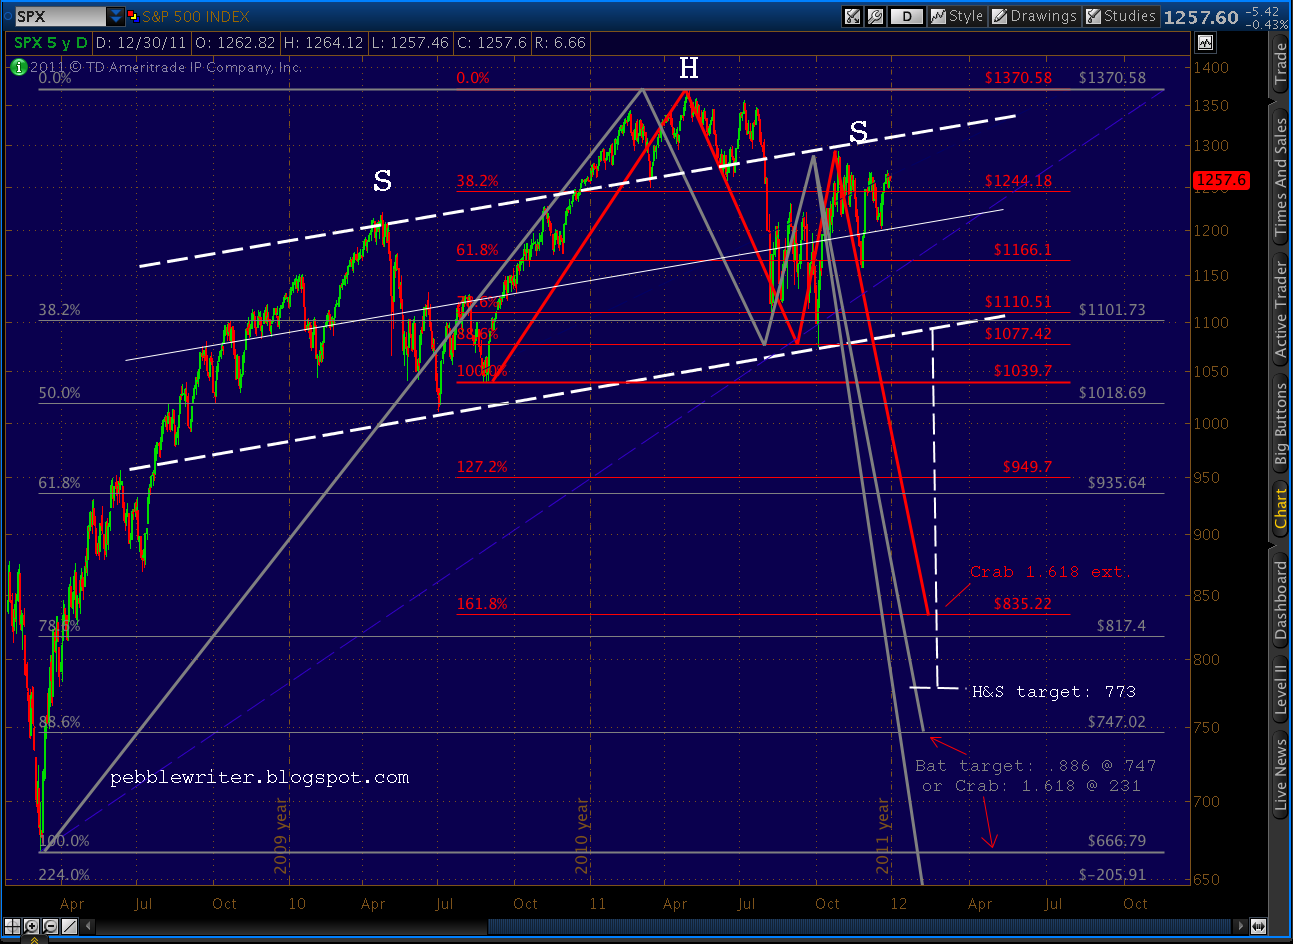
    If we exceed 1292, then we’re likely tracing out the final 5 waves of C of Minor 2 which, as readers will recall, takes prices up to the 1307-1320 area.  Whichever way it breaks, we’re either in Minor 3 (my top preference) or about to enter it.  It should be significantly uglier than Minor 1, which took the S&P; 500 down nearly 300 points (22%) in five months.  A 22% decline from Friday’s close would take SPX down to my short-term target of 983.

    European stocks had a big up day, today, with the DAX up 3% and the CAC up 2%, both on light volume.  The DAX was boosted by a marginally better PMI reading which still indicates contraction rather than growth — particularly in the area of new orders.

    The following are notes on the Euro from The Big Picture, posted earlier today:

        Last, just a quick observation on the Euro.  Note how the fast lane we talked about last week is marked by a series of decisive breaks of parallel trend lines.  A reminder, this channel is exactly the same slope as the past three two, so I’m inclined to give it the benefit of the doubt.

    These are worth watching, as lately they are highly correlated with breaks in the US equity markets.  EURUSD seems to have established a new on on the 29th at 1.2857.  It has since rebounded somewhat, and could be tracing out a Gartley whose .786 Fib is at 1.3032 — right up against the channel boundary.

    Whether it rebounds higher or not, a break of the dashed trend line is a great indicator of a bigger downdraft to come.  In the end, I expect EURUSD to fall faster than its sub-channel, crossing into the next one down at an accelerated rate as occurred in the last wave down in September.

    The ideal spot would be tomorrow, Jan 3, as that’s the peak of channel as it intersects with the trend line just broken.  A full back test to the above-mentioned .786 Fib would be the perfect fit for a robust reversal.

    I’m still expecting completion of the Crab pattern (in purple) at 1.2464 sometime around mid-January — a 3.5%+ move that would correlate with a 10%+ move in SPX.

    A couple of interesting news/opinion blurbs in the past few hours:

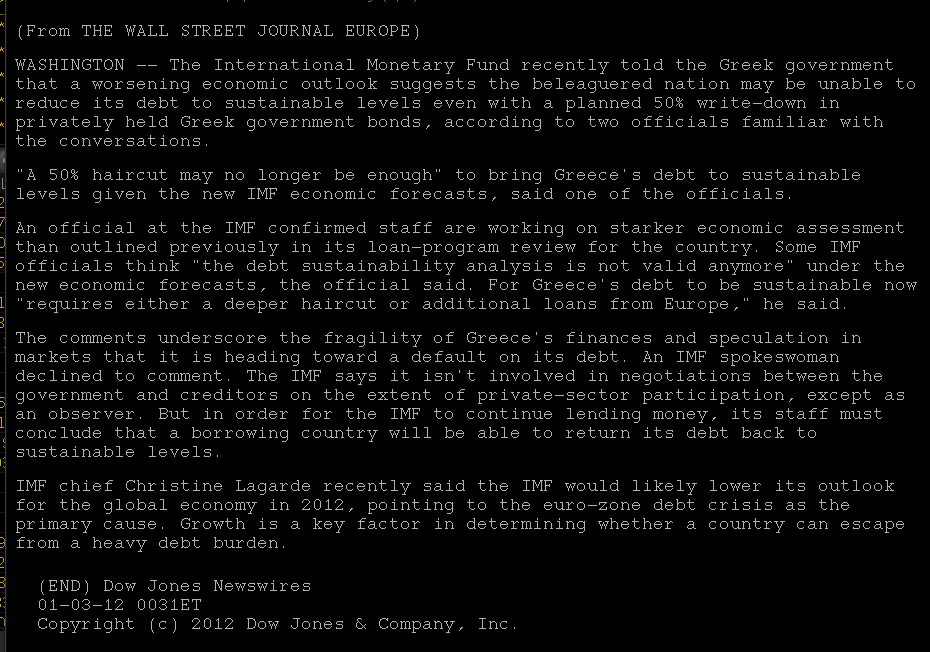
    The IMF, stating that the 50% haircut that was supposed to alleviate the Greek debt crisis is likely not sufficient.  This, combined with the Spain not-so-near miss of its economic target on Friday should give Europtimists pause.  According to Lagarde, the IMF will likely lower its global GDP outlook.  As the article points out:  “growth is a key factor in determining whether a country can escape from a heavy debt burden.”  Yes, and in an obvious corollary: “growth is practically impossible when a country is overburdened with debt.” 

    More later.

  • The Big Picture: January 2, 2012

    I want to wish everyone a happy, prosperous and peaceful New Year.   The year ahead looks to be at least as “interesting” as 2011.   With the markets closed today, I thought I’d review a few of the patterns I’m watching.

    First, an overview of the harmonic picture, starting with the biggest picture:

    On the monthly chart, we just completed a potential right shoulder to a very large Head & Shoulder pattern that started with the 2000/1 top (the left shoulder).  Consider how the pattern aligns with the largest harmonic pattern (in purple, I’ll call it a Butterfly for now.)

    The neckline, which tagged the .786 retrace in Mar 09 at 666, passes through the .886 at 565 in late 2016.  By drawing a parallel trend line across the shoulders, we can also construct a midline — currently around 1031.

    I find this level interesting, because it’s reasonably close to the .500 Fibonacci level (1006) of the Butterfly pattern as well as the .500 Fib (1018) of a somewhat smaller Bat or Crab (in red) that began at the 666 level.  Also, note that reaching the 1006-1018 price level will complete a smaller H&S; pattern that features 1370 as the head and targets 773.  As we’ll see below, the smaller H&S; target is a stone’s throw from a Bat pattern target of 747.

    The channel that’s formed by this H&S; pattern is aesthetically pleasing, but obviously portends a dismal economic picture  — a double-dip recession (for optimists) or potential depression.   Without getting into a protracted discourse on economics, this is consistent with my outlook on the economics picture.

    Closer in, the picture is equally bearish.  Nestled within the large Bat or Crab pattern that’s been forming since 666 is a Crab pattern (in red) that began in August 2010.  It put in a Point B at the 1074 low in October, and would complete its 1.618 extension at 835 — just above the H&S; target of 773.

    Please note I’ve made no effort to put these targets in proper time perspective, but am just showing price targets for now.

    Closing in a bit more, a couple of Gartley patterns are forming.  The larger purple pattern is the better formed of the two, as the yellow pattern Point C exceeded Point A by 2 points.  This is not technically permissible, though I chart it anyway because these patterns often defy the odds and work out.

    I’ve also charted some Bat and Crab alternatives.  The key is Point B, which for a Bat must be less than a .618 retracement and for a Crab can be anywhere up to the .886 Fib level.  Note that the yellow Crab completion at 1091 also completes the H&S; pattern that targets 735, so this is a very significant target.  It also coincides with the larger (purple) pattern’s .886 Fib level at 1099. 

    Put all these targets together, and you get a boatload of significant price targets:

    1181
    1121
    1099
    1091
    1091
    940
    835
    73
    565

    By themselves, not a lot of help.  But, with these in hand, we can construct a model that attempts to align significant price levels with significant time levels by using channels and the analog I’ve been tracking since May and the fractal since November.  More later on that.

    ********

    Last, just a quick observation on the Euro.  Note how the fast lane we talked about last week is marked by a series of decisive breaks of parallel trend lines.  A reminder, this channel is exactly the same slope as the past three two, so I’m inclined to give it the benefit of the doubt.

    These are worth watching, as lately they are highly correlated with breaks in the US equity markets.  EURUSD seems to have established a new on on the 29th at 1.2857.  It has since rebounded somewhat, and could be tracing out a Gartley whose .786 Fib is at 1.3032 — right up against the channel boundary.

    Whether it rebounds higher or not, a break of the dashed trend line is a great indicator of a bigger downdraft to come.  In the end, I expect EURUSD to fall faster than its sub-channel, crossing into the next one down at an accelerated rate as occurred in the last wave down in September.

    The ideal spot would be tomorrow, Jan 3, as that’s the peak of channel as it intersects with the trend line just broken.  A full back test to the above-mentioned .786 Fib would be the perfect fit for a robust reversal.

    I’m still expecting completion of the Crab pattern (in purple) at 1.2464 sometime around mid-January — a 3.5%+ move that would correlate with a 10%+ move in SPX.