Looks like yet another day of treading water, waiting for this afternoon’s NVDA earnings and Friday’s PCE print. Futures are off modestly following seven sessions during which ES was unable to top its .886 Fib retracement.
 But, attention should also be paid to our yield curve model which is sending a strong warning to equity investors.
continued for members…
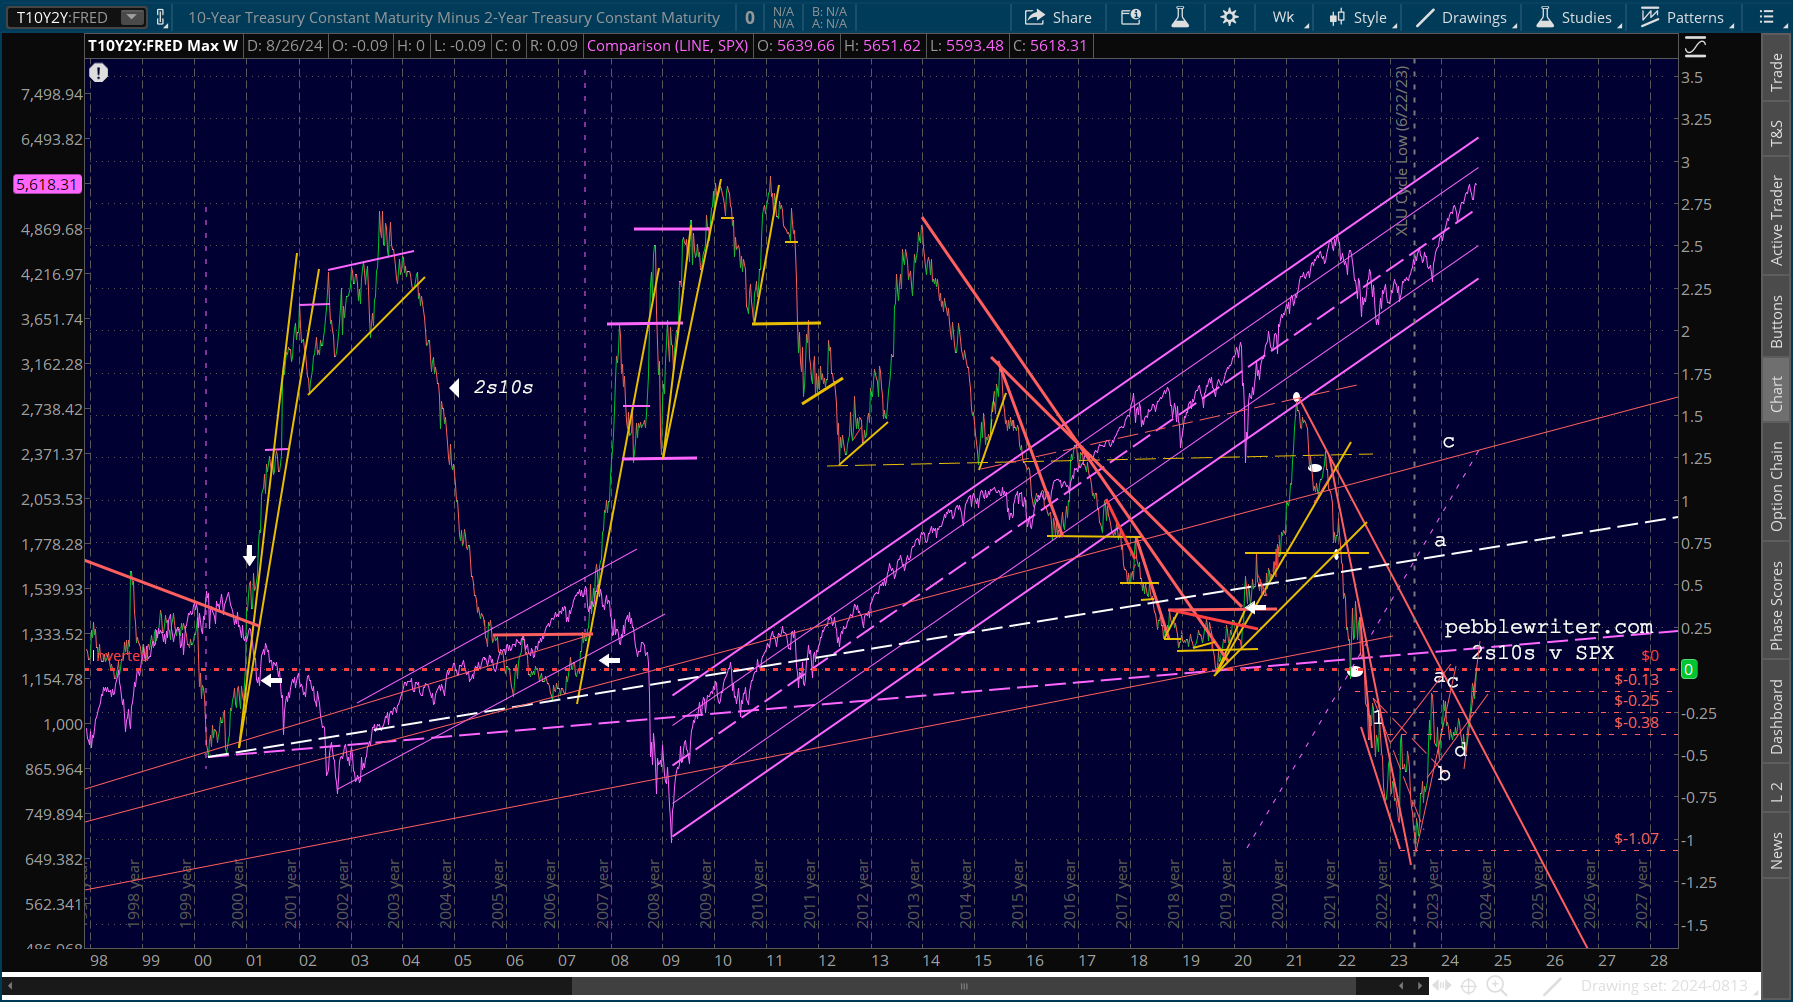
This is the first time since June 2022 that the 2s10s (at the close) was equal to 0. As the market prepares to open, the actual spread has dropped to -4 bps: the 2Y at 3.873 and the 10Y at 3.841.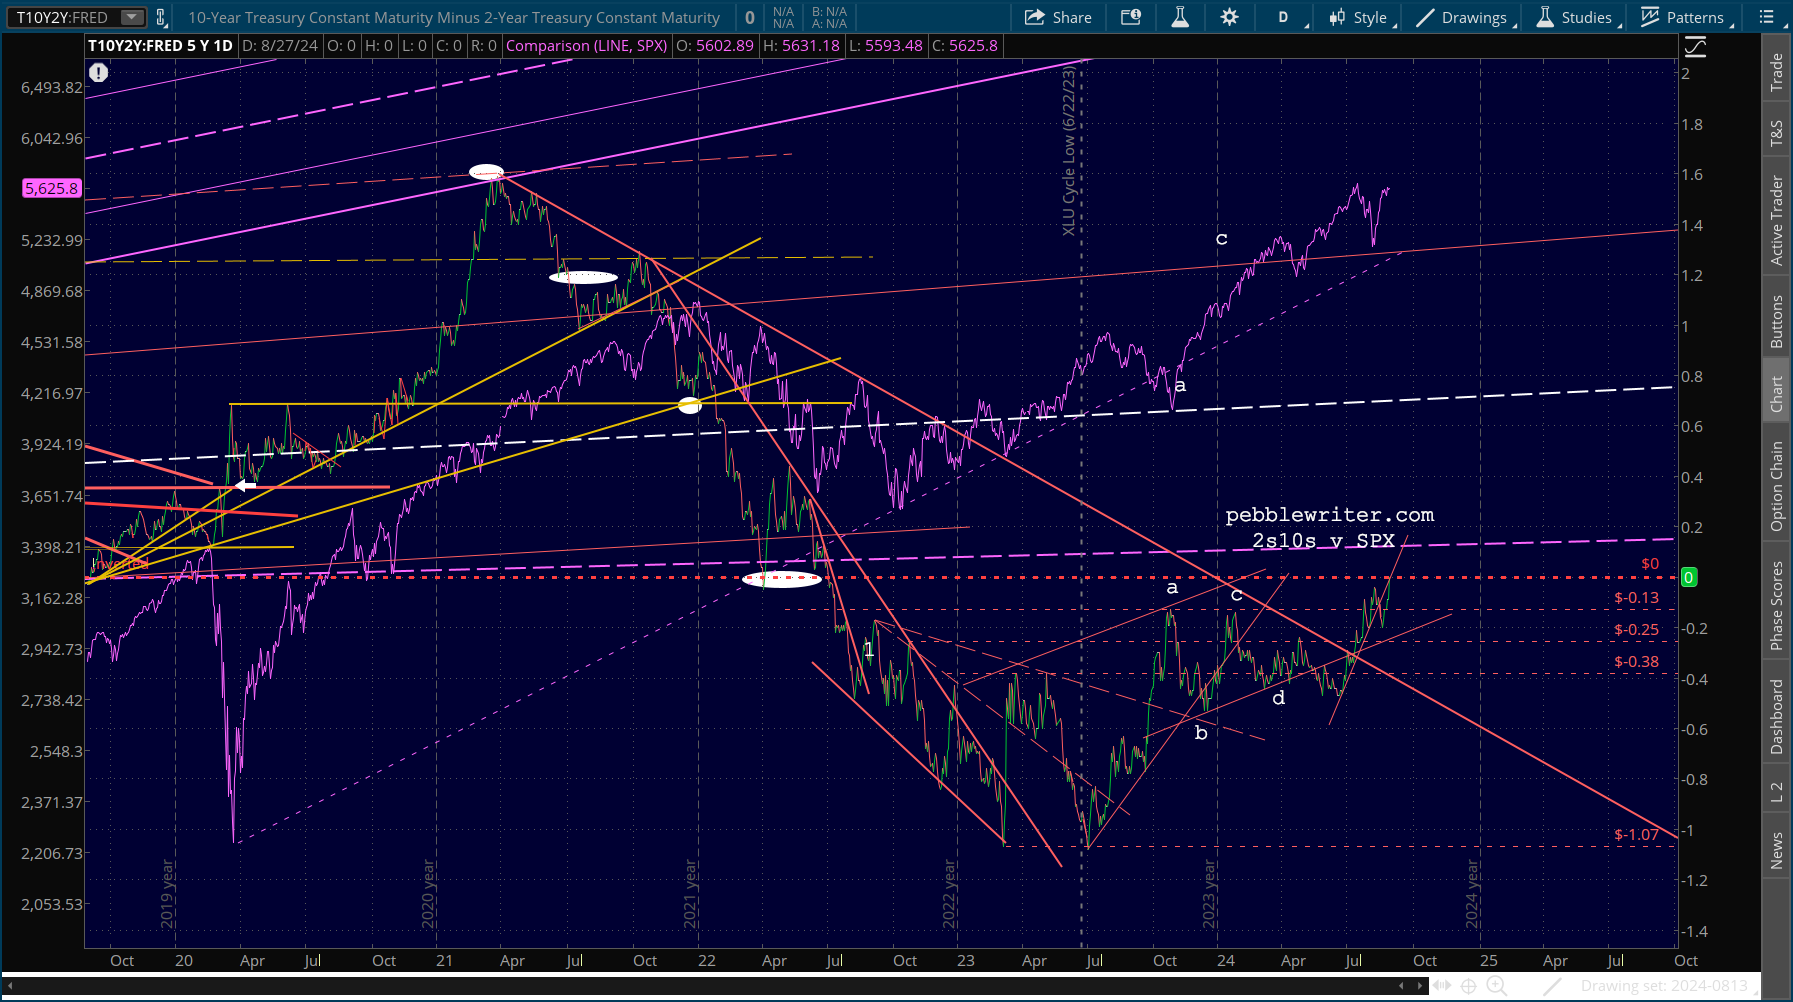 The worst declines over the years (per the model) occurred when the 2s10s broke above longstanding TLs of resistance following inversions. It has never failed in the past 35 years.
 First, a quick wrap up of our usual charts…
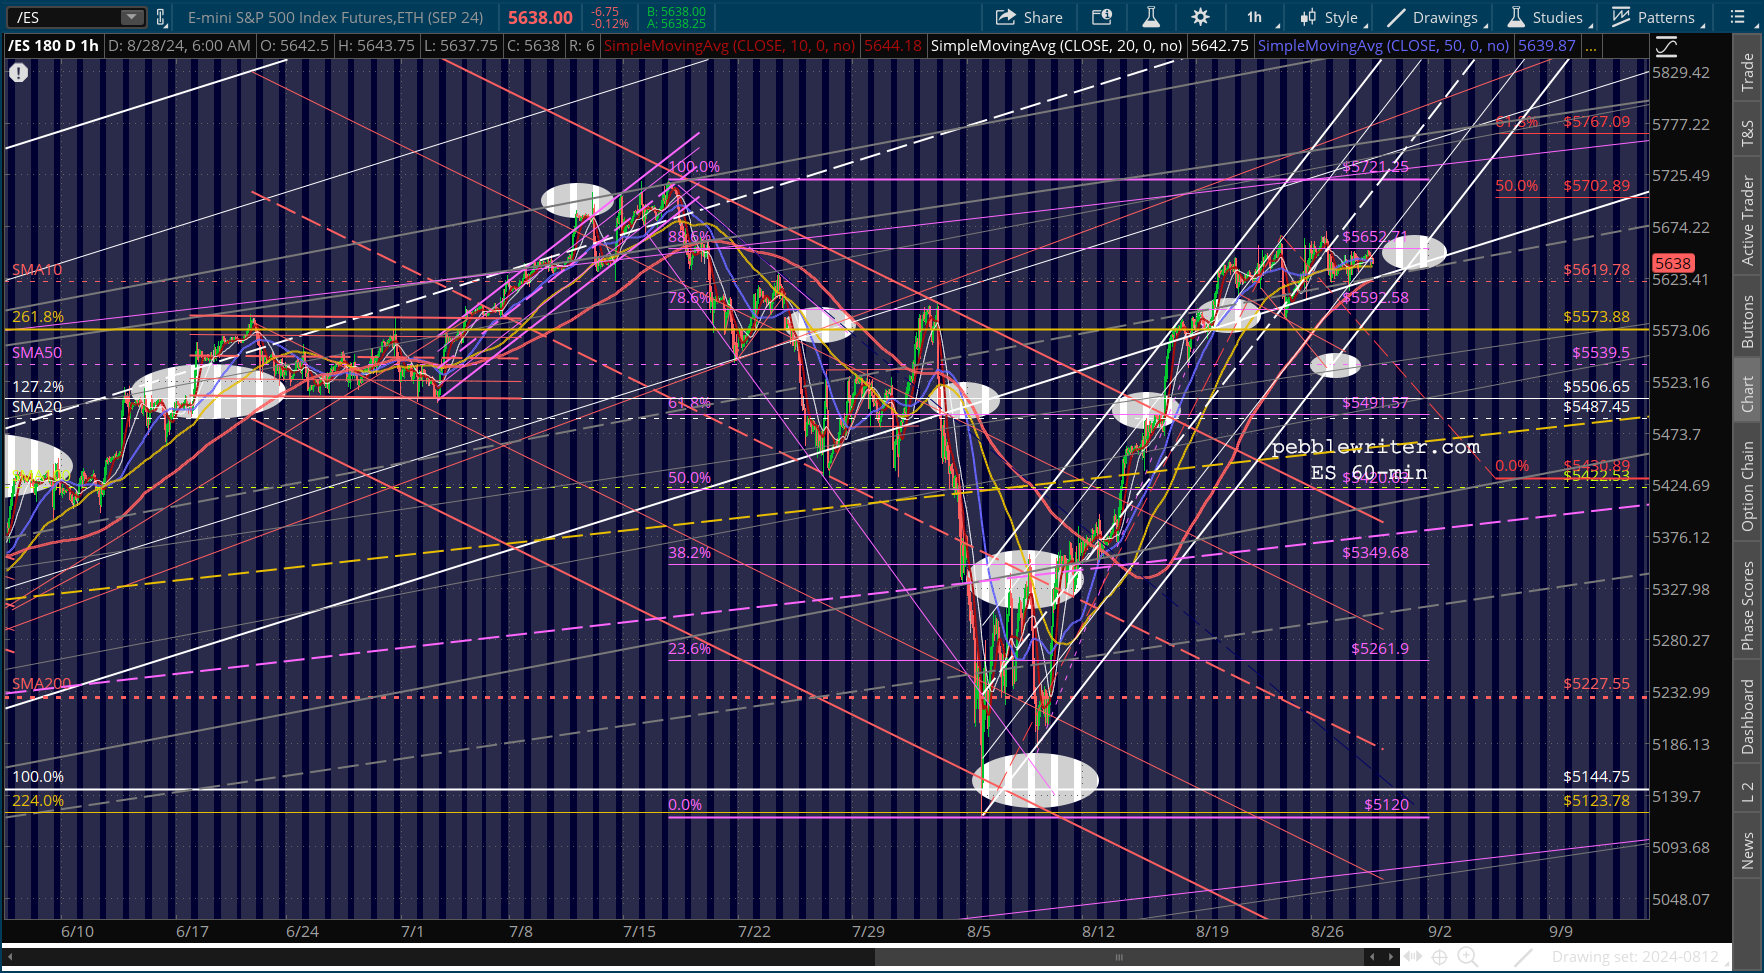
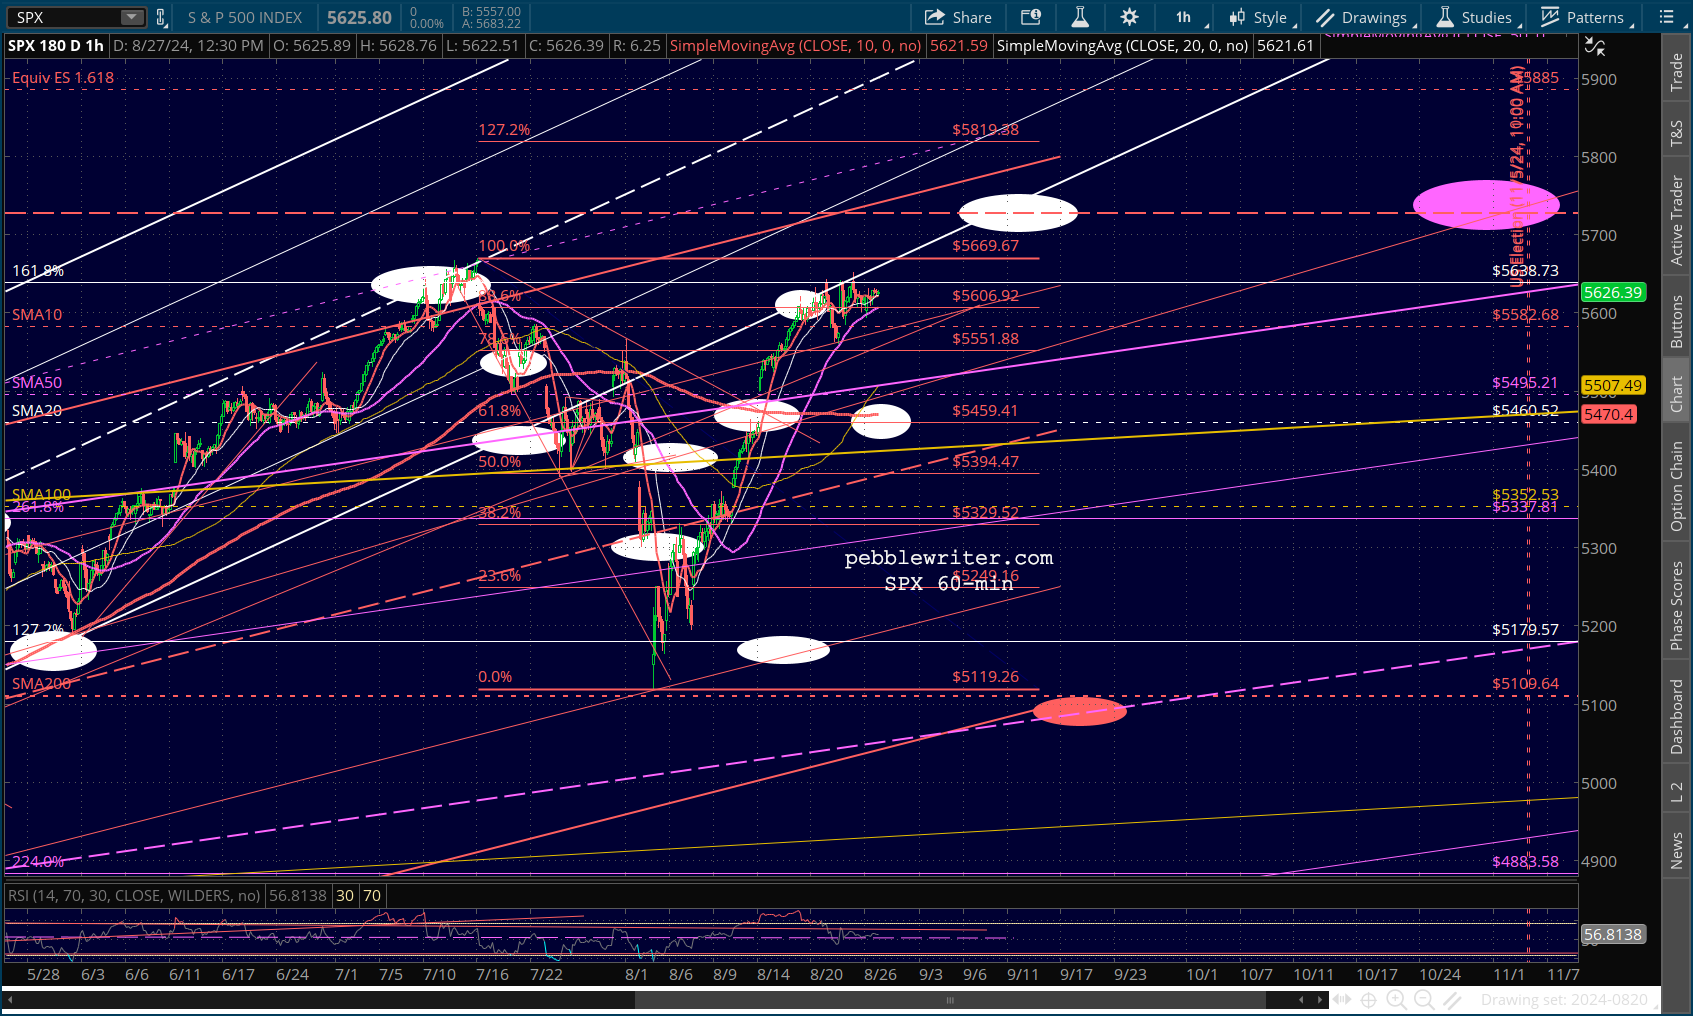
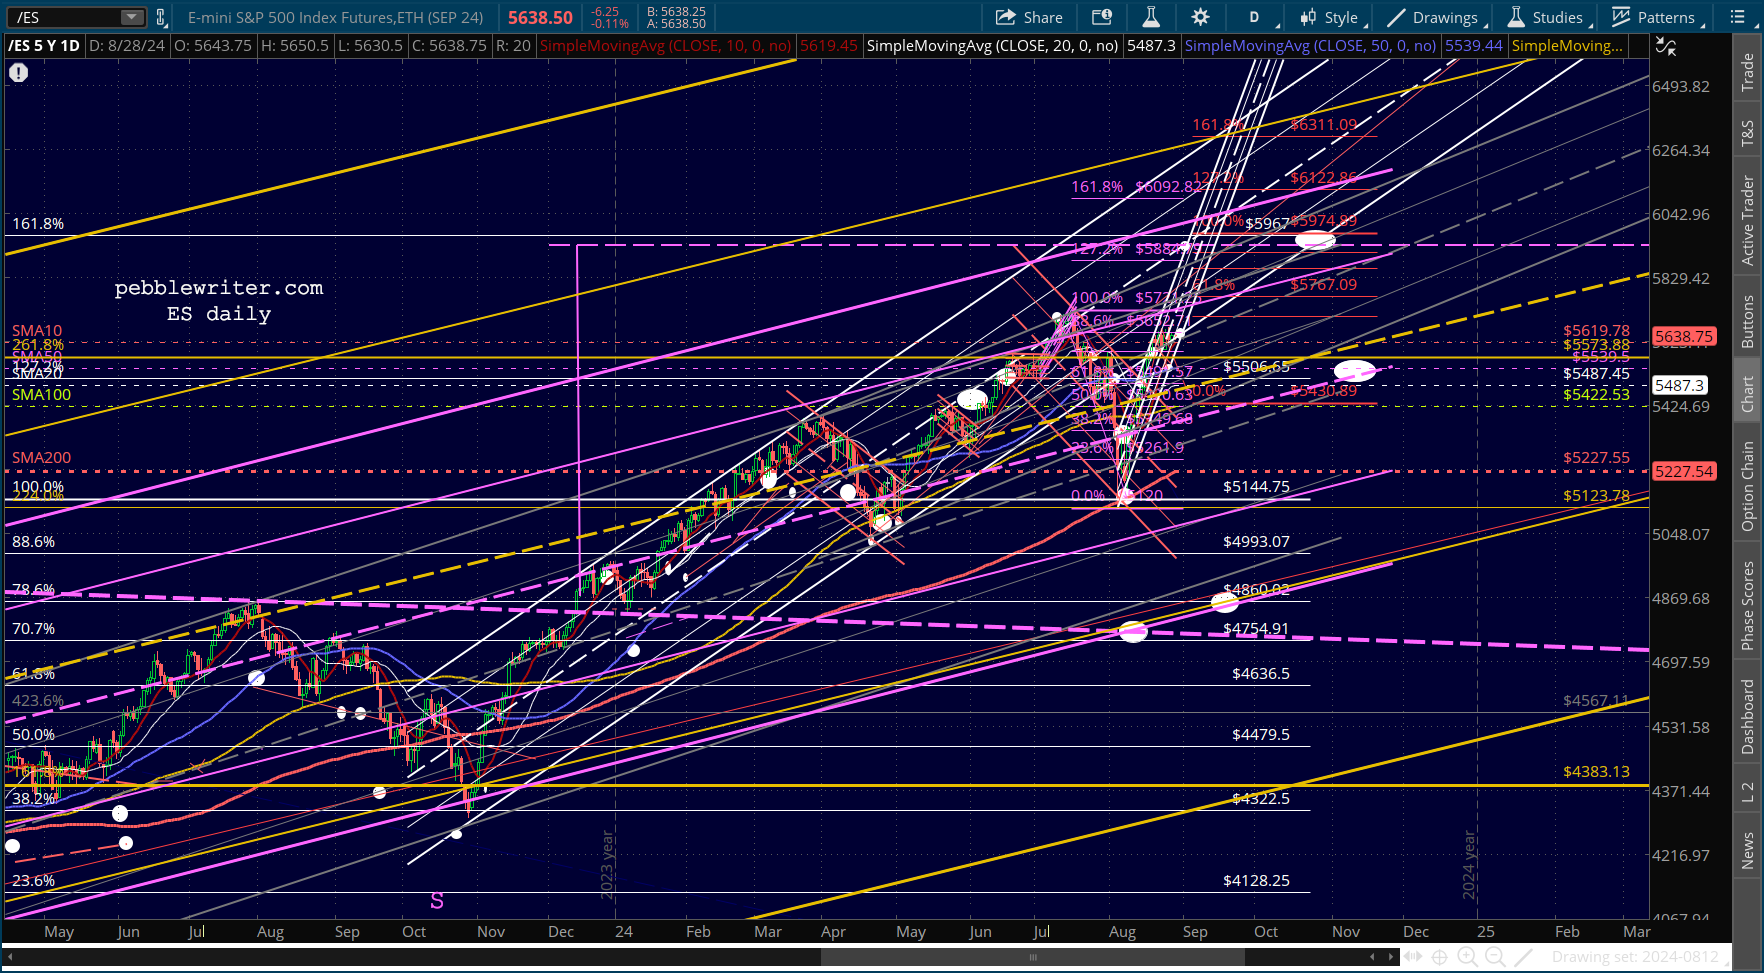 While ES has failed to remain above its .886, SPX has failed to remain below its.
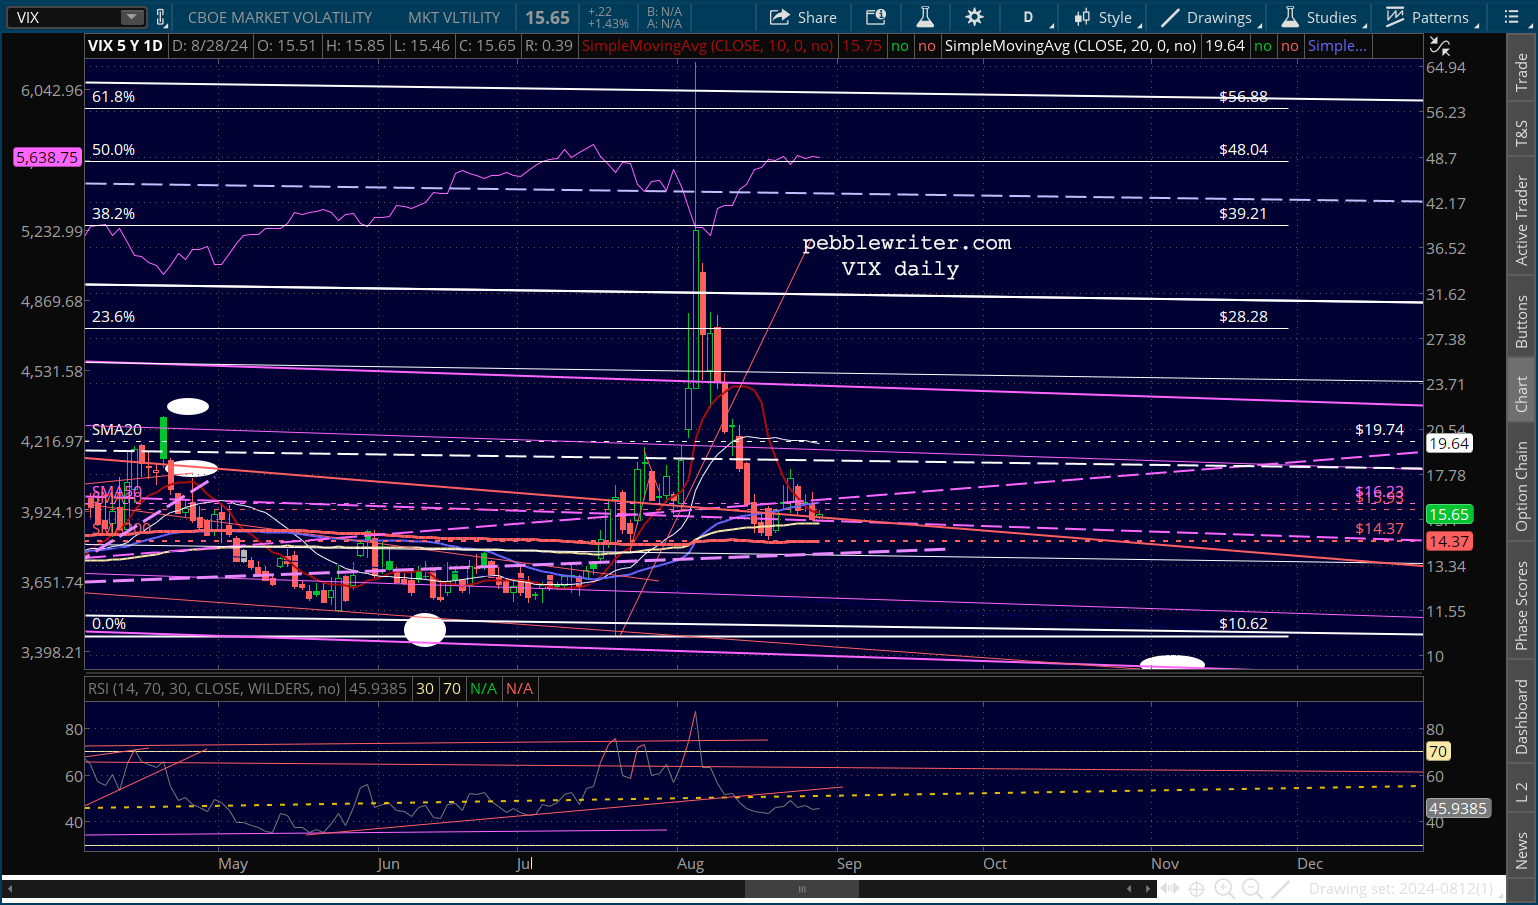 The USD still looks very oversold and poised to rally…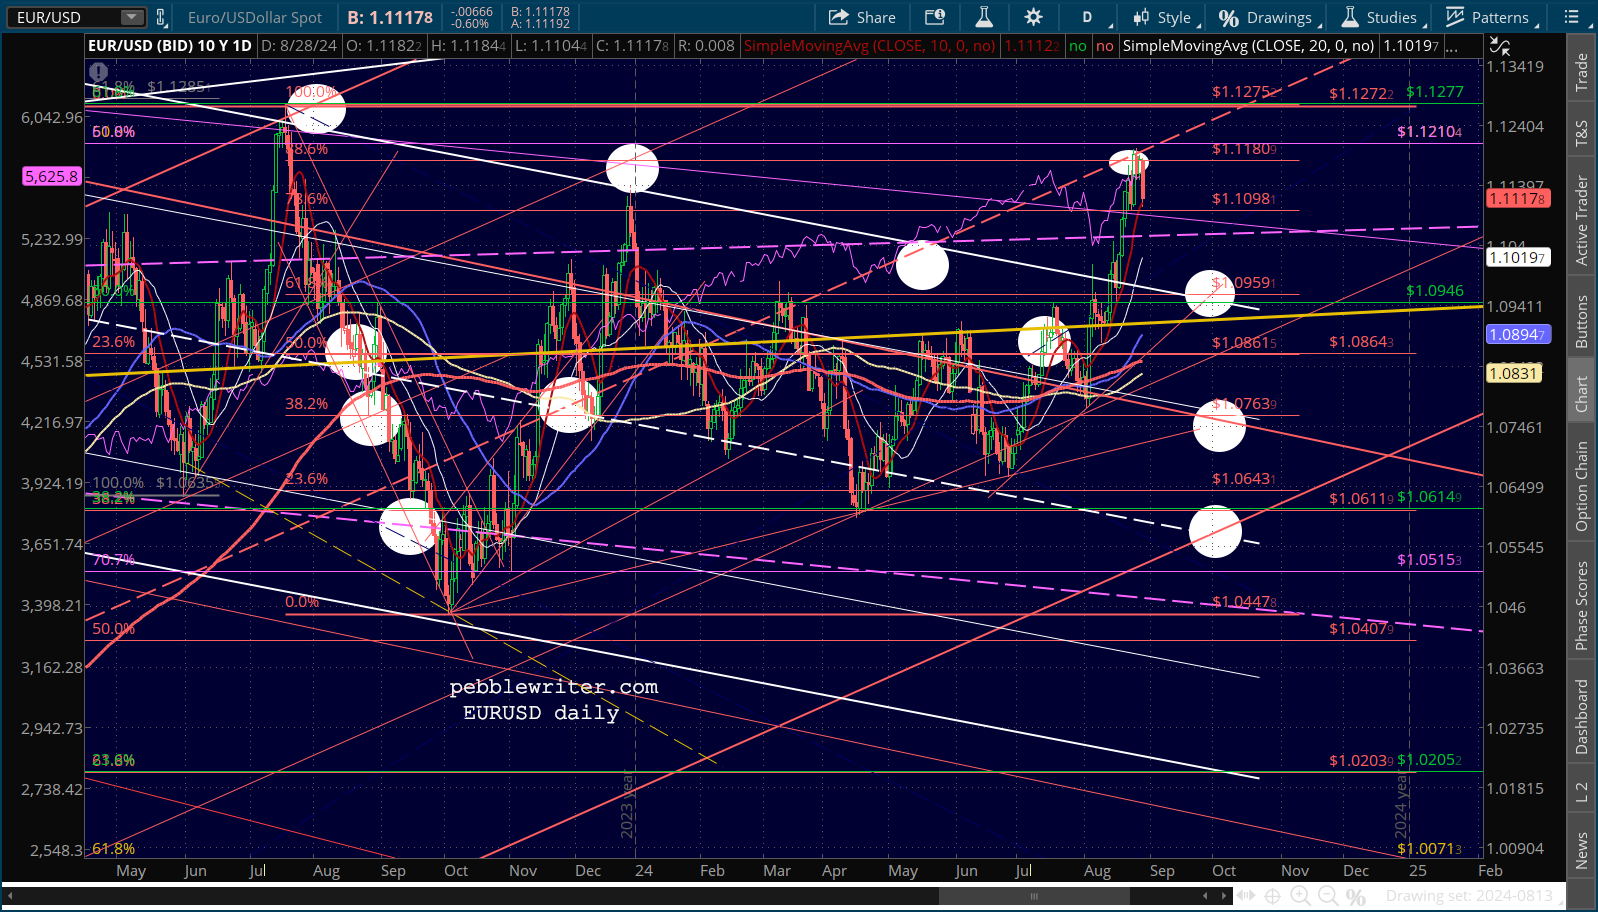
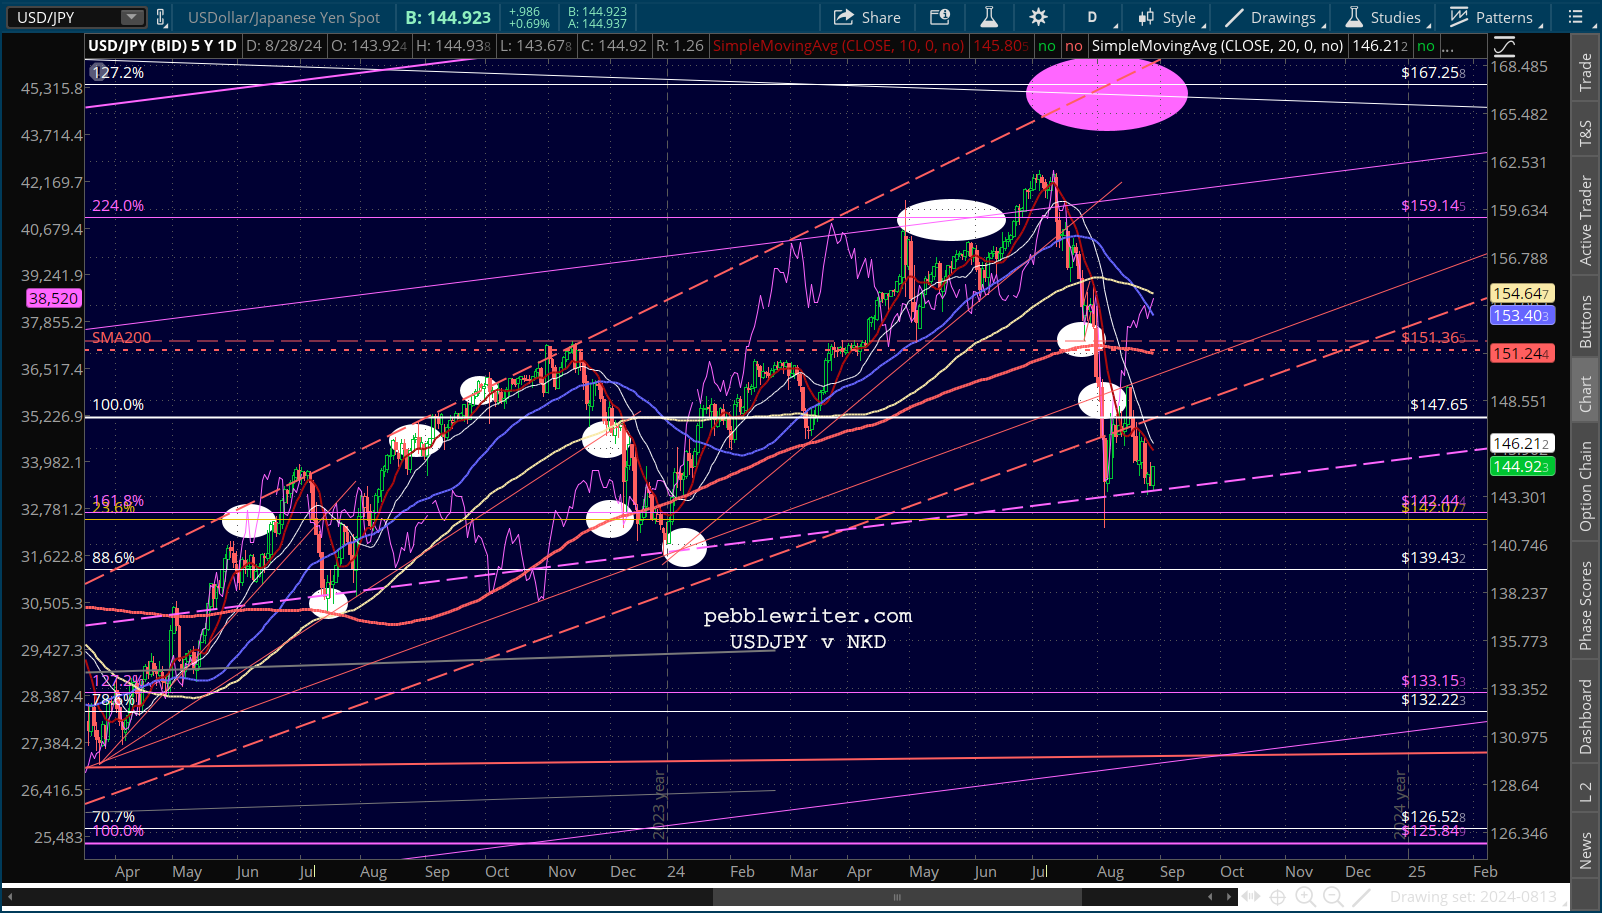
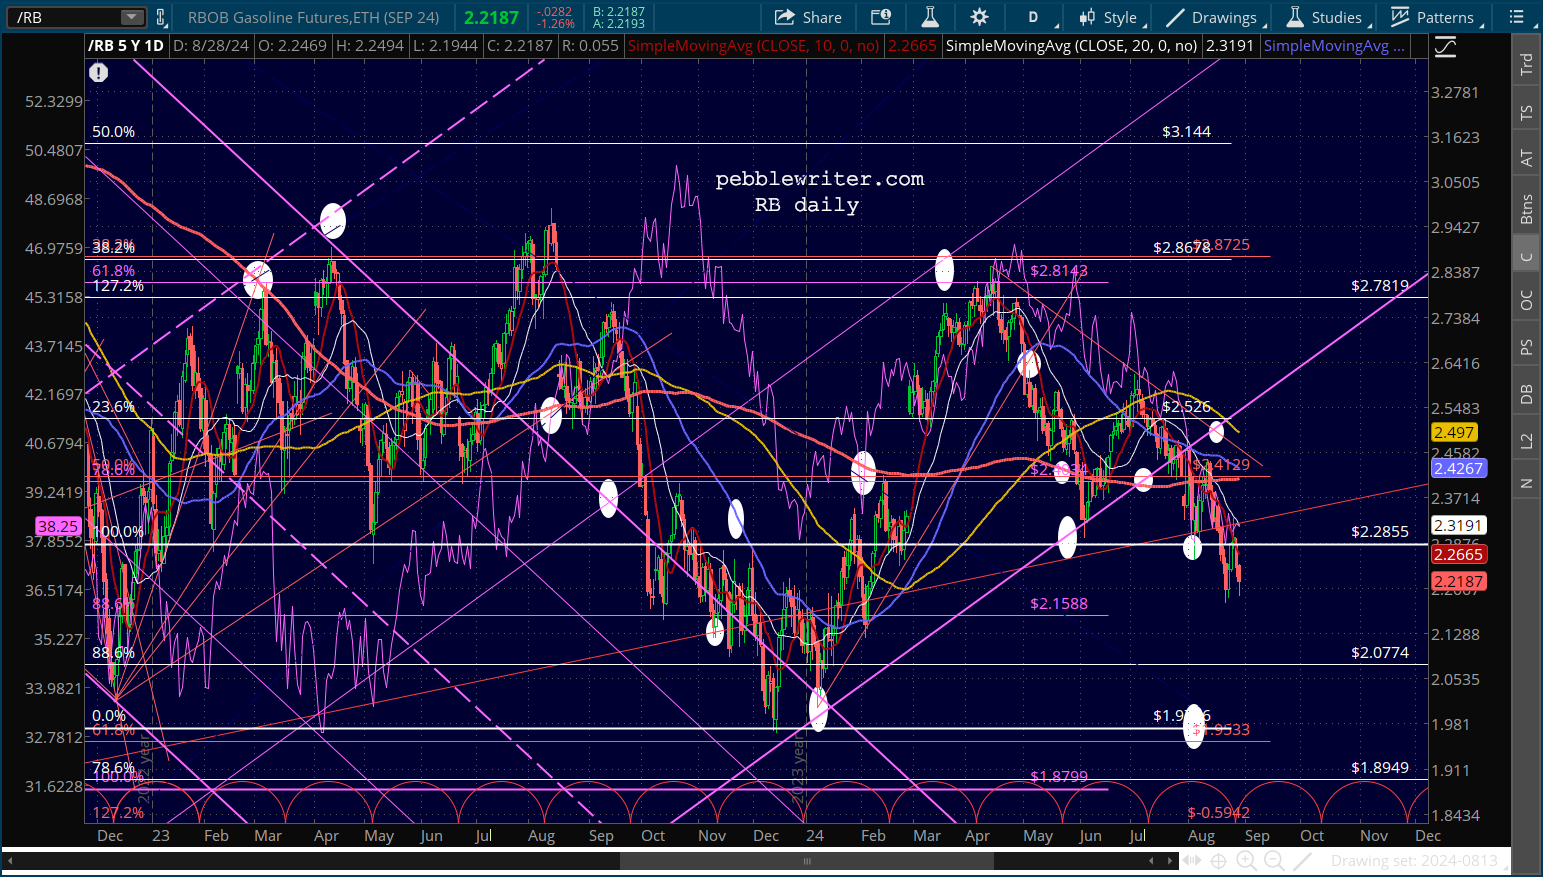
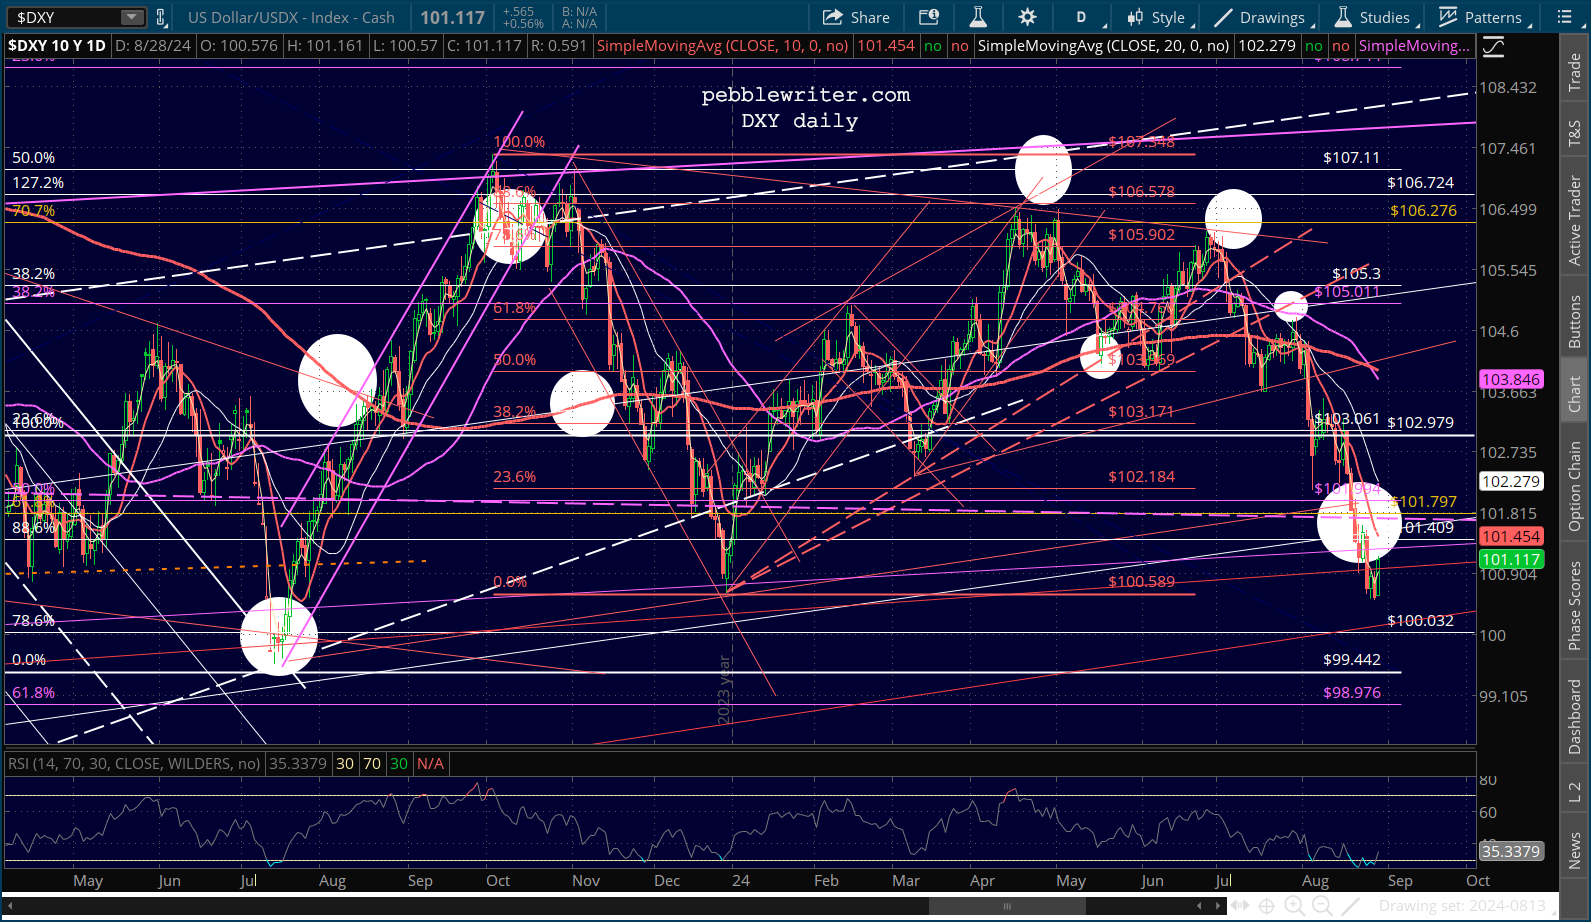 …which is essential to the lower inflation narrative, especially if oil/gas prices remain elevated due to geopolitical pressures.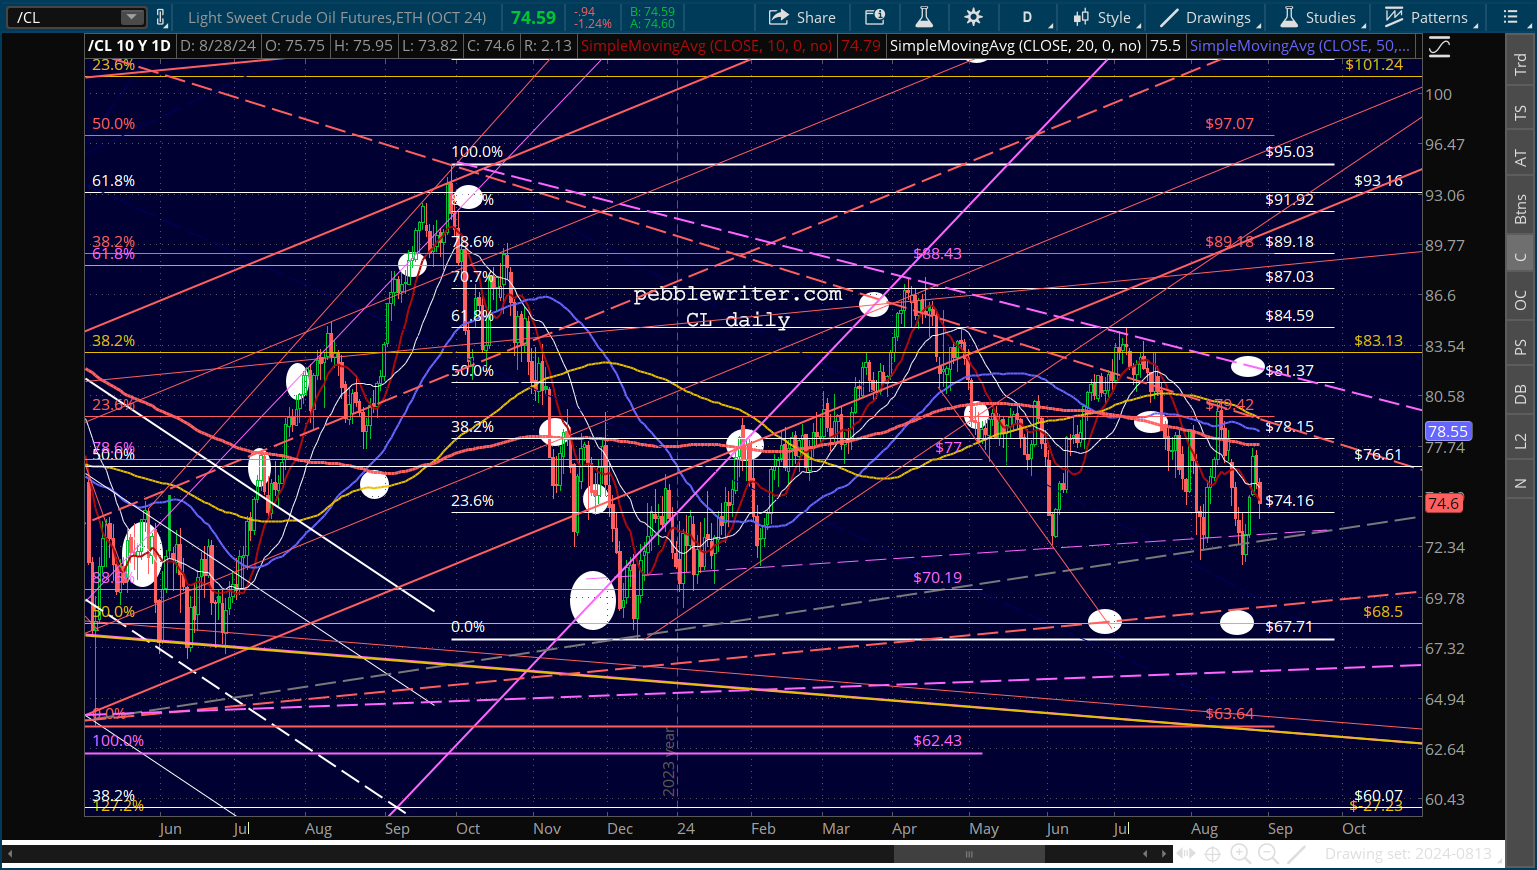
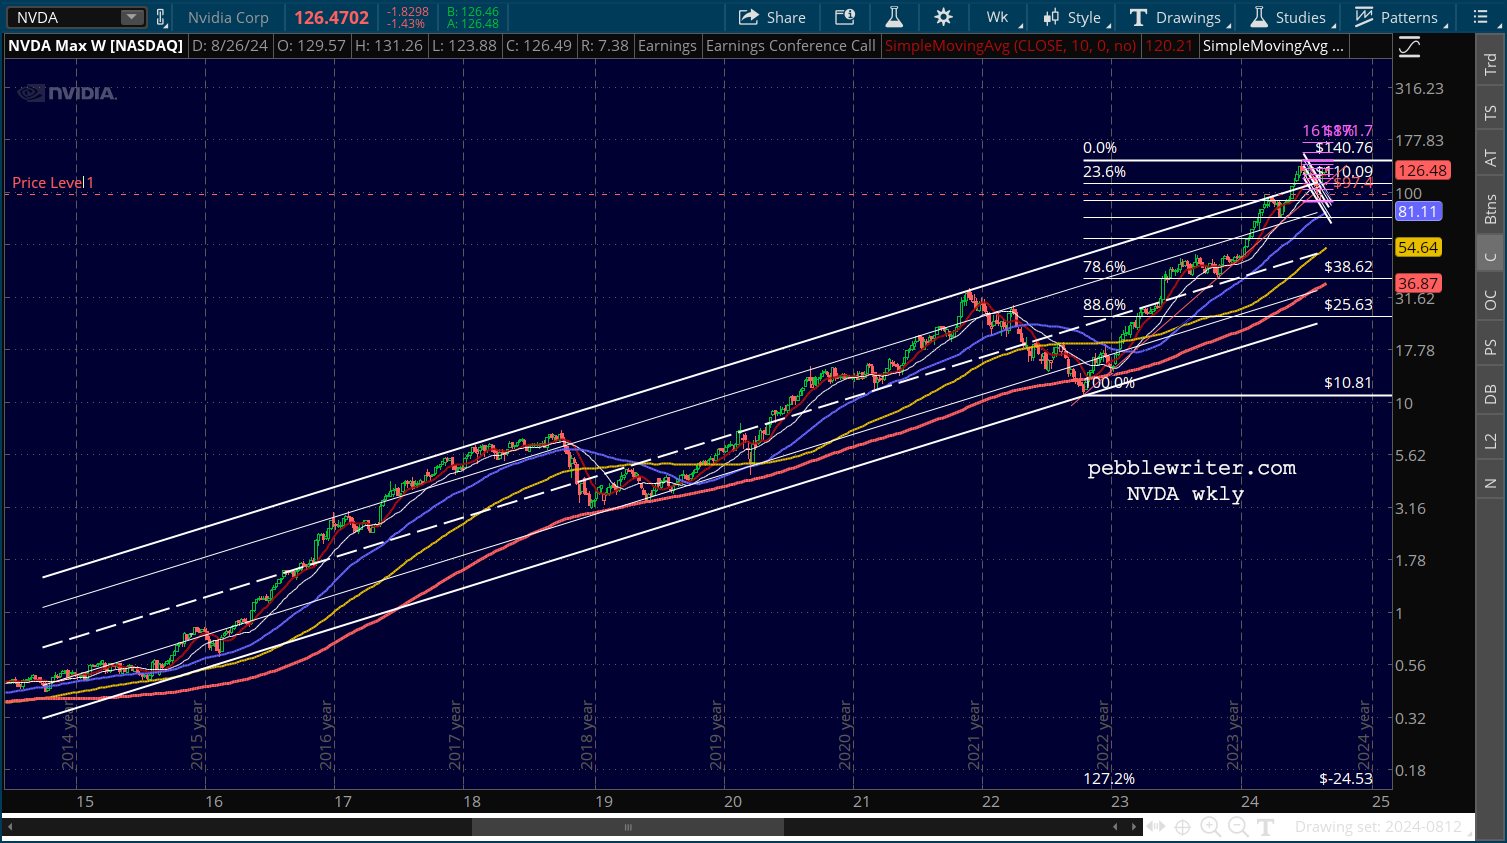
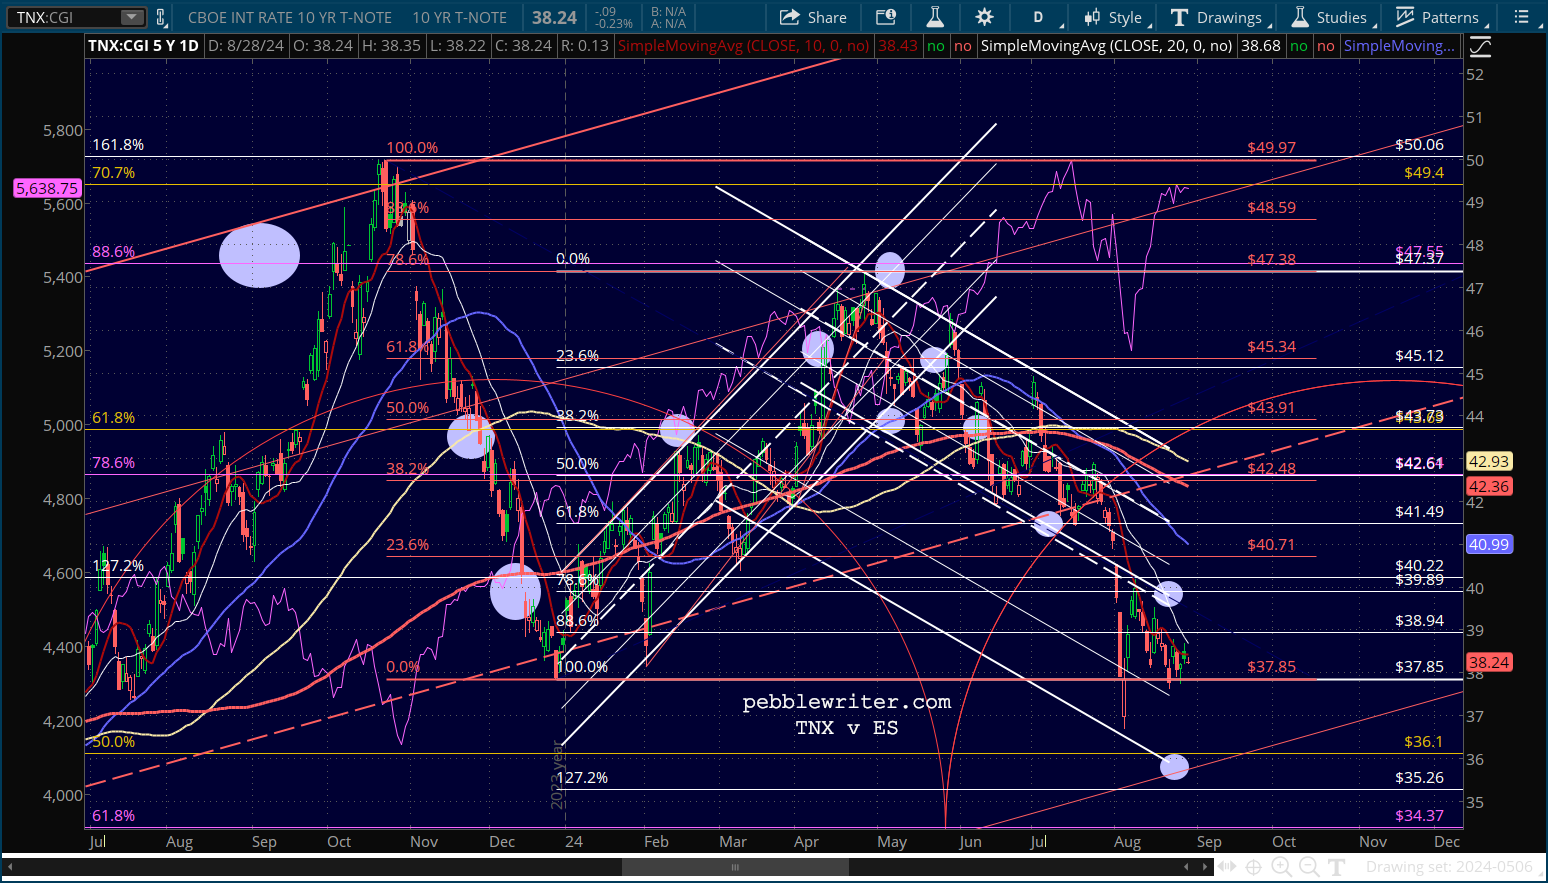 I’ve had a number of queries regarding NVDA, which could obviously have a great impact on the market after its earnings report. We posted the closeup of its price chart yesterday. The falling white channel was pointing toward an intersection with the SMA200 around Aug 15. But, the stock bounced off its .382 Fib on Aug 5 and never looked back.
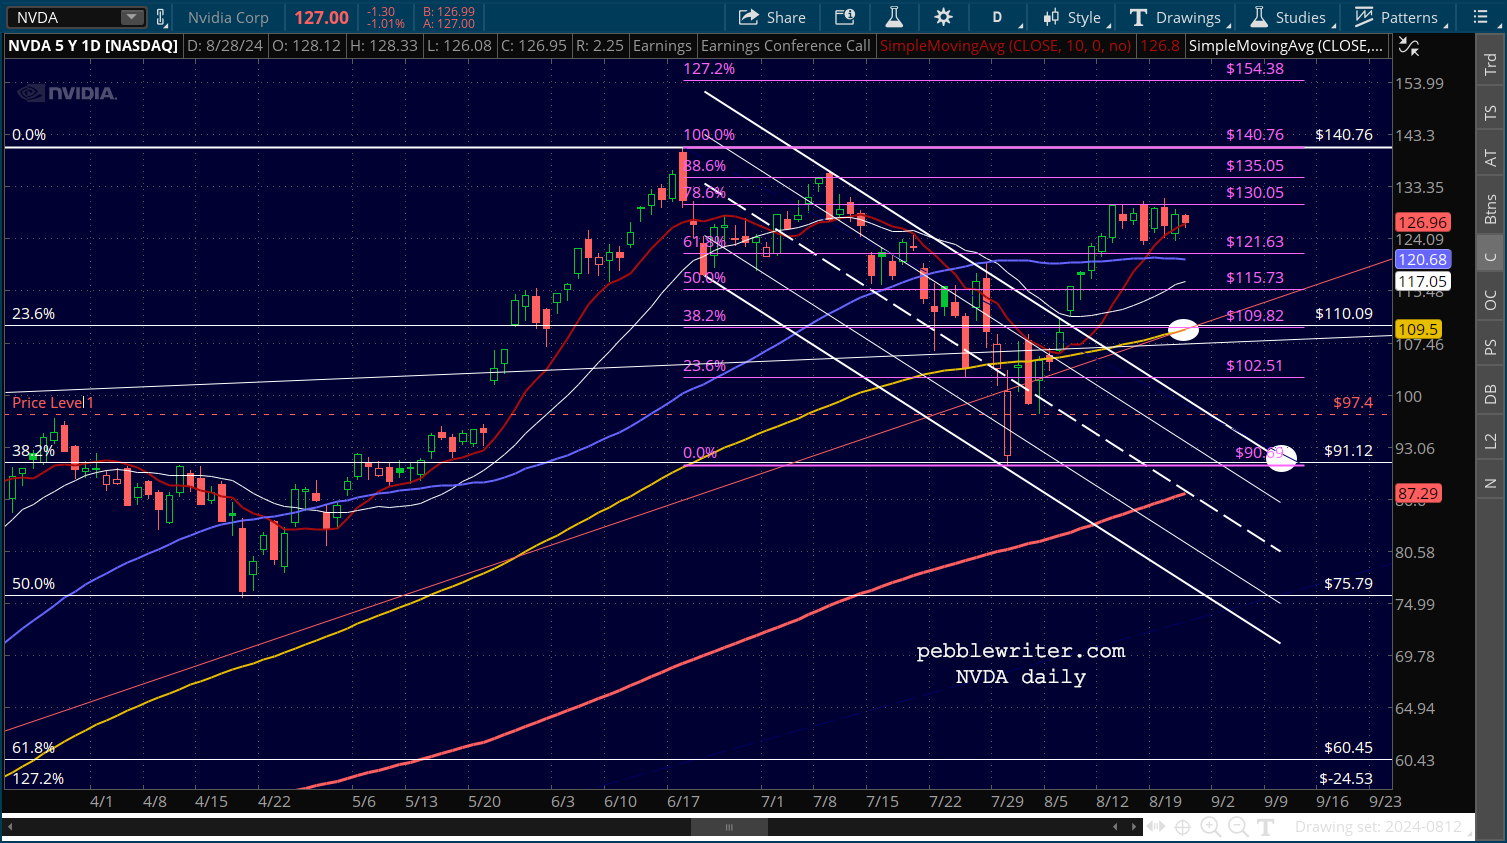 Note that this bounce also allowed it to hold the red TL from the Oct 2022 lows. A drop to the SMA200 would have meant a more serious breach.
The bounce also allowed it to pop back above the top of the rising white channel from 2014…
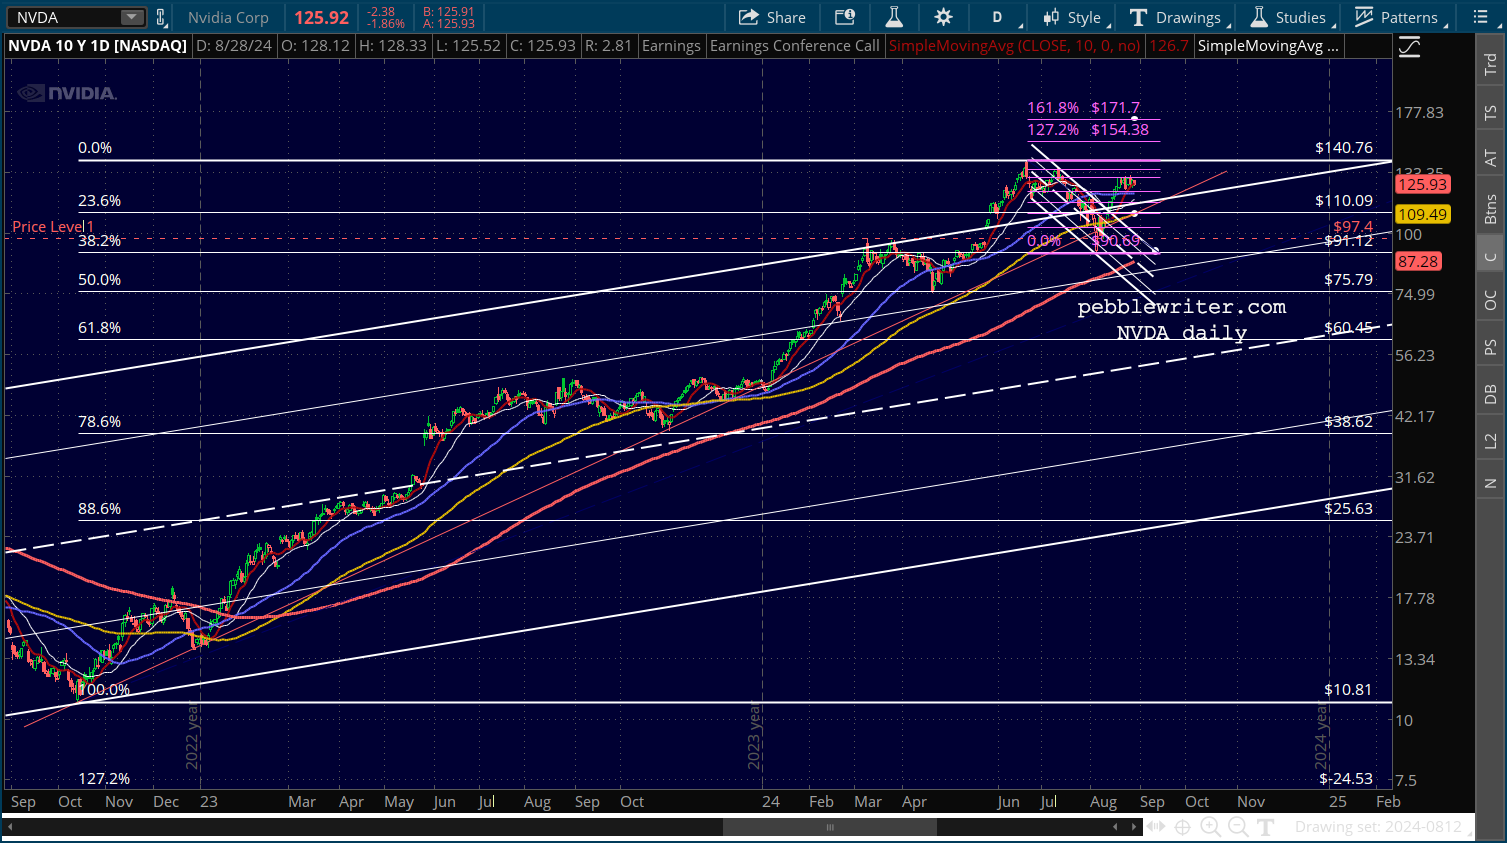 …seen here.