Everybody’s talking about interest rates — mostly fears about the yield curve. Even the most vocal market cheerleaders have been seen publicly fretting about the flattening yield curve. Will it invert? What will it mean? Will the market crash?
Since our forecasts are pretty much on autopilot at the moment, let’s take a fresh look at where we came from, where we are, and where we’re likely going.
Remember this chart [see: The Yield Curve May 3, 2018], warning of the repercussions should the 10s2s bounce off the white TL?
 It didn’t. But, what’s interesting is why it didn’t. At the time, SPX was struggling to break out of a downtrend which began in late January and back above the important Fib extension at 2703.
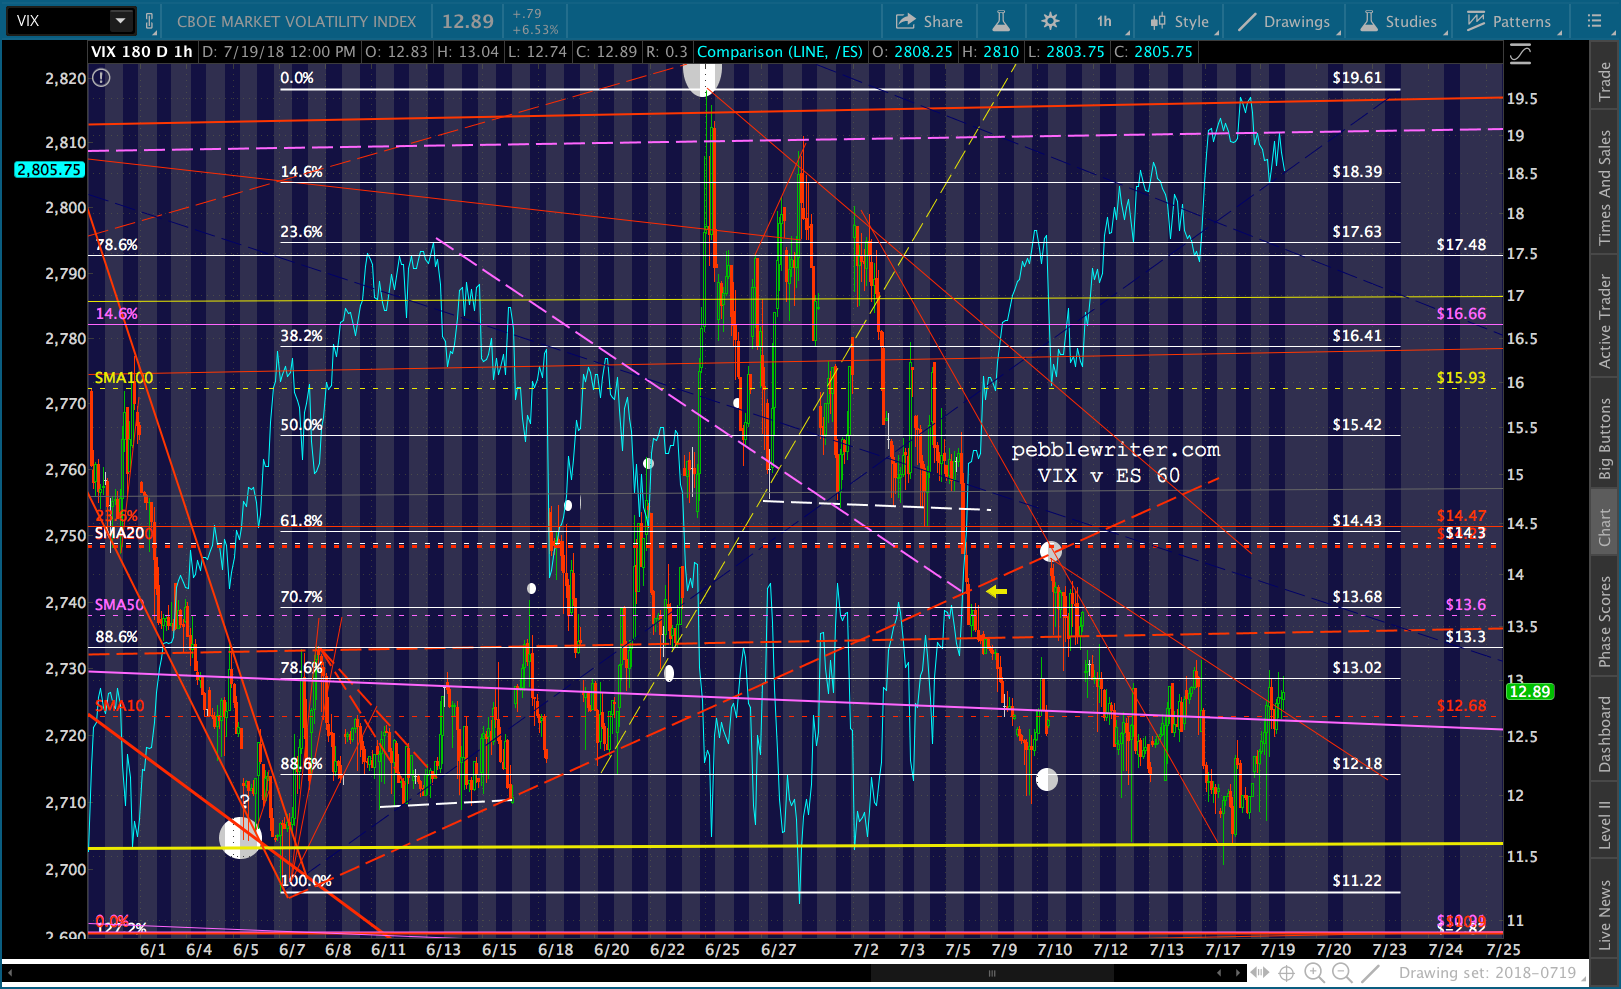
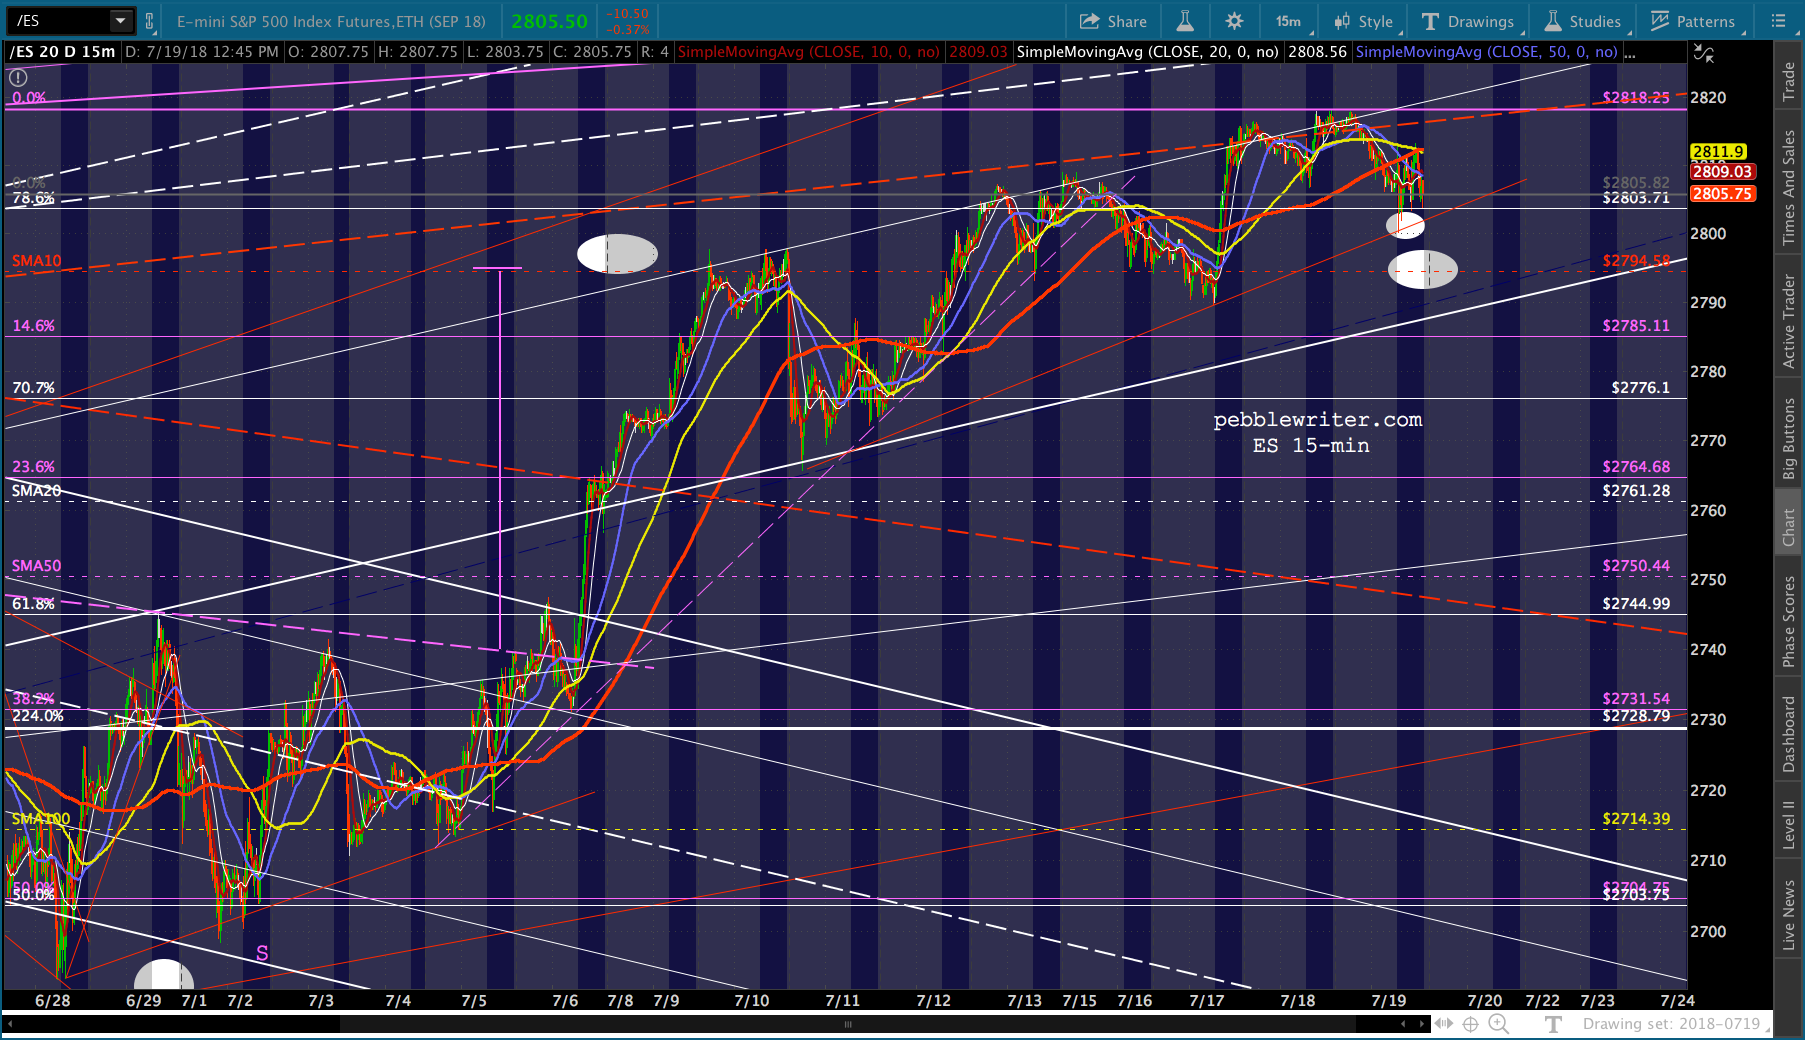
By continuing below the trend line connecting the former lows, the yield curve contributed to SPX’s breakout instead of continuing breakdown. It’s the sort of thing which has kept the rally alive, on a macro level and even day-to-day, as happened lately with VIX. Note ES’ breakout above the purple TL came at the same moment that VIX broke below its rising red TL.
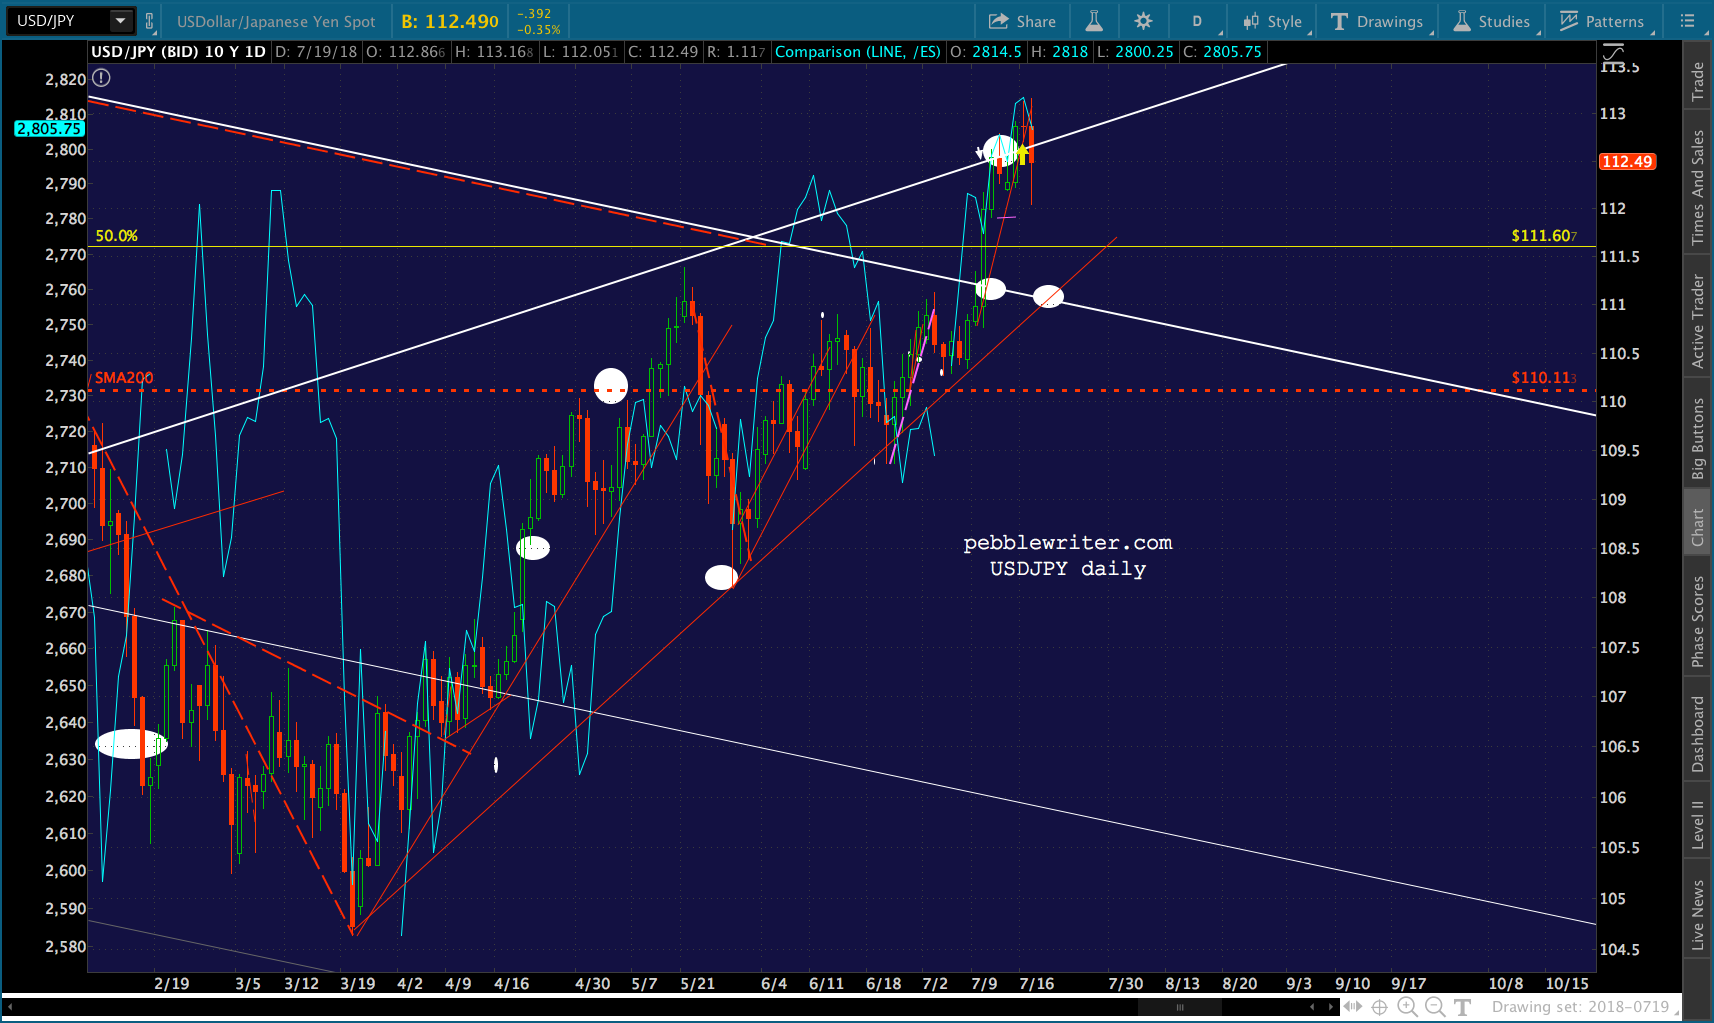
 And, it’s happening right now with USDJPY, which broke above the top of a falling white channel and is pushing above a backtest of the rising channel from which it broke down in January. New highs, made to order.
 Indices are generally only allowed to correct when there’s a trend line, moving average or Fib level to backtest.
 It wasn’t always this way, of course. During the two major crashes of the past 20 years, interest rates and equities moved very much in tandem. This was true of the 2Y and the 10Y.
 But, things changed dramatically after central banks took over the bond market. Rates, which had been driven lower by the flood of equity monies into bonds during the crash, were driven even lower.
The Fed bathed financial markets in trillions in fresh liquidity, boosting all financial assets. In the process, it also tilted the tables of the relative attractiveness of bonds versus equities. 
 A 10Y that exceeds 3% is a problem with $22 trillion in debt. From Feb 23’s Why Rising Rates are a Problem This Time. The solid black line shows plunging average interest rates across US borrowings, while the orange line shows soaring net interest expense resulting from the massive growth in debt.
As much as they would like to raise long-term rates, the Fed has done the math and knows it would be a knockout blow from which the economy might not recover (Japan anyone?)
 But, the Fed needs to create some headroom on the short end of the curve for the next time they have to bail out the markets. So, we’re left with a curve that gets flatter and flatter, approaching inverted.
 If they’re paying attention, the Fed knows that they can’t allow it to actually invert — as this would send the signal that a recession is in the offing. But, they need to get it as close as possible, meaning another hike or two while the 10Y continues to go sideways (over 5 months since reaching our 2.856 target.)
So far, equities are on board with rising short-term rates. But, what happens when the Fed is done painting itself into a corner, when the choice is either to invert or allow the spread to widen?
continued for members…
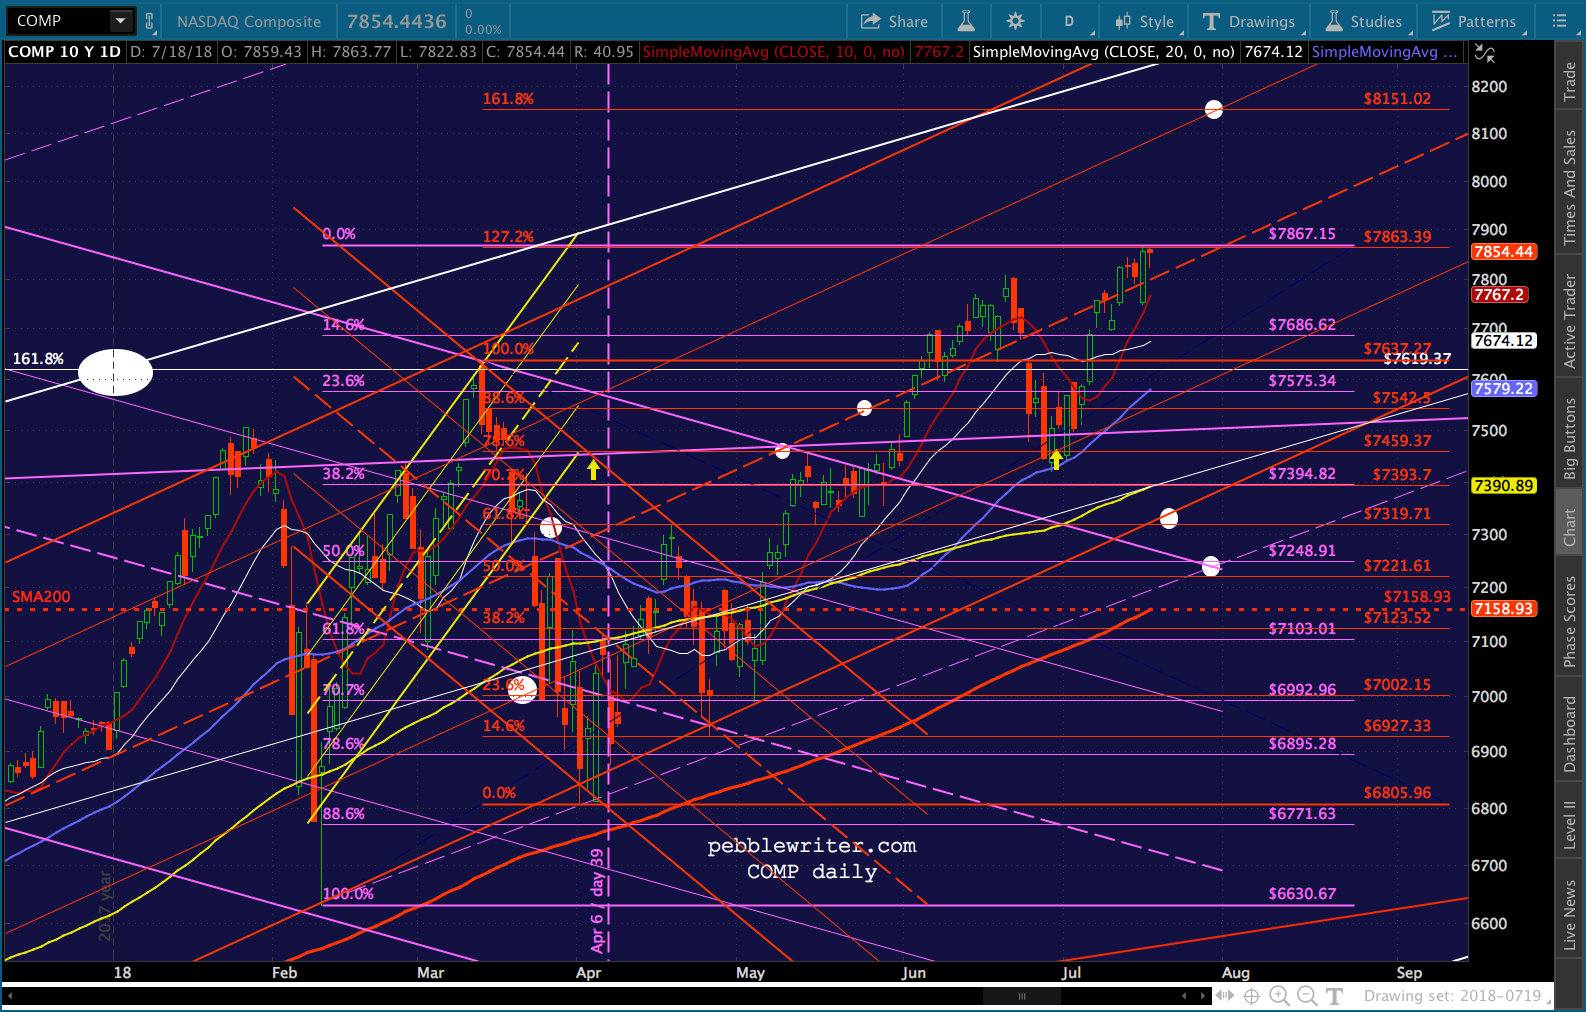
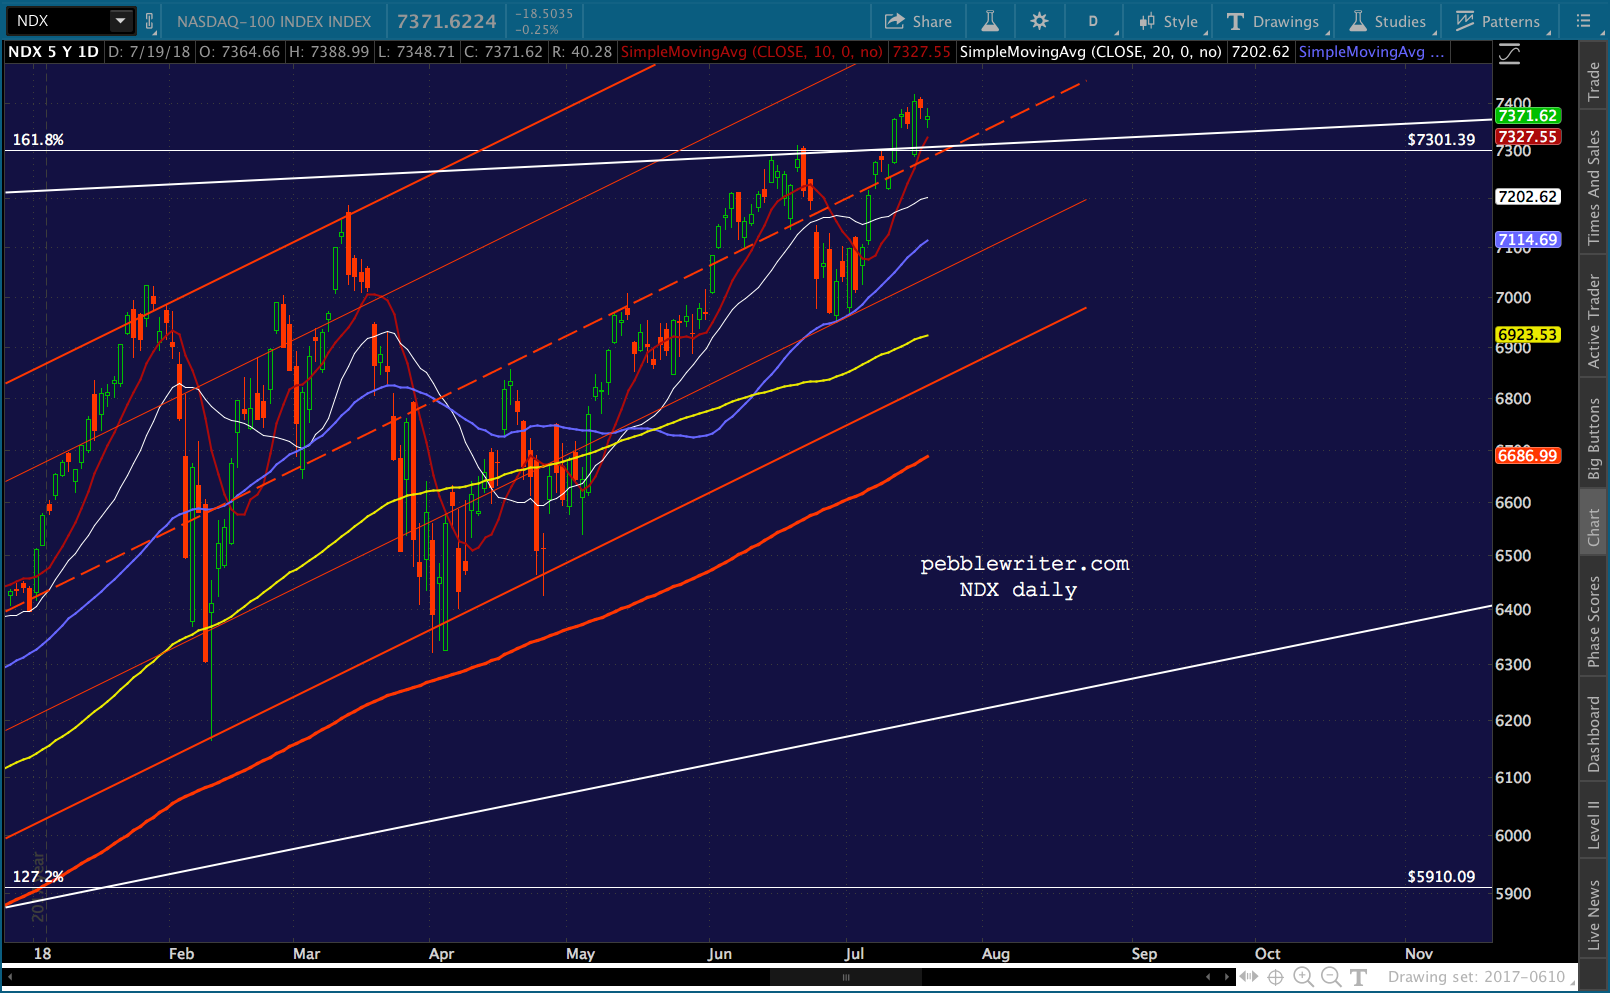
I think the key is in the 10Y chart. Note that the last few downturns in rates we’ve had have accompanied stock rallies.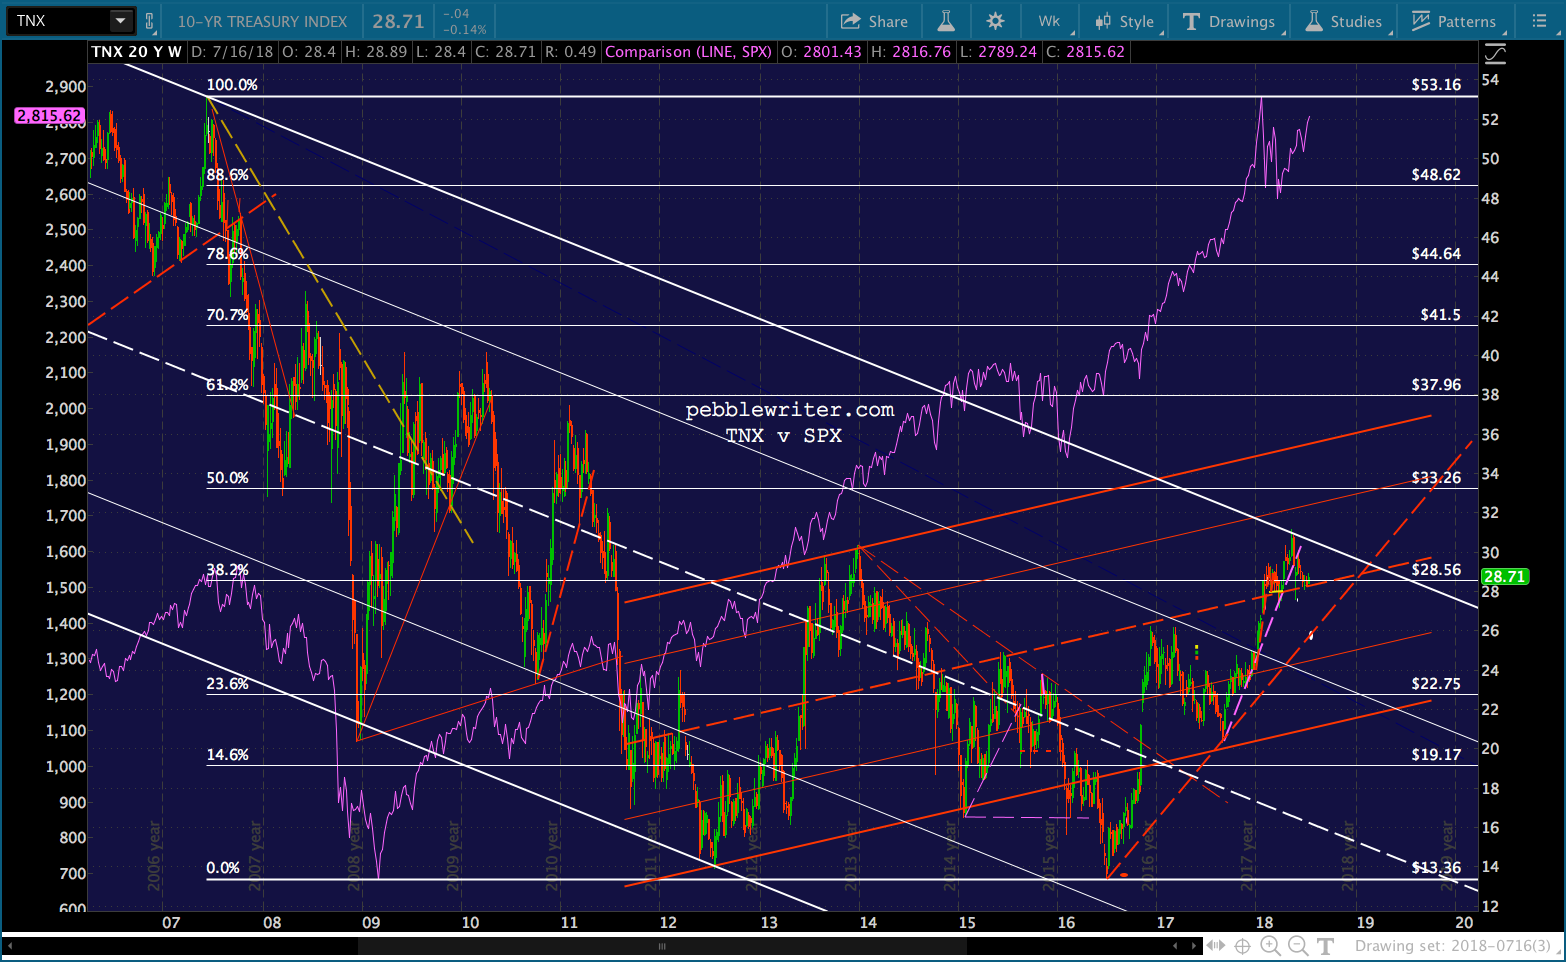 With DJI having broken out yesterday, SPX safely above 2703, and COMP and NDX having broken out, stocks already have a head start.
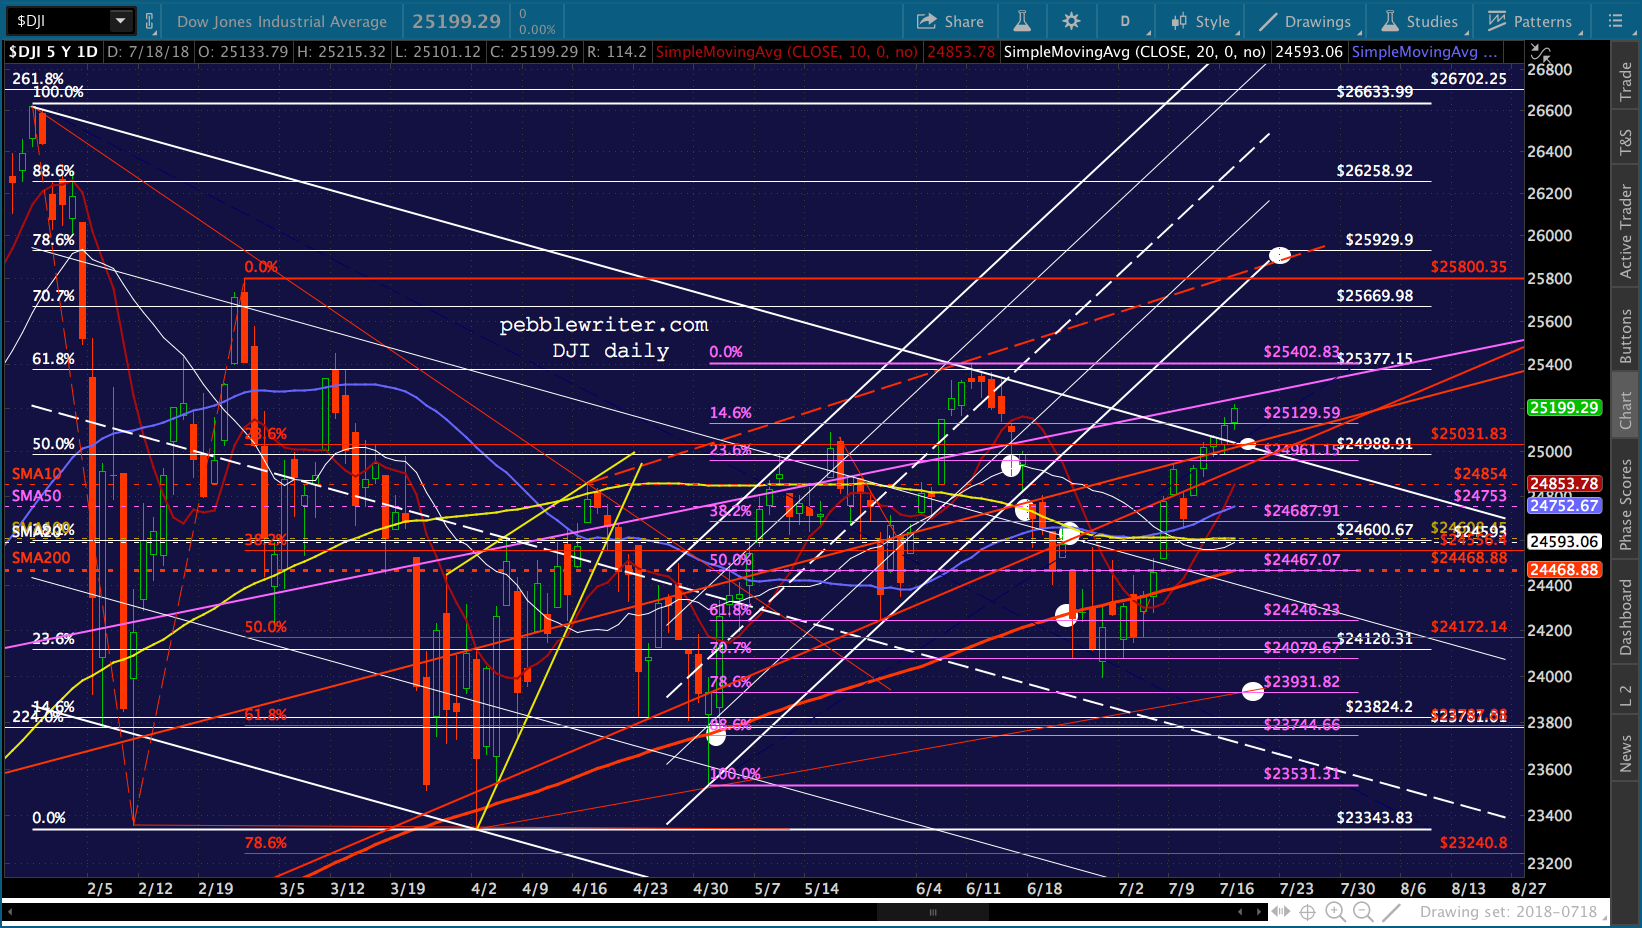
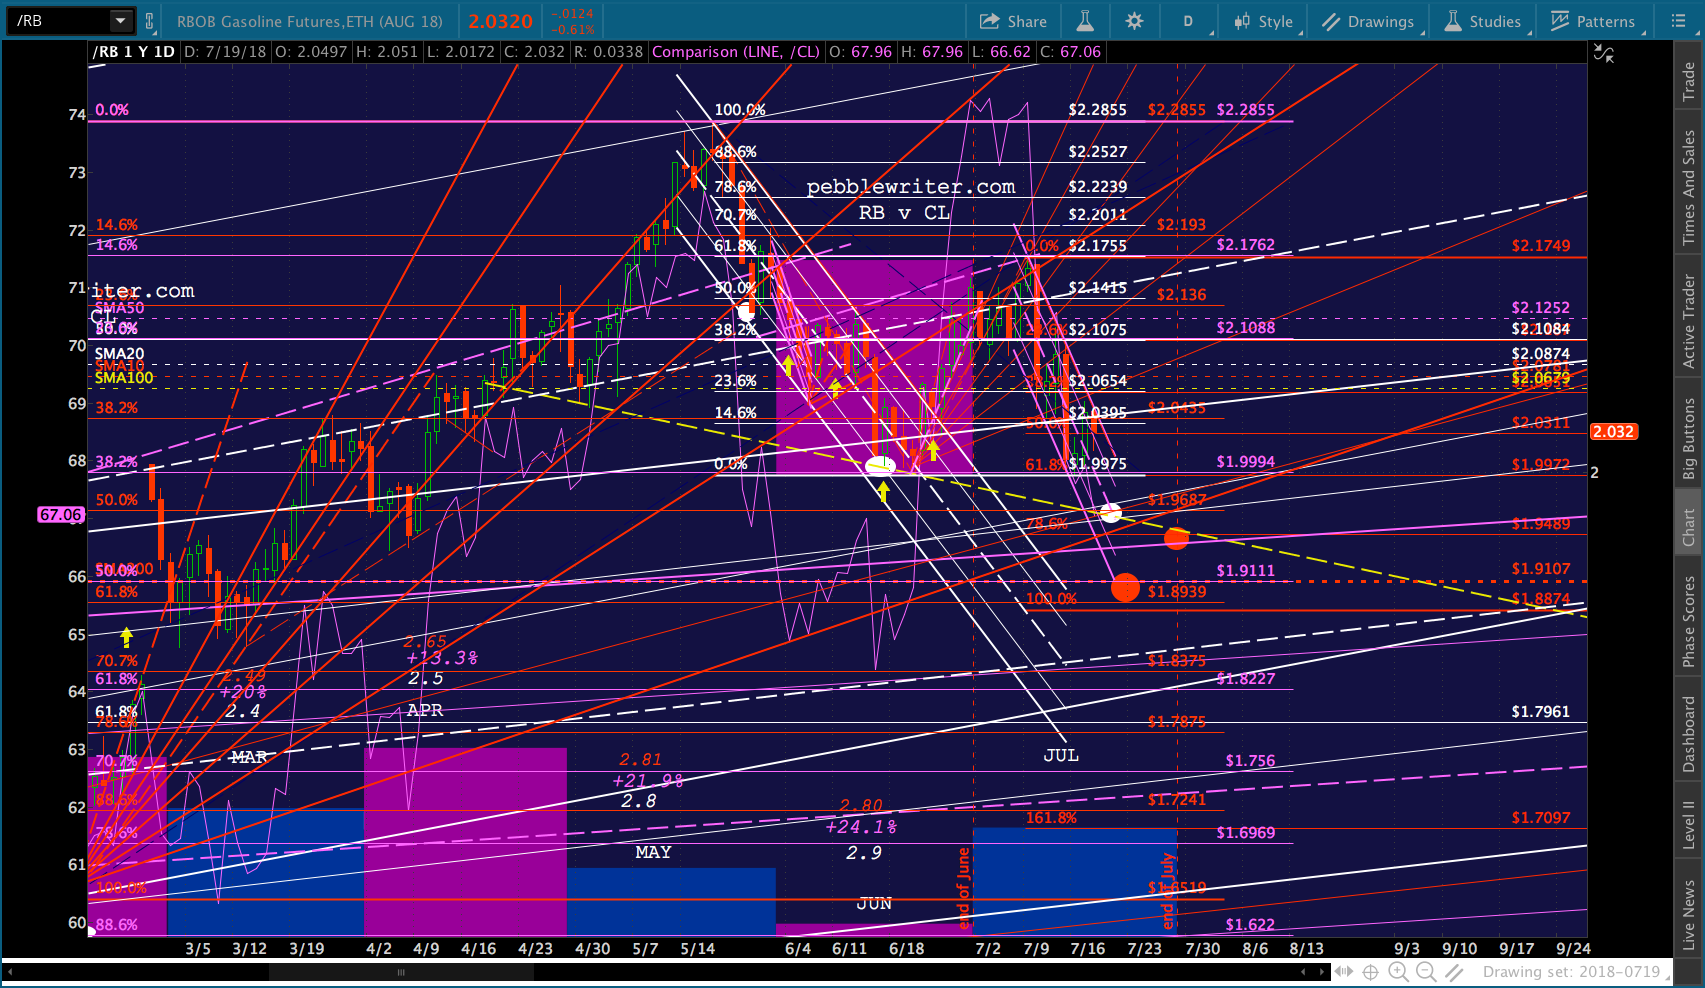
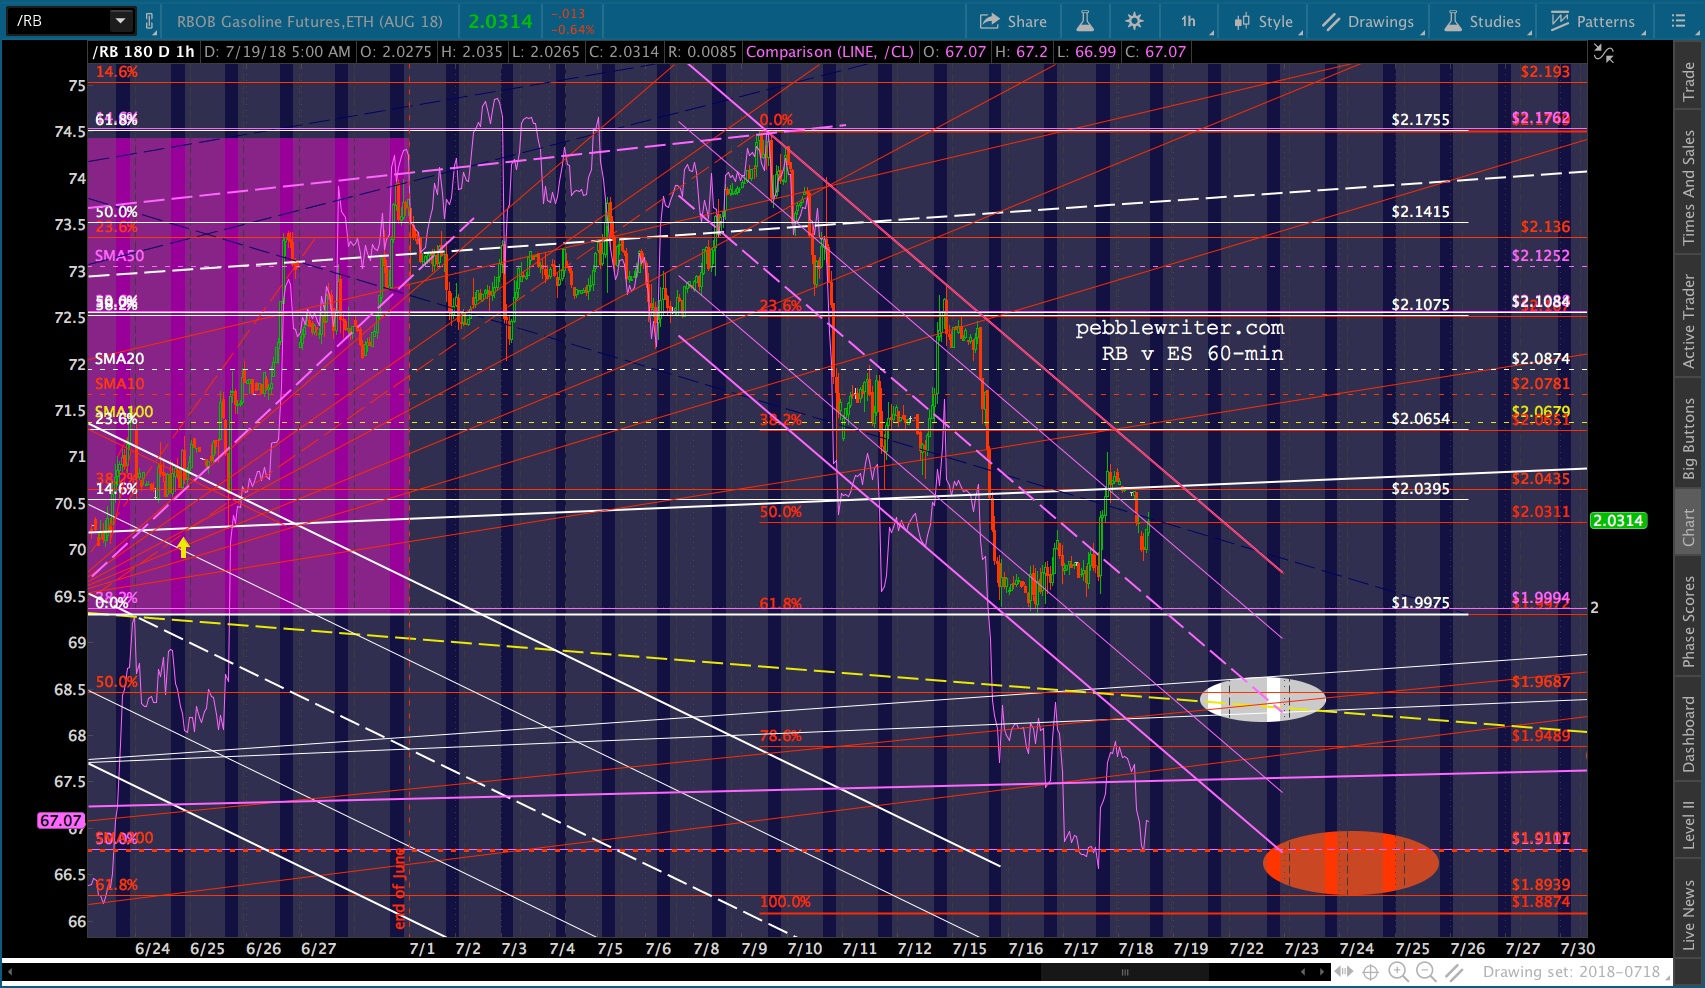
 RB and CL can continue to their lower targets without doing any major damage. When they bottom out, they’ll be in a position to bounce and keep equities on the rise as needed. As we discussed yesterday, though, keep on eye on those TLs for sign of a breakout out of those falling wedges 67ish for CL and 2.02 for RB.
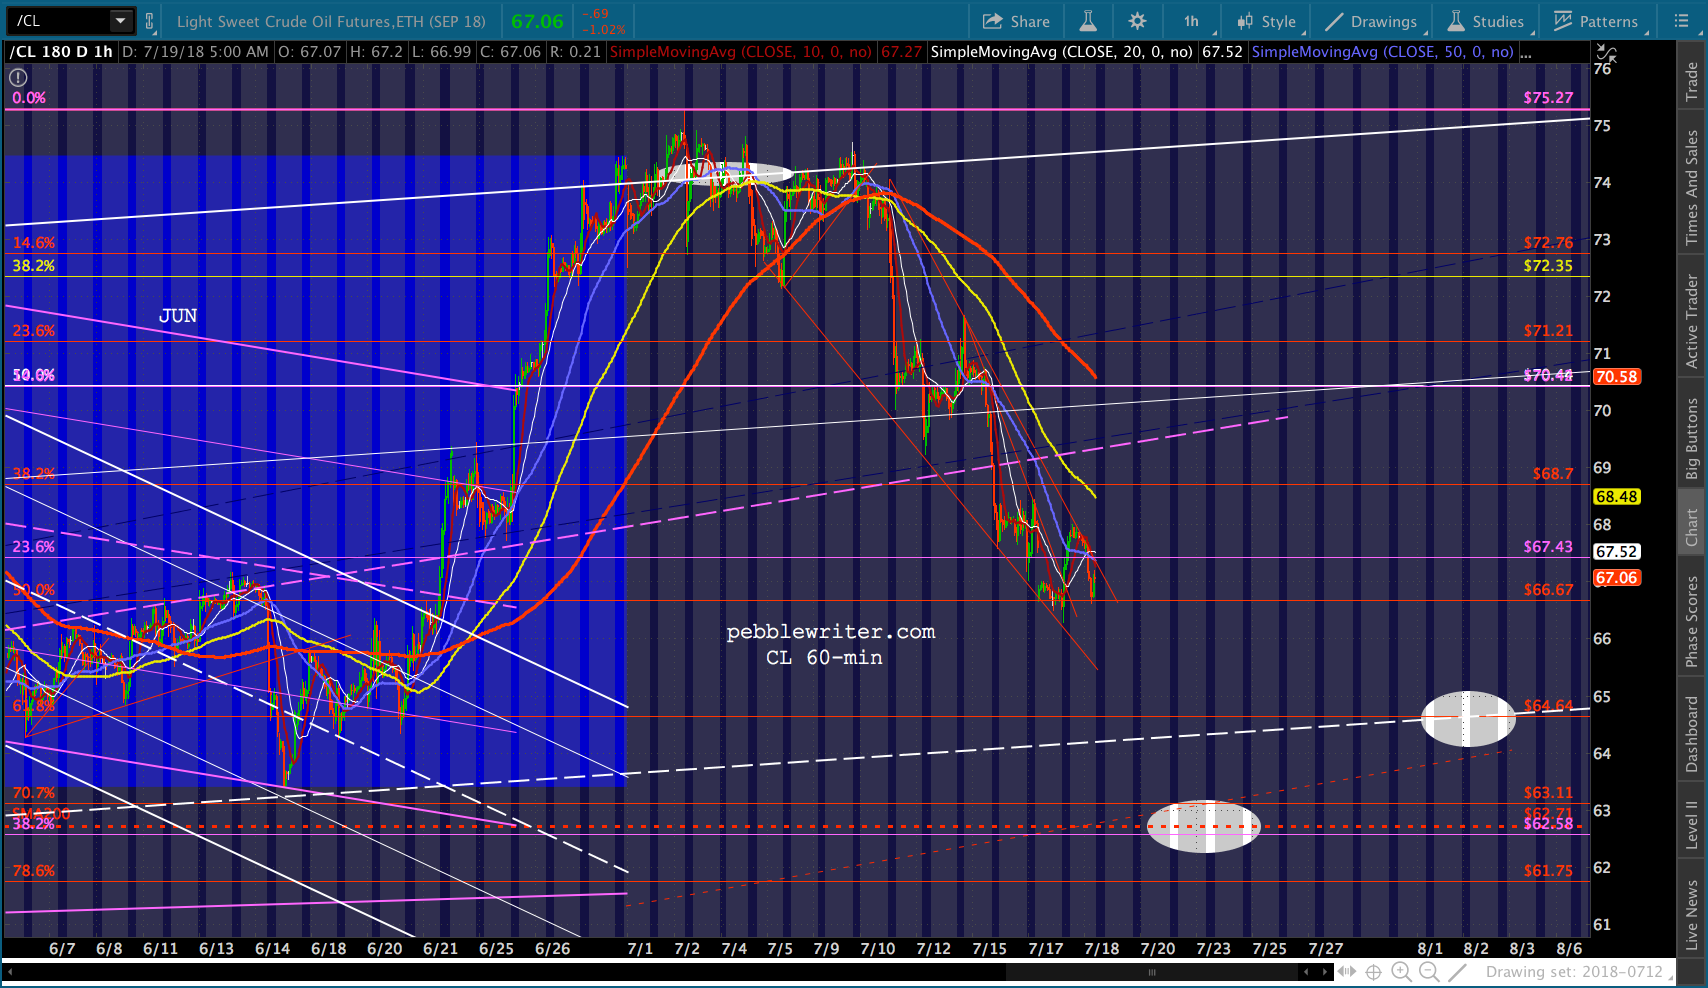
 And, when they begin to be problematic from an inflation standpoint, again, USDJPY stands ready to push higher.
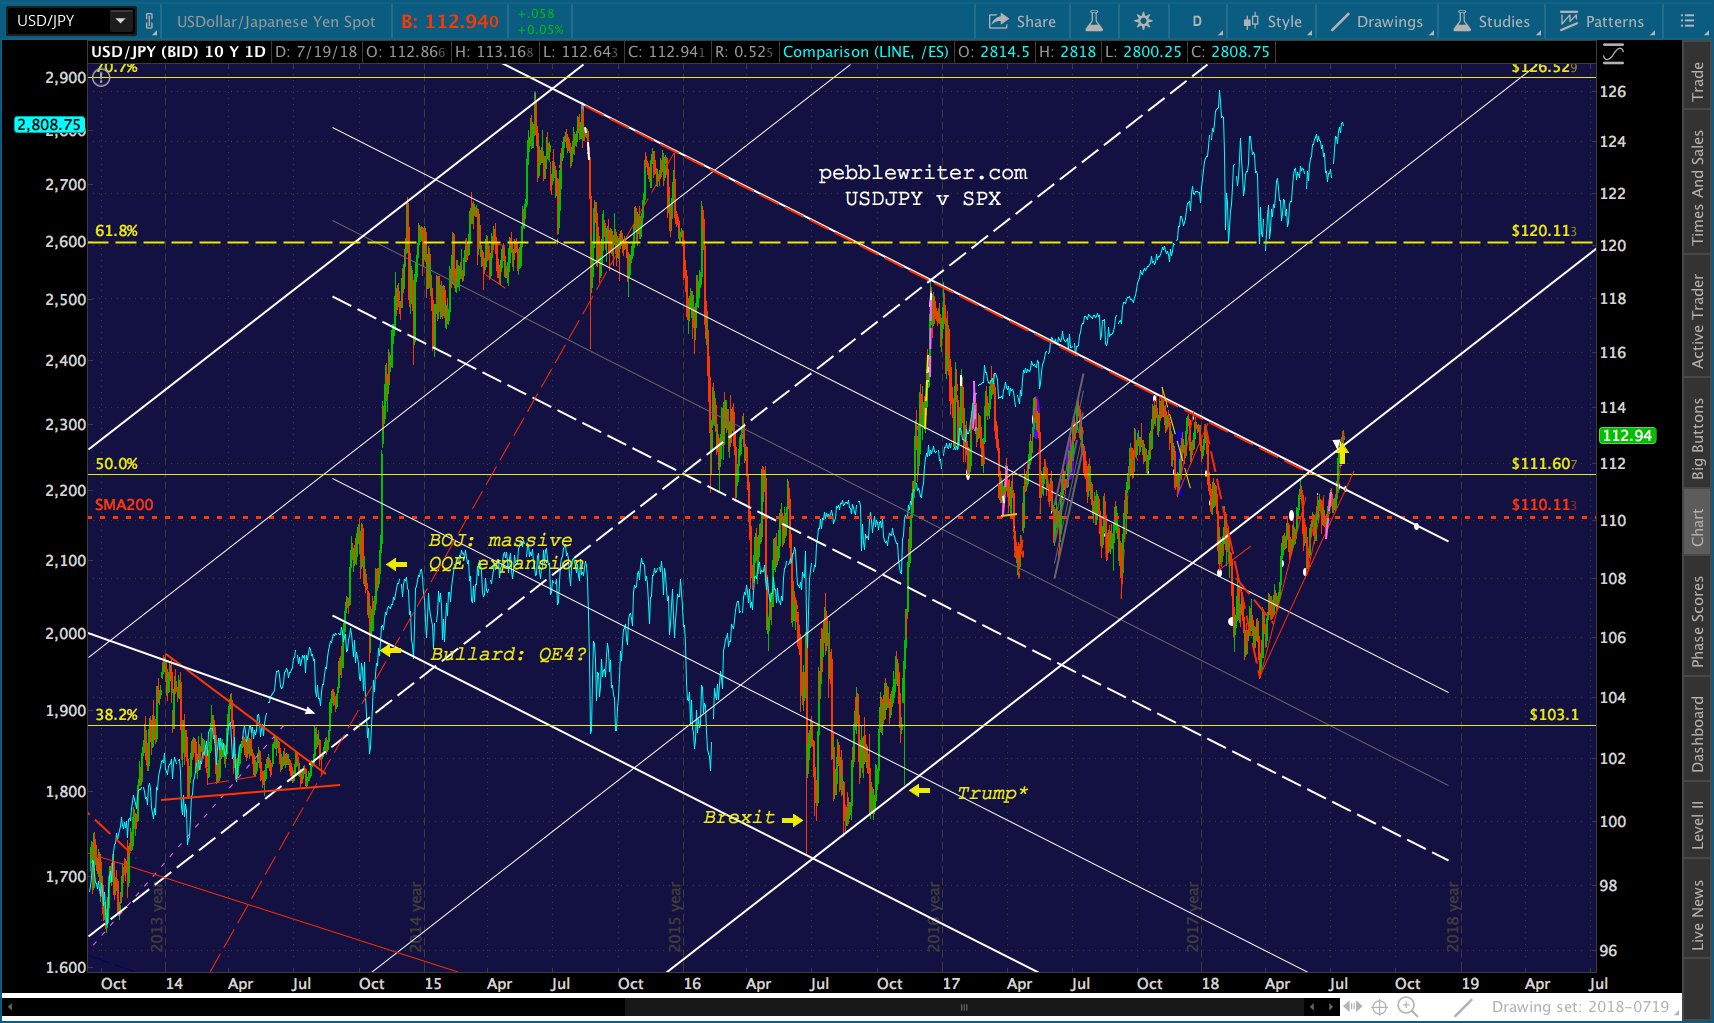 The above is the rosy scenario, of course. Things can and do go off the rails from time to time. The dollar’s strength, in particular, has been a problem for developing markets — which has been known to gum up the works over the years.
More later.
UPDATE: 3:55 PM
Not much new to report. Things are mostly where we left off this morning.