

Ignore the headlines. If you’re looking for something to blame for this morning’s sell off, look no further than USDJPY, which has once again stumbled at the all-important .618 Fib at 120.11. It’s easy to see from the chart above that every time USDJPY pops up above 120.11, ES rallies. Every time it drops below, ES declines. This morning, it even put in lower lows after registering a lower high than yesterday. With any other financial instrument, we’d call that a trend. With the tightly managed USDJPY, it’s more of a tool.
 So, why the inability to decisively retake 120.11? What’s the end game? As regular readers know, most of the “market’s” gains since 2011 have been driven by the yen carry trade. If the yen doesn’t keep dropping in value (USDJPY gains in value) then the bull market is over.
So, the question remains, what will it take for the BoJ to keep bashing the yen — especially as negative political repercussions continue to rise? For the answer, we turn to another important chart, the Nikkei.
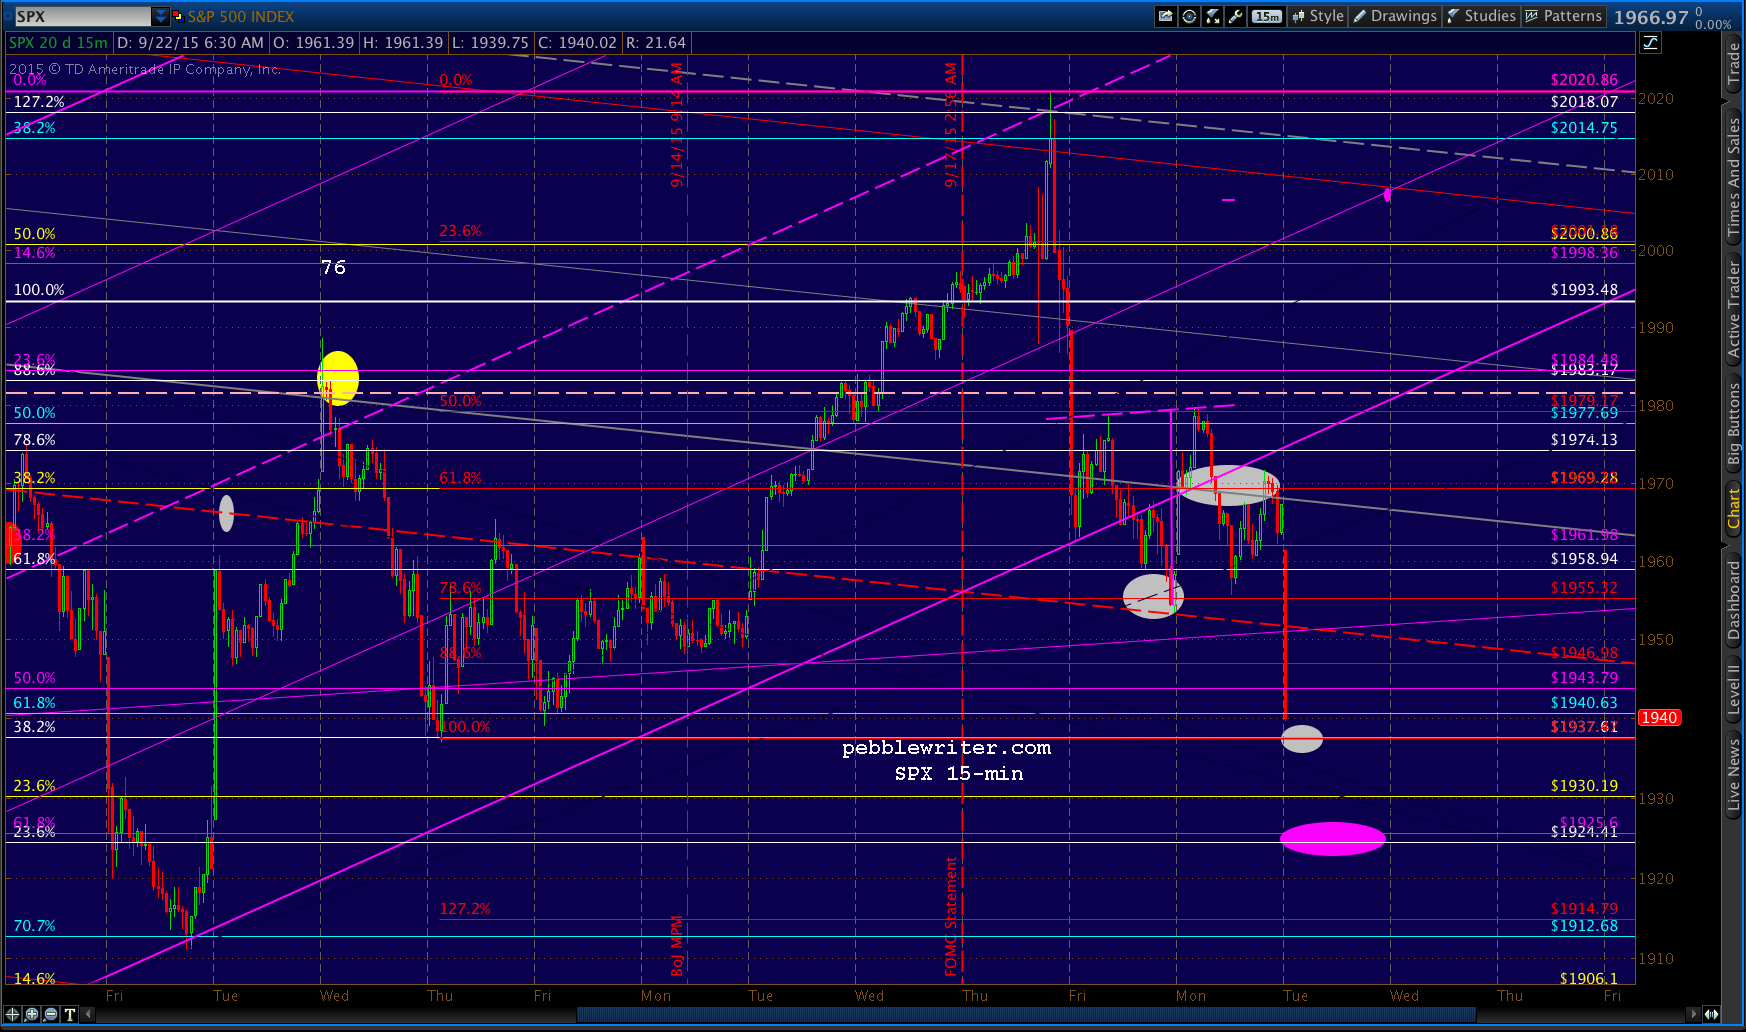
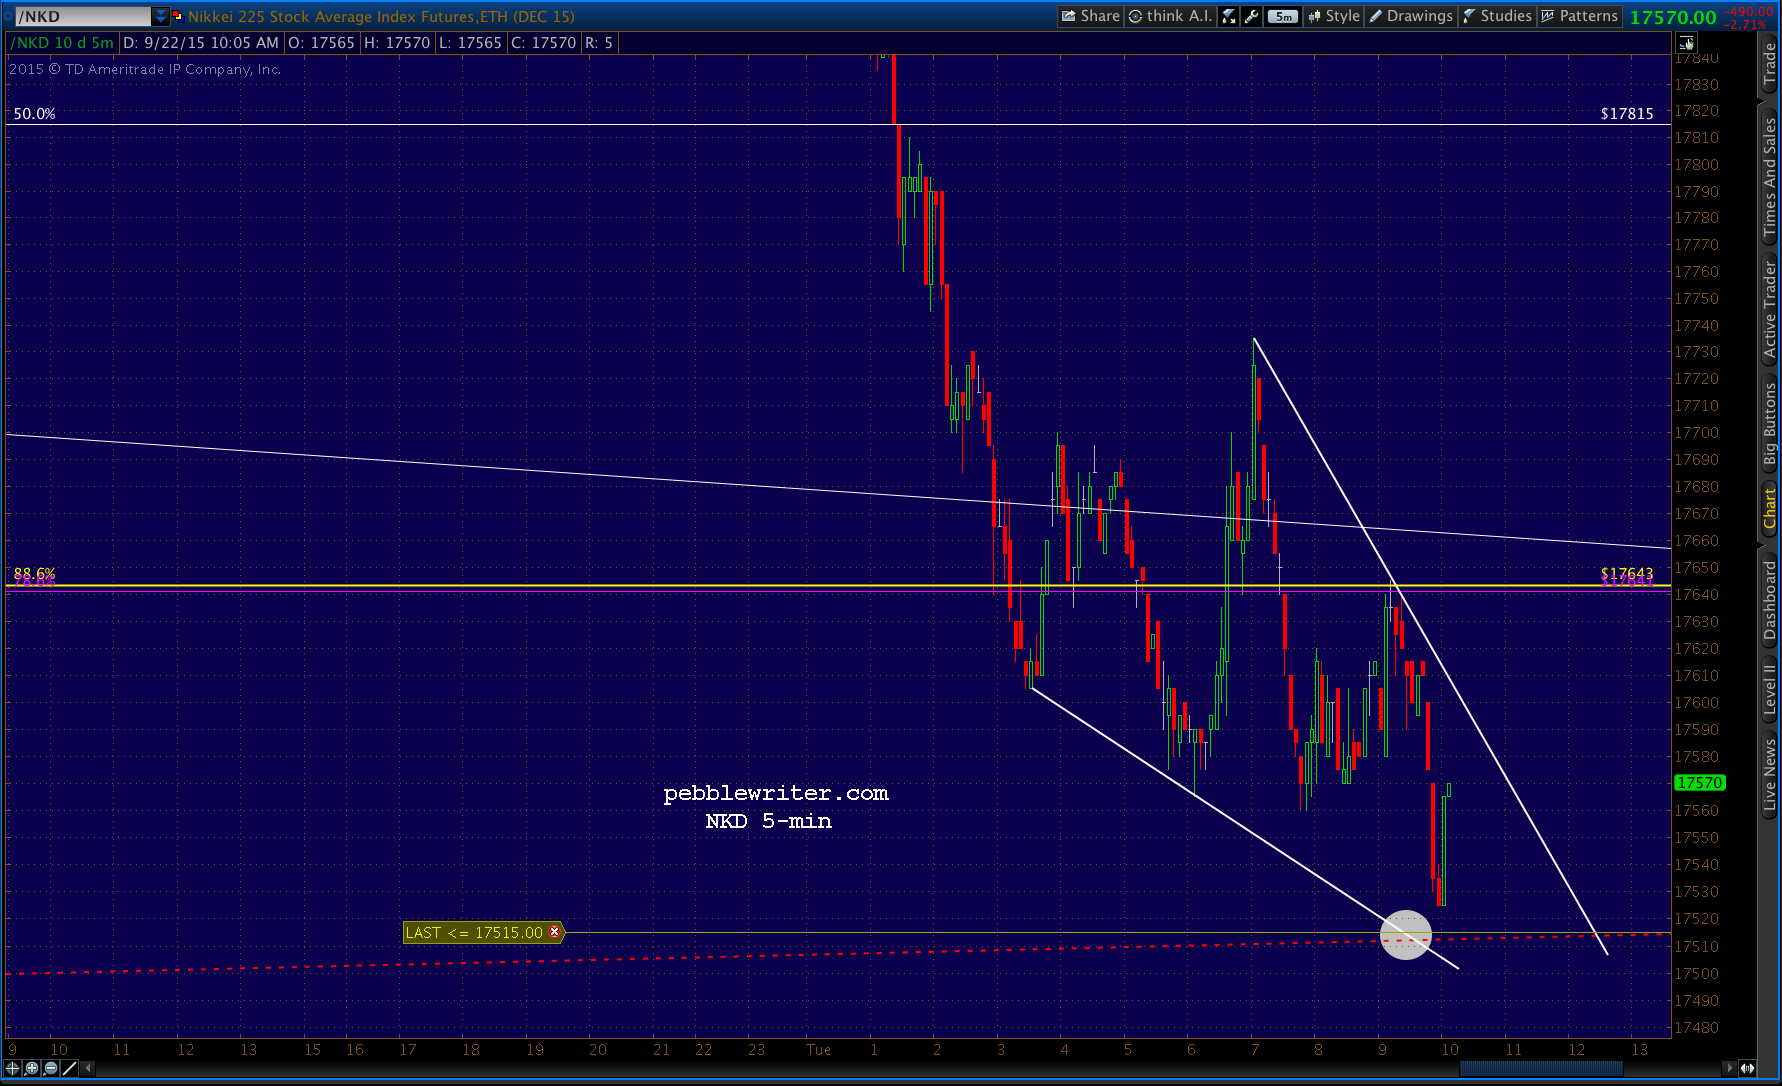
The Nikkei 225 is nearing an important trend line of support that we’ve been watching. If it bounces off that TL and continues northward, all is well. Kuroda and Abe can go back to fleecing the Japanese people in the knowledge that their phoney baloney jobs are safe. But, if it plunges through that TL…well, that might be just what carry traders need in order to get the BoJ off its keister.
Could it happen? And, more importantly, would it work? As we discussed in our last update on the Nikkei [see: Update on Nikkei, Sep 10], it might just be the pivotal moment for the bulls.
continued for members…
Just below the TL (about 17,500) is great channel and Fib support at 17000-17065. As we’ve been discussing for the past couple of weeks, I believe this is exactly what TPTB are shooting for. By breaking below the Aug 24 lows, it might create a sense of panic that would provide cover for another round of yen bashing and/or QQE expansion.
Whether it will work or not is anyone’s guess, but I believe it’s exactly what they have in mind. If for some reason the desired response isn’t forthcoming at NKD 17,000, then watch out. Things could get really ugly.
In SPX terms, we can finally pronounce the rising purple channel dead. Today’s lows should reach the white .382 at 1937.61, and should that fail, the purple .618 at 1925.6. Other important charts to watch: EURUSD broke down through the rising TL, but should find MA support.
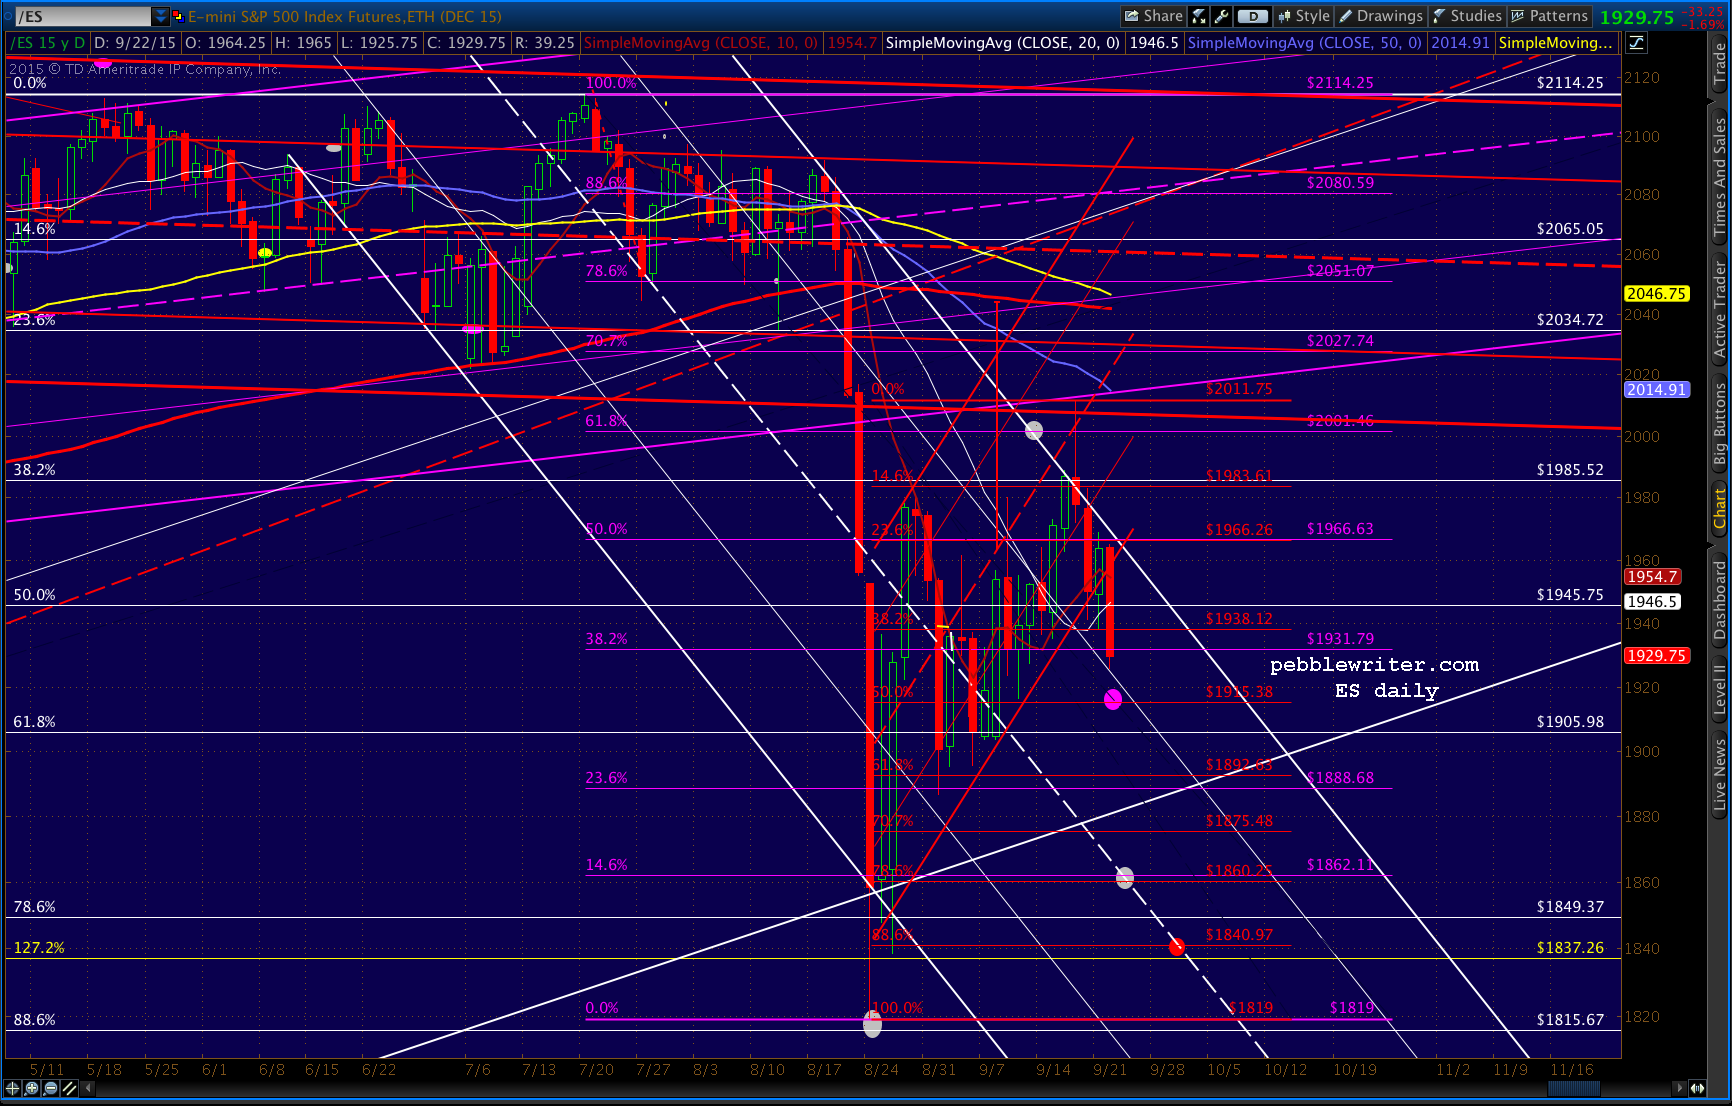
 ES better illustrates channel support than SPX.
 The bigger picture for USDJPY:
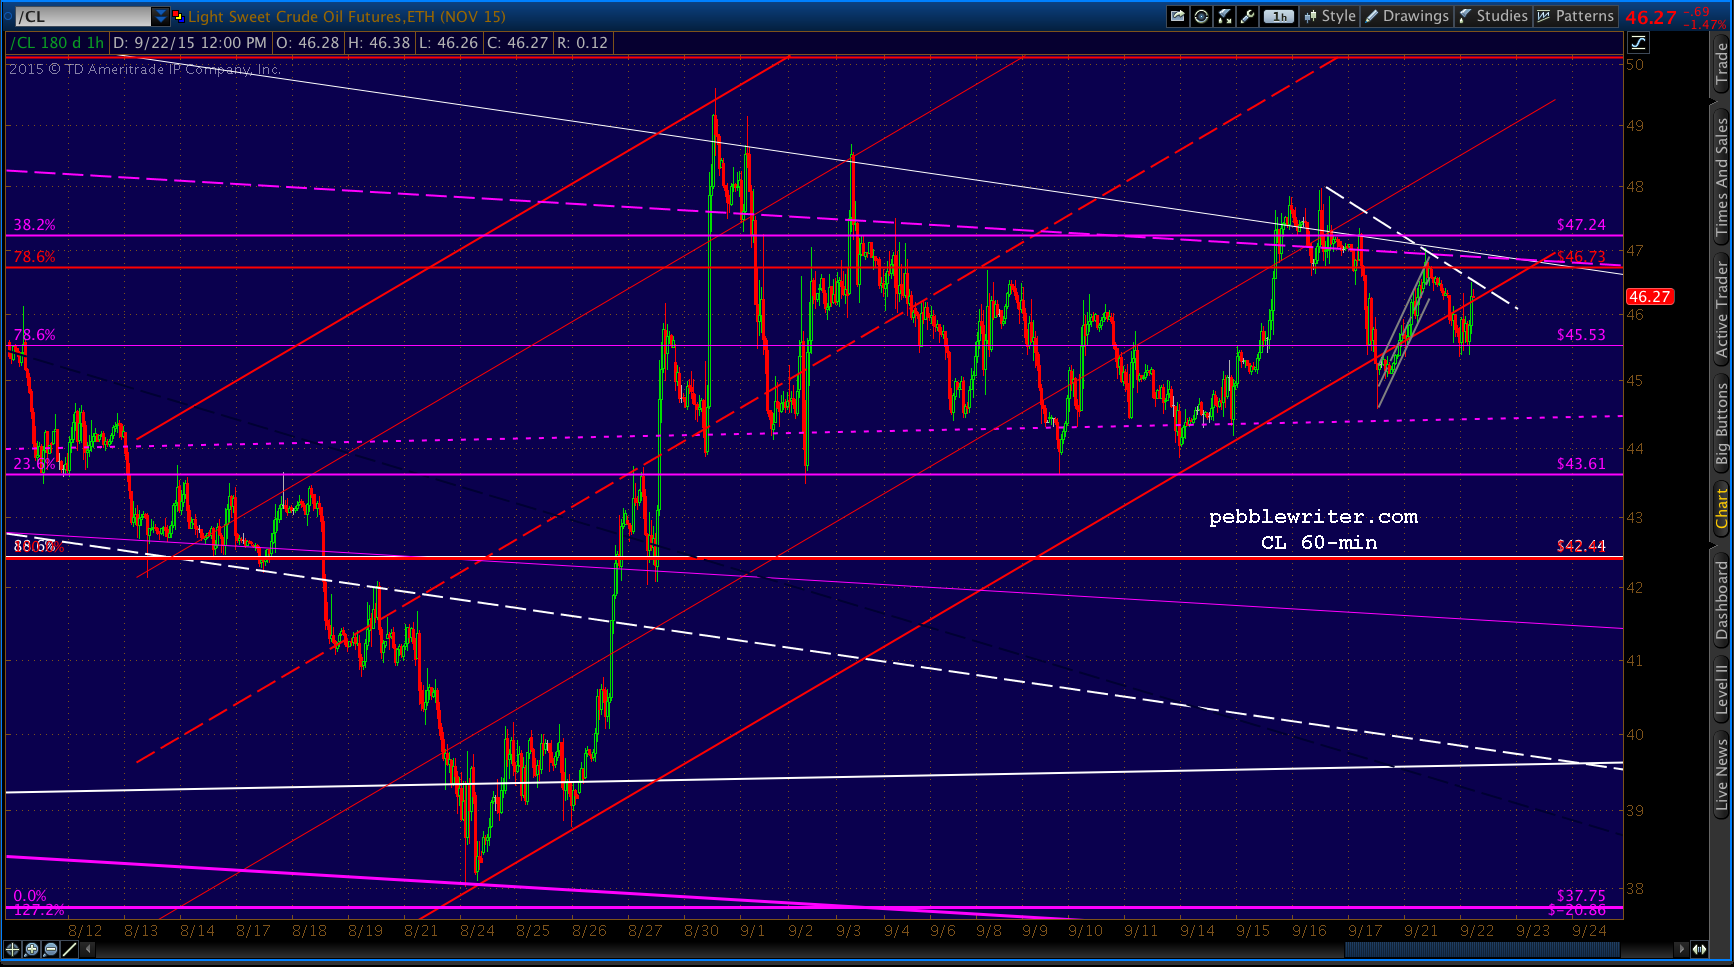
 CL has broken below the rising red channel bottom again. But, like yesterday, it will probably be used to fine tune stocks’ decline. And, the falling purple channel midline is still very close by for when it’s time for a breakout.
 UPDATE: 9:36 AM
Stops here on a long position should be very tight, as we never know when the next push lower will kick in.
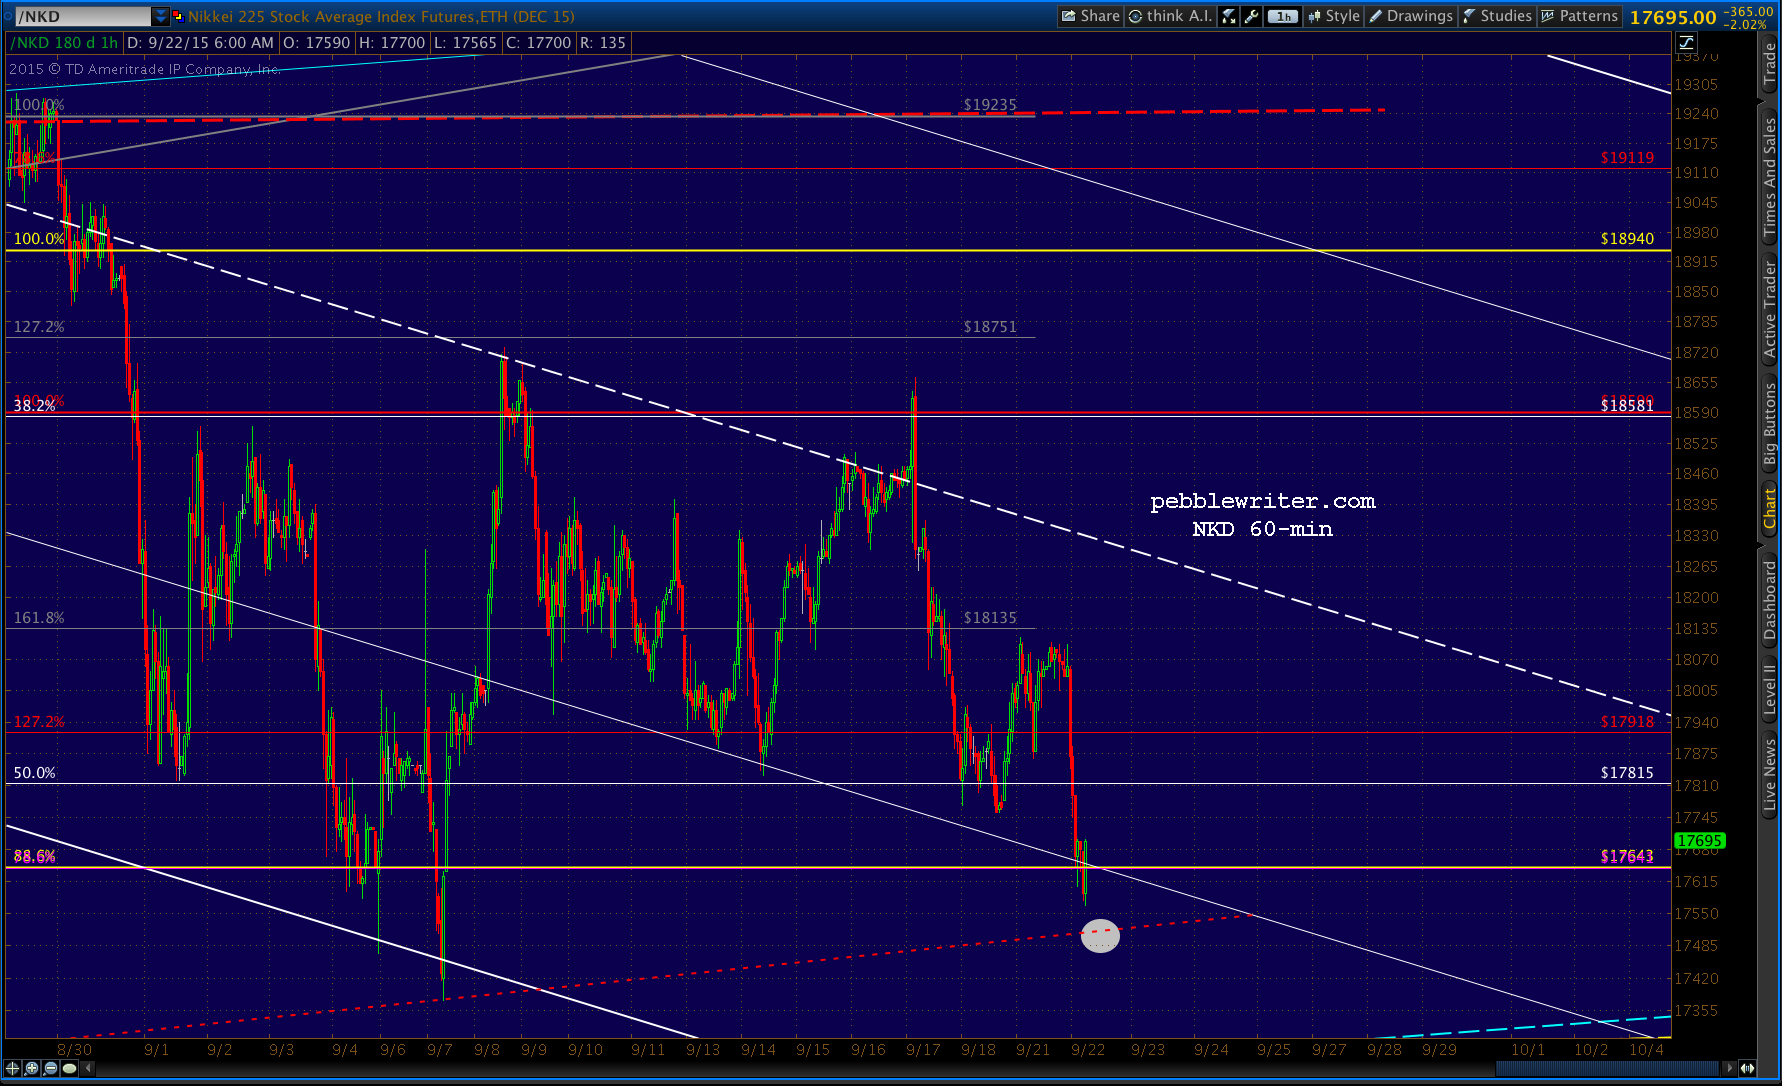
 Here’s the NKD chart that signalled the bounce. The failure to get to the TL in the opening minutes is typical of the “market” lately.
The initial move rarely reaches the day’s target. Instead, we get a push that gets us most of the way there, followed by a tortuous, algo-driven drip-by-drip climb higher, and a final denouement into the close that usually nabs our target.
It just reinforces my assertion that the “markets” are still being very closely controlled — despite what the headlines might contend.
 And, here’s the accompanying USDJPY chart showing the retreat to 120.11 in order to slow/delay the initial decline. If it continues to back off, we’ll know to reopen the short without delay. Notice that it didn’t quite reach the white .618 earlier, or 120.11 just now. It’s a matter of keeping options open, to justify the higher high or lower low when/if it is called for.
 UPDATE: 10:34 AM
 I’d put the odds of a bounce at just below the previous lows at 50:50. NKD still has a ways to go (17,510 or 17,515) and it appears to be in a hurry to get there. I’d stay short unless NKD or USDJPY suddenly reverse.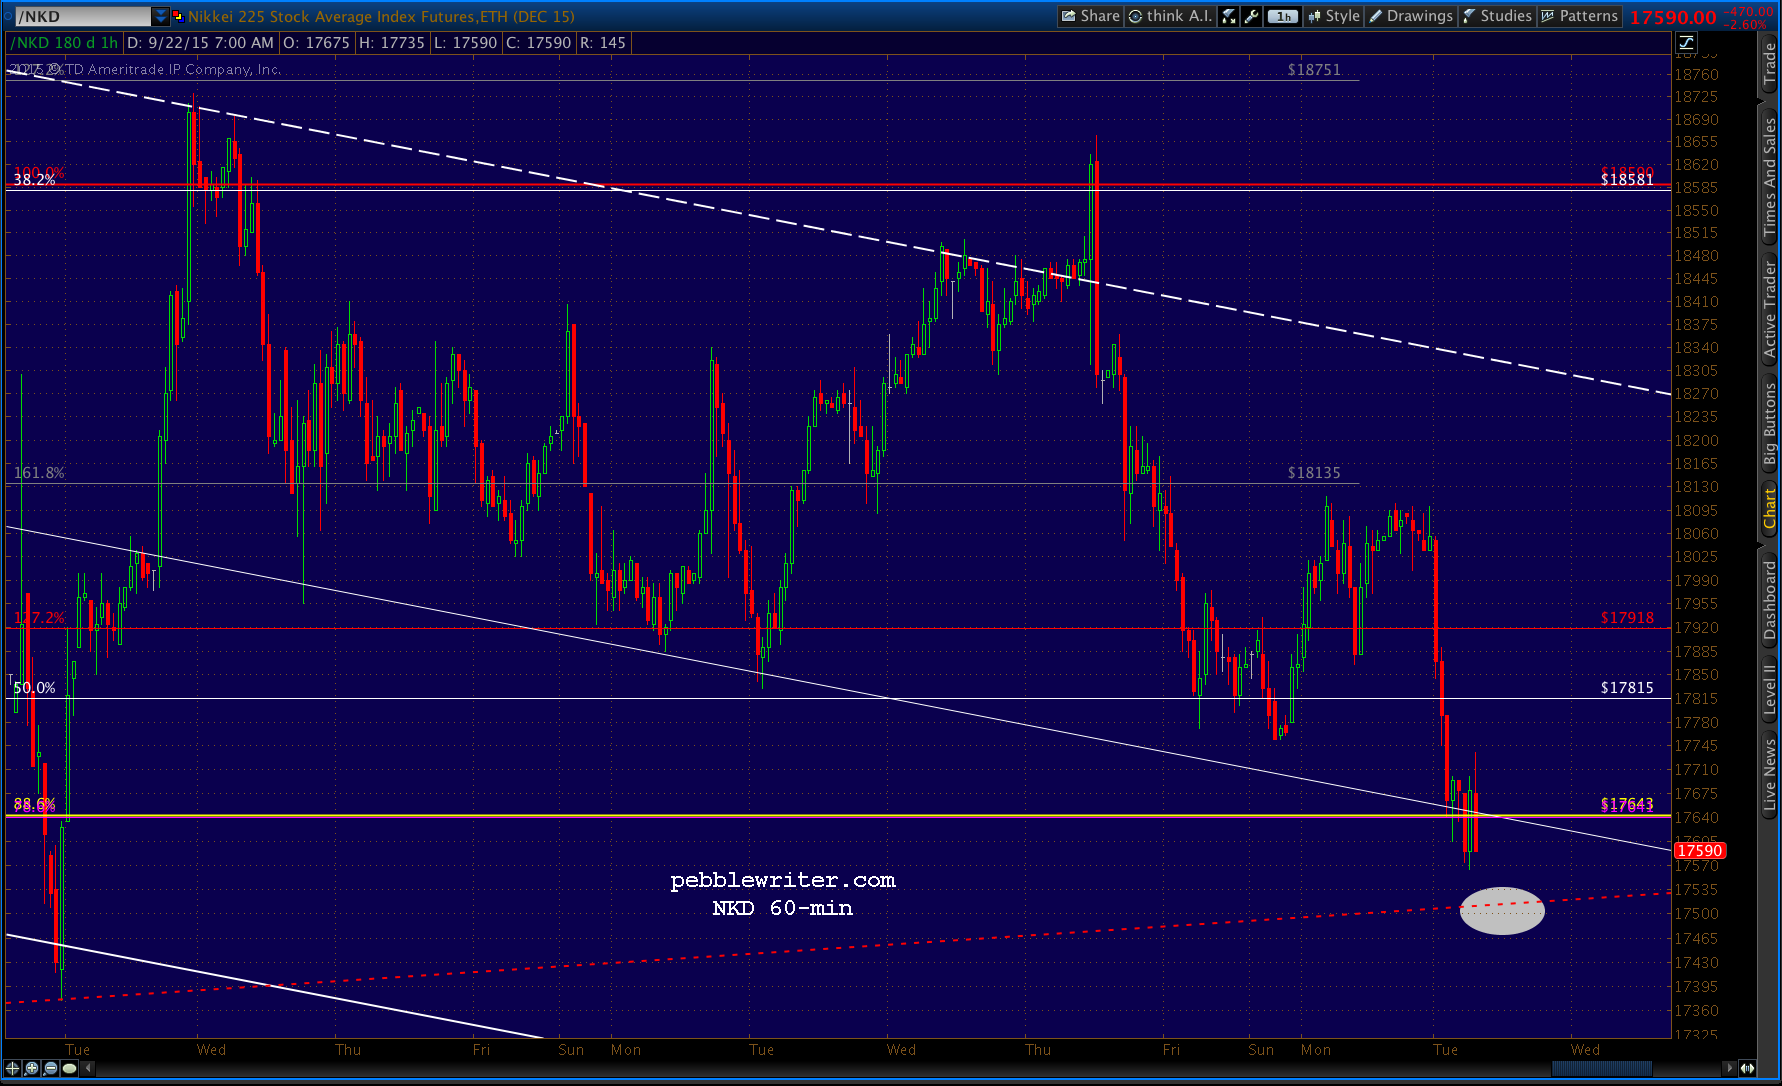
 I don’t know exactly where SPX will be when NKD tags its target (ideally between 11:20-11:30AM) but there should be a sizable bounce there in SPX, NKD and USDJPY. If not, there’s much more downside — with the proviso that 17,000 should offer excellent support.
UPDATE: 11:28 AM
A break below this TL on USDJPY ought to do it…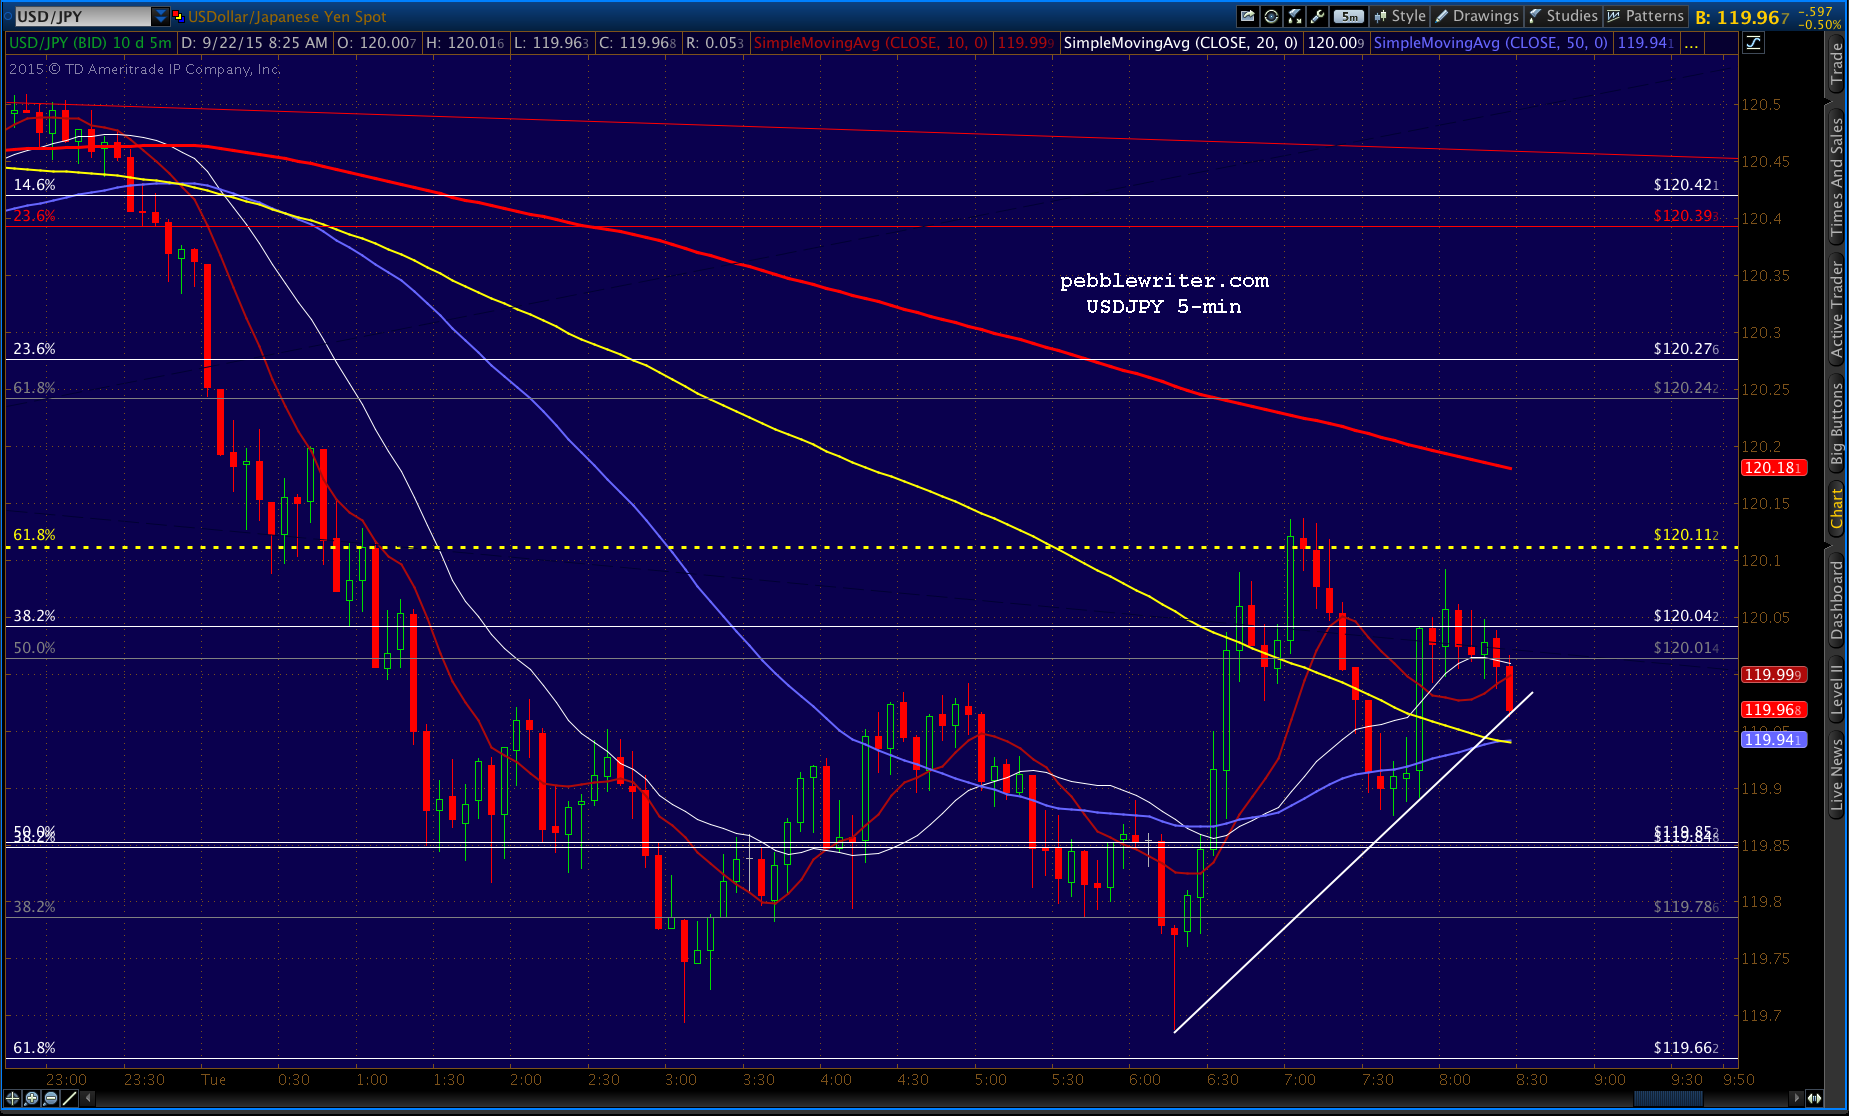 UPDATE: 11:39 AM
I suppose that particular USDJPY dip would have been too obvious. Chalk one up for the head fake department. Still waiting…

UPDATE: 1:00 PM
NKD just tagged 17,525…and we’re seeing a reaction from USDJPY. Is it the bottom? Hard to say. My best guess is that we’re a little early.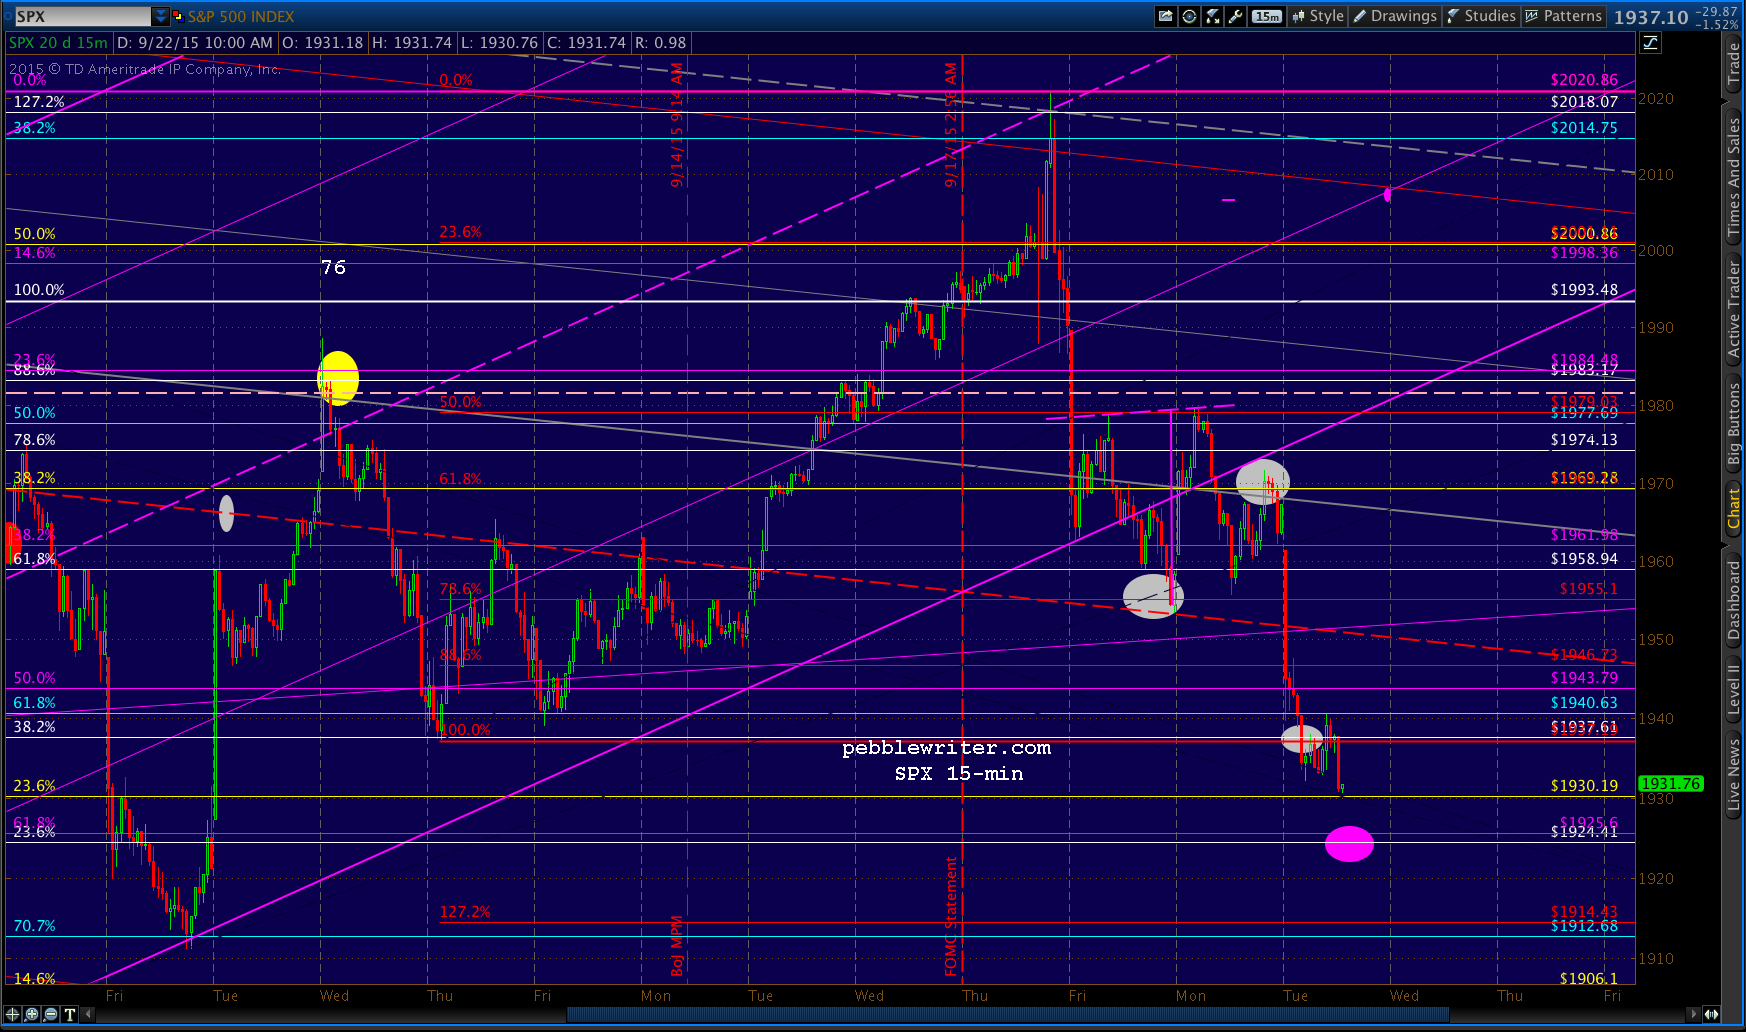
No way to know the timing on that. So, tight stops make a good deal of sense — but, based on NKD/USDJPY, not the squiggles of ES or SPX. Here’s updated charts on each.
USDJPY would look better with a tag of that yellow SMA100. I’d be quick to switch back to short if USDJPY falls back below the purple line. And, NKD looks like it jumped the gun a little early.
 UPDATE: 1:12 PM
 I’d also like to see TNX fully backtest the purple channel top.
 UPDATE: 1:29 PM
 NKD tagged 17505…
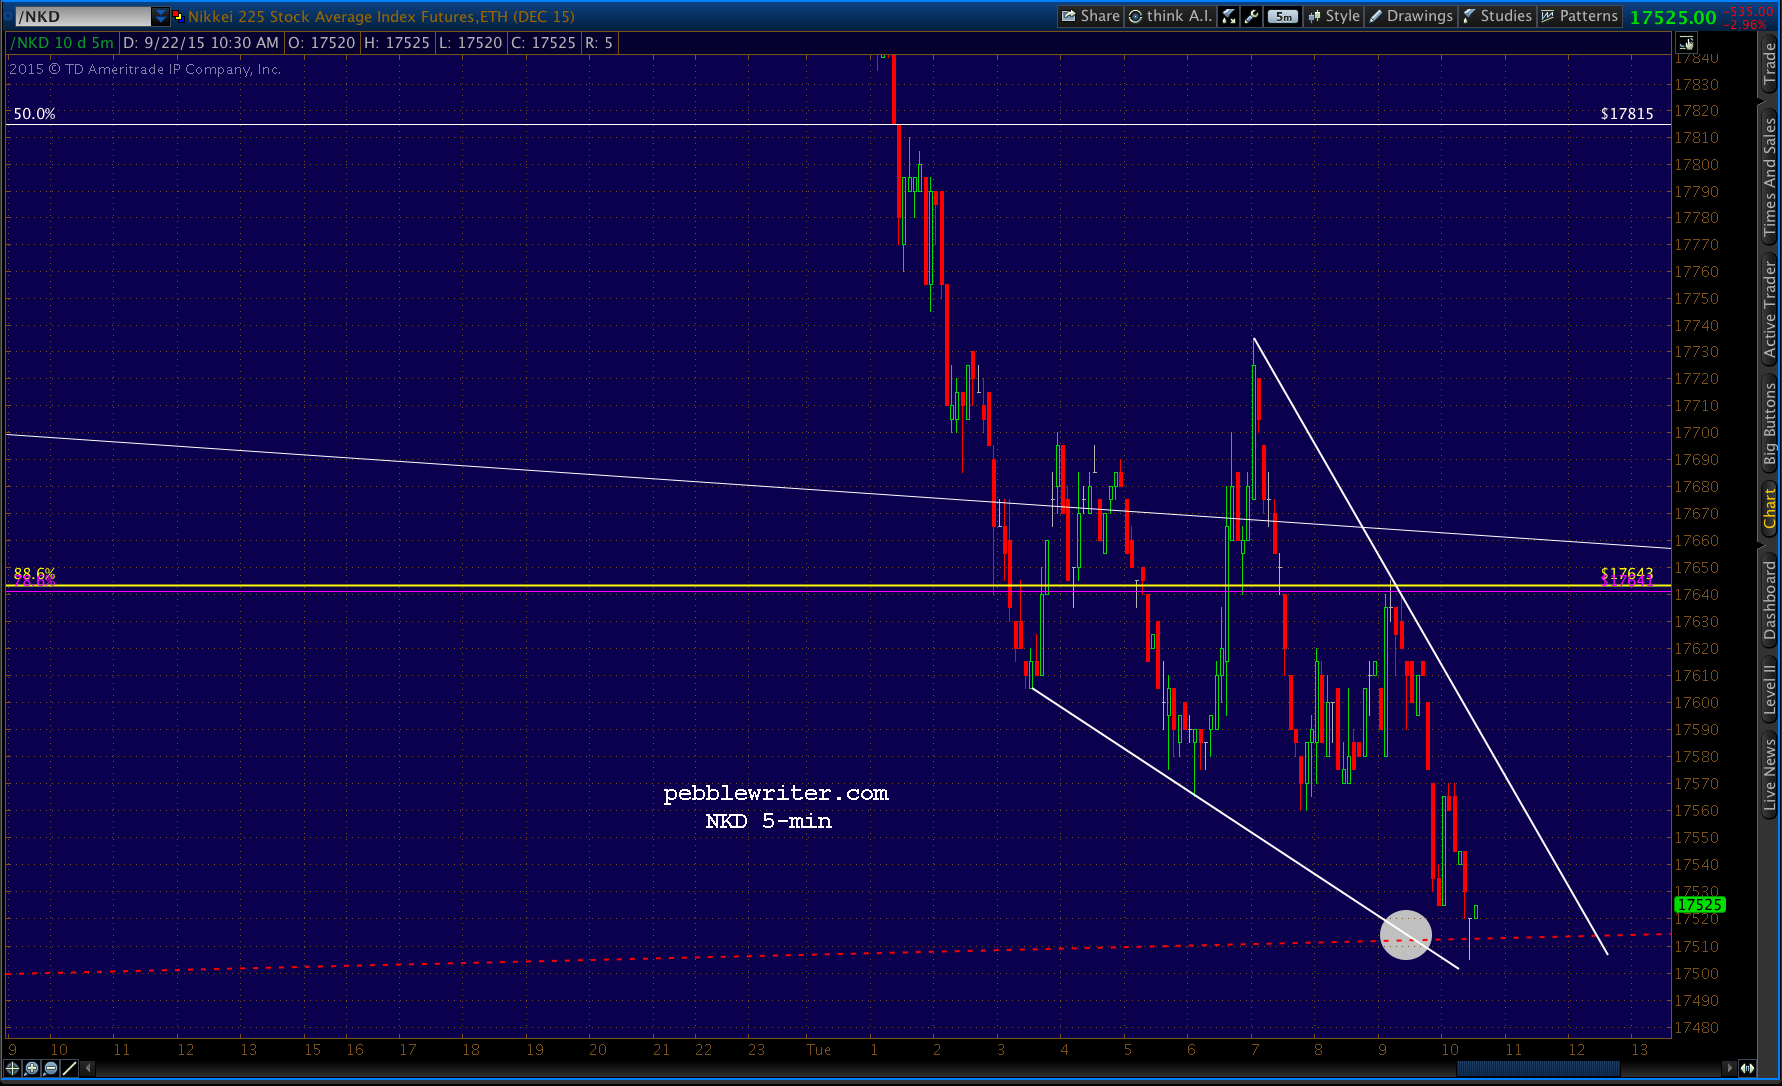 … and USDJPY tagged a couple of nice Fibs.
 If it gets going, SPX should retest the red channel midline (1950ish), and if it exceeds that, the broken purple channel bottom around 1980. But, tight stops are advised as the best effect would come from a continuing NKD meltdown.
UPDATE: 3:41 PM
SPX just tagged a TL connecting the tops since Sep 17 as USDJPY reached the 120.11 Fib. Probably not a bad place to take profits unless you intend to hold overnight — which is always a risk unless you can hedge your position. It gets trickier from here on out, with several indicators flashing a downturn. e.g., SPX’s purple channel is obviously still broken. One indicator that we looked at earlier is CL, which has rejoined the rising red channel but not broken above a little TL from two weeks ago.
 USDJPY:
Bottom line, be cautious. And, if you can’t hedge, take profits and see what develops overnight.
GLTA.