RBOB reached our 1.75 target forecast from last year. As we have discussed many times over the past year, the administration’s emphasis on drilling, OPEC’s deference to Trump, and a slowing global economy have enabled a substantial drop over the last 3 1/2 years.
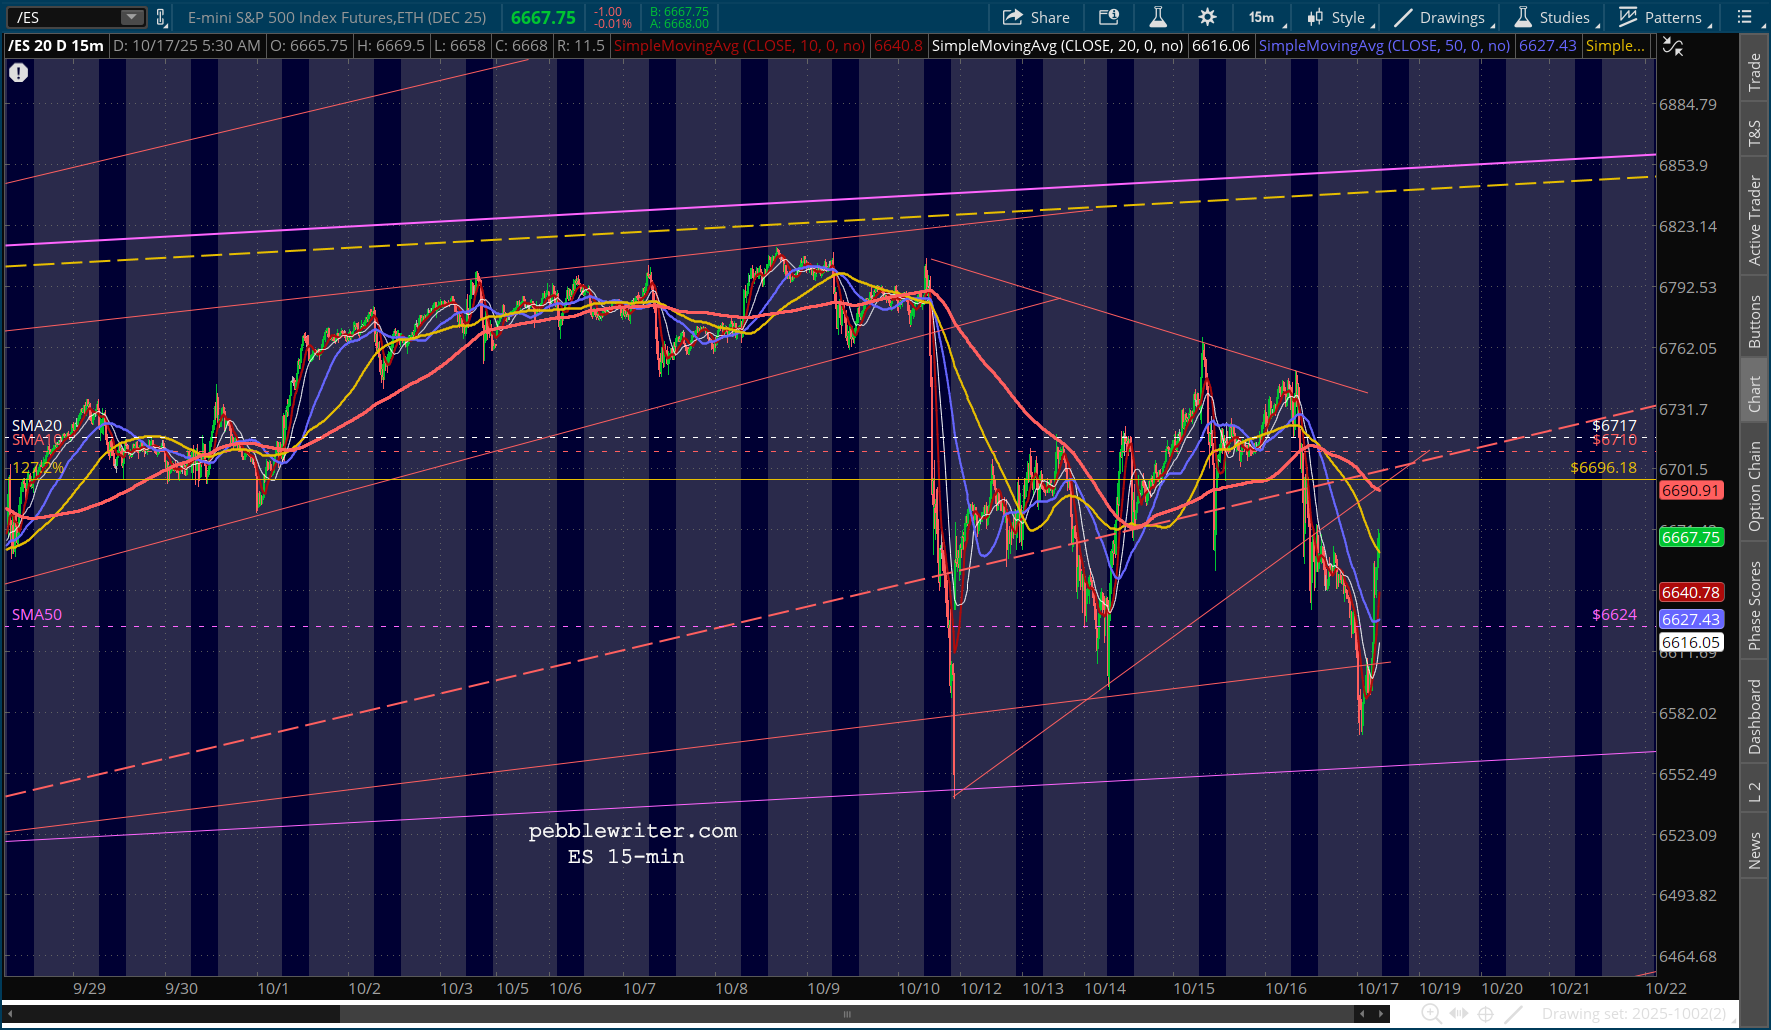
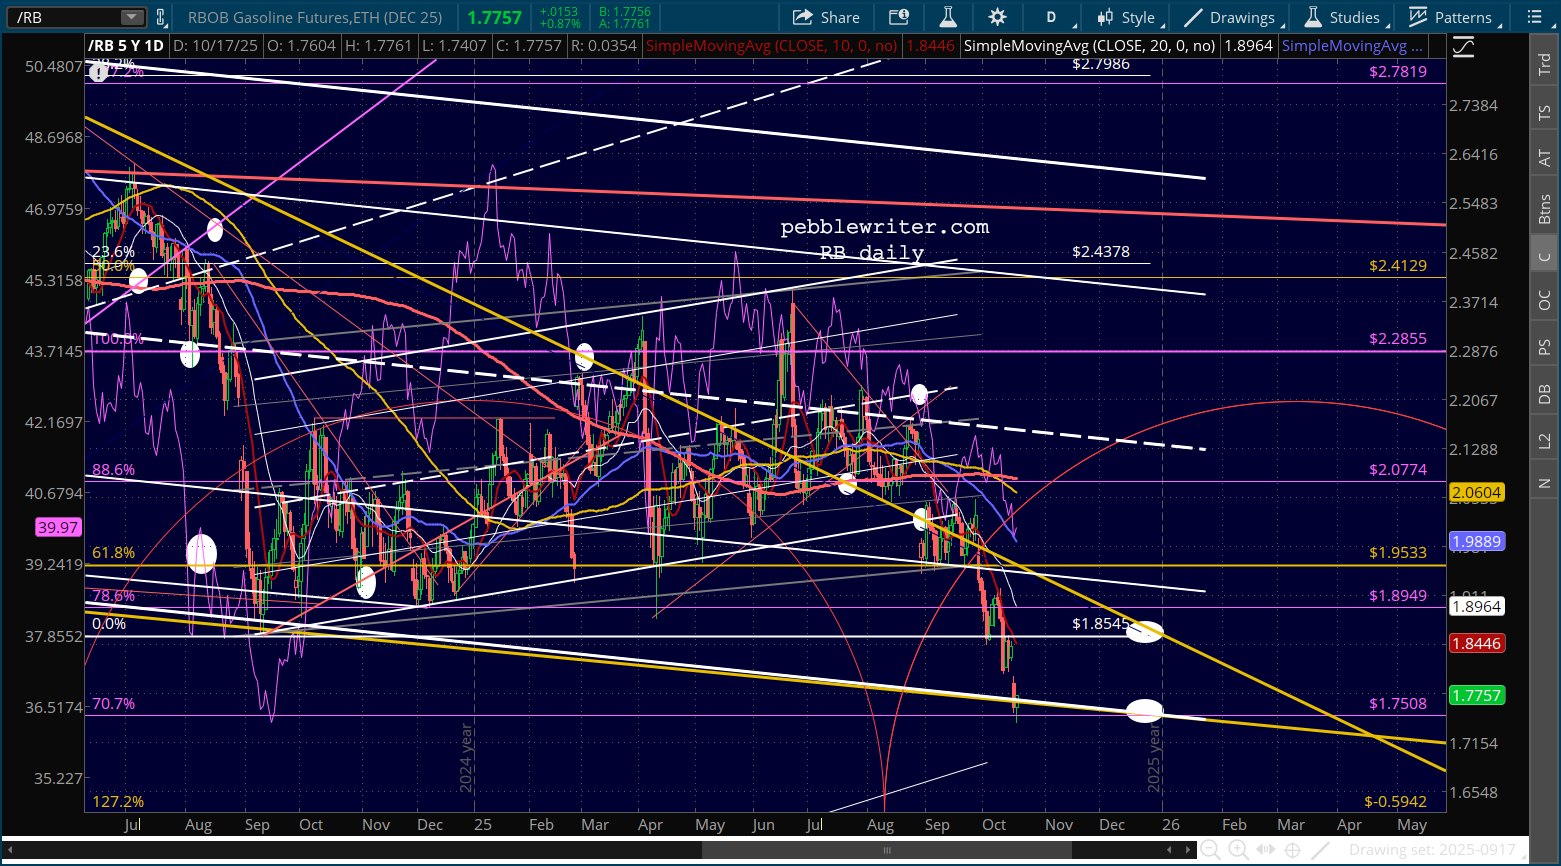 As is often the case, we have to pay as much attention to Trump’s latest social media posts as to actual economic data. Yesterday’s sharp selloff continued overnight but was “corrected” by another TACO missive on China tariffs. The 50-day moving average was saved again.
Trump said on Friday his proposed 100% tariff on goods from China would not be sustainable, adding that he would meet with Chinese President Xi Jinping in two weeks and that he thought things would be fine with China.”It’s not sustainable, but that’s what the number is,” Trump said in an interview with Fox Business Network. “They forced me to do that.”
continued for members...
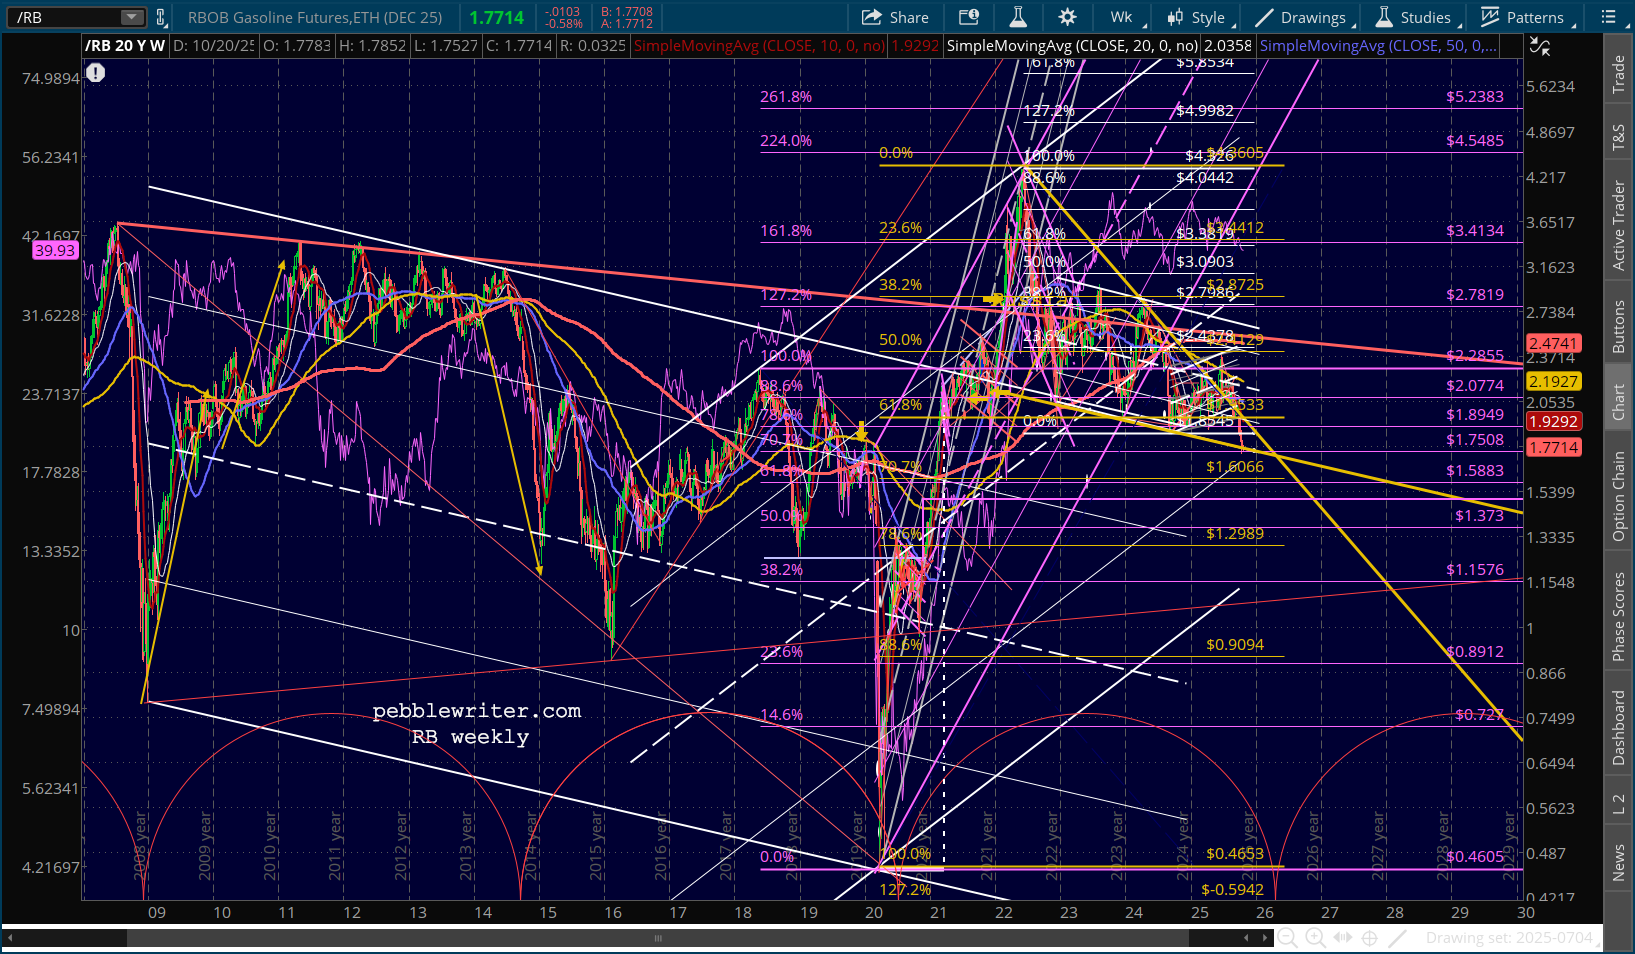
I find it very interesting that this sharp downturn in RB is backtesting the yellow channel top at the same time as the cycle low.
 The daily CL chart…
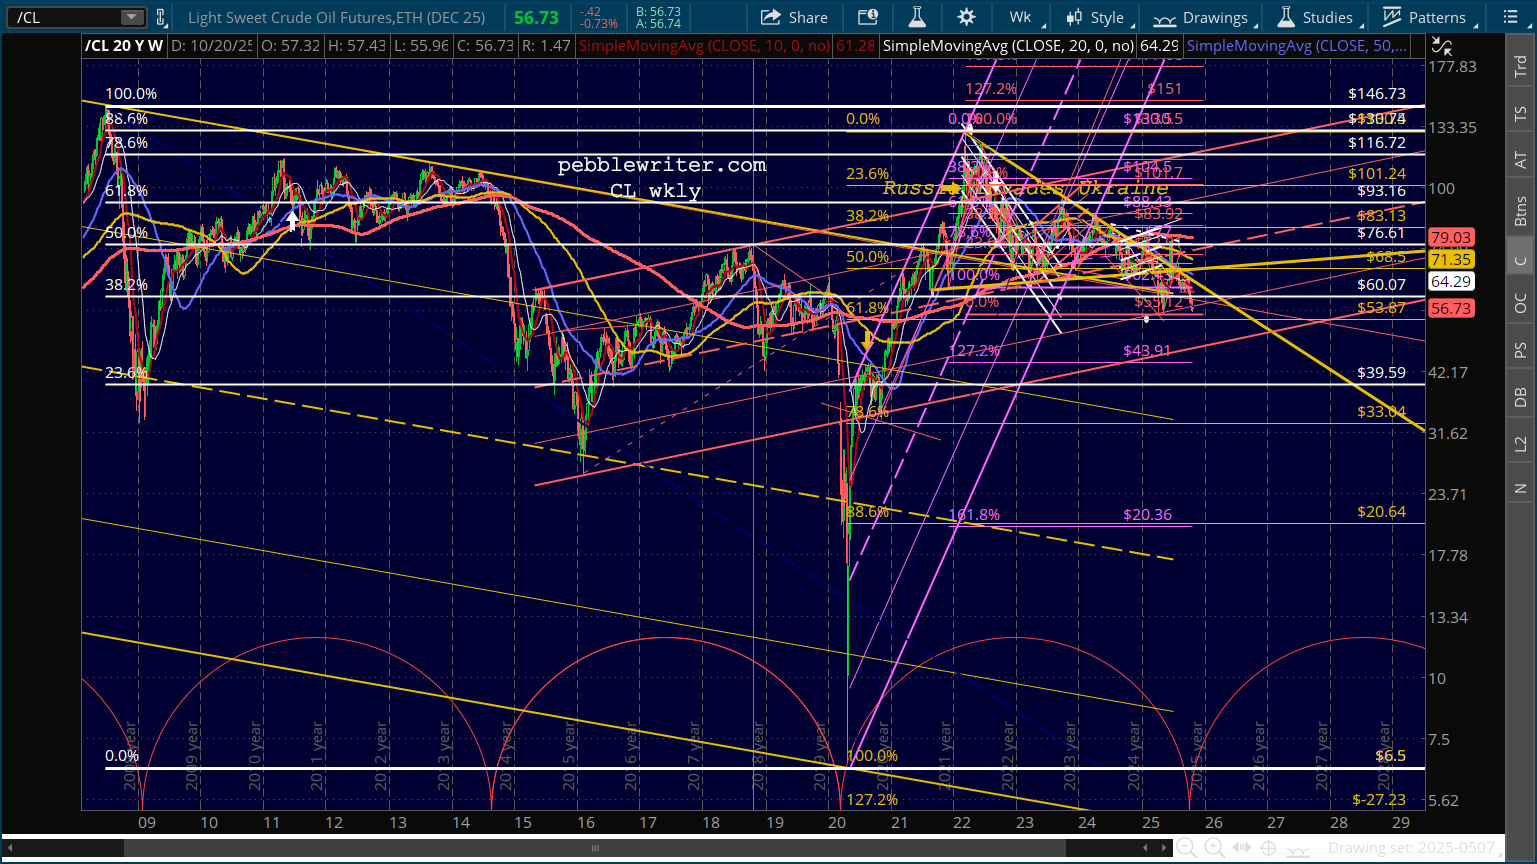
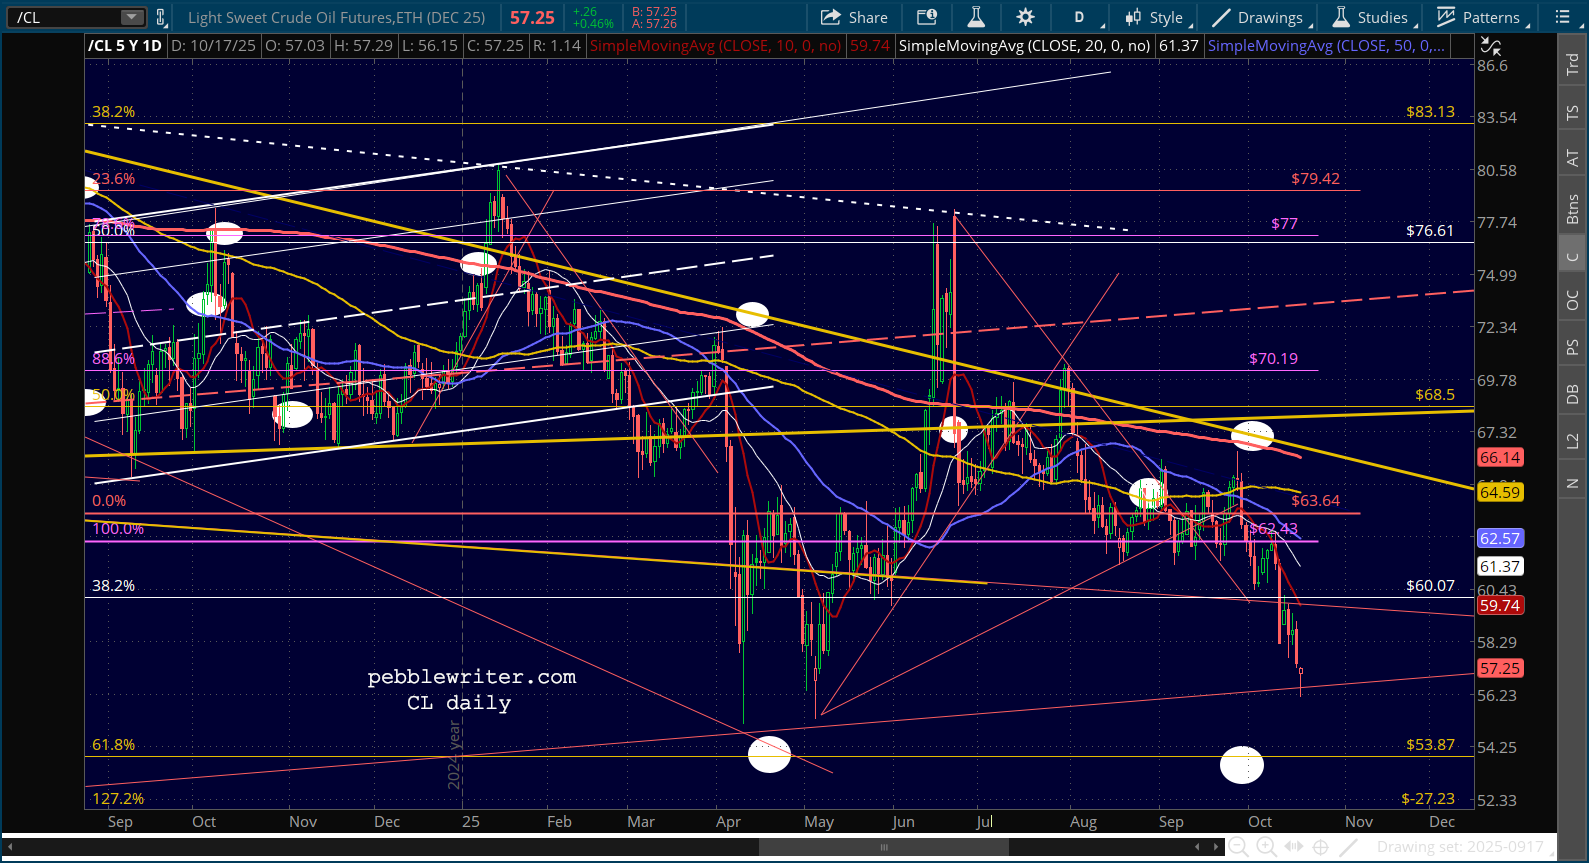 .…and the weekly chart showing the same backtest/cycle adherence as RB.
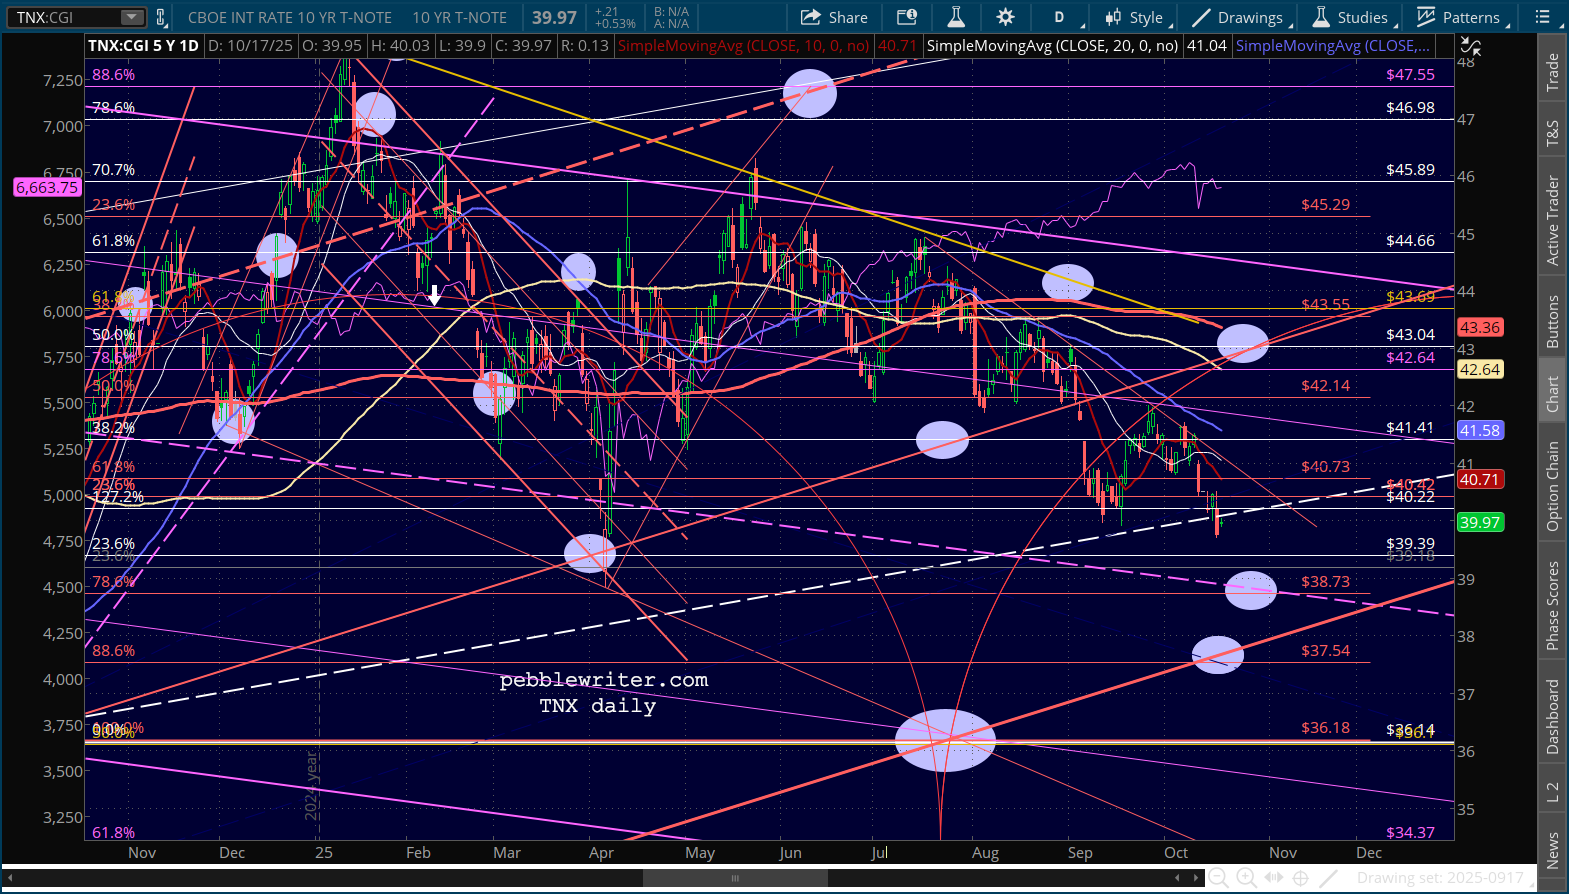
 This is interesting as the correlation between oil/gas and 10Y is stretched. Will oil/gas prices bounce, restoring the correlation, or will the 10Y bounce?
Without a breakdown in RB/CL, inflation would be pressured higher and the 10Y would rebound, It would be a very tough headwind for equities.
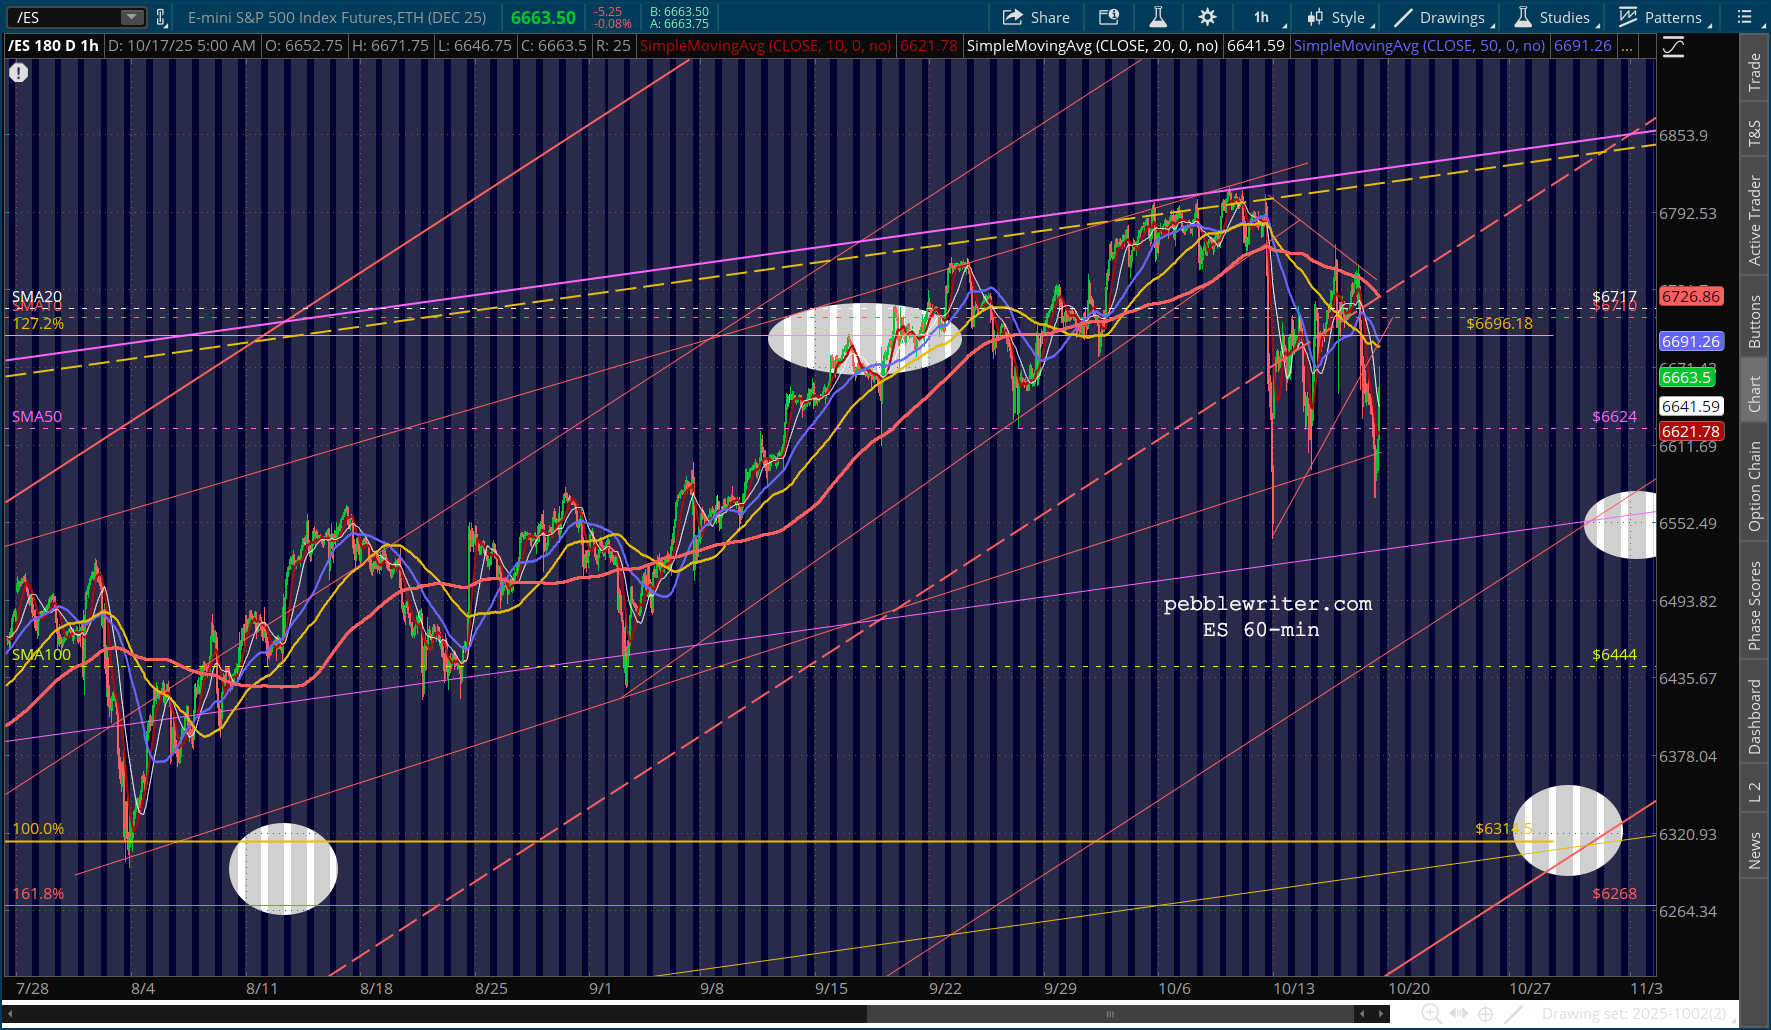
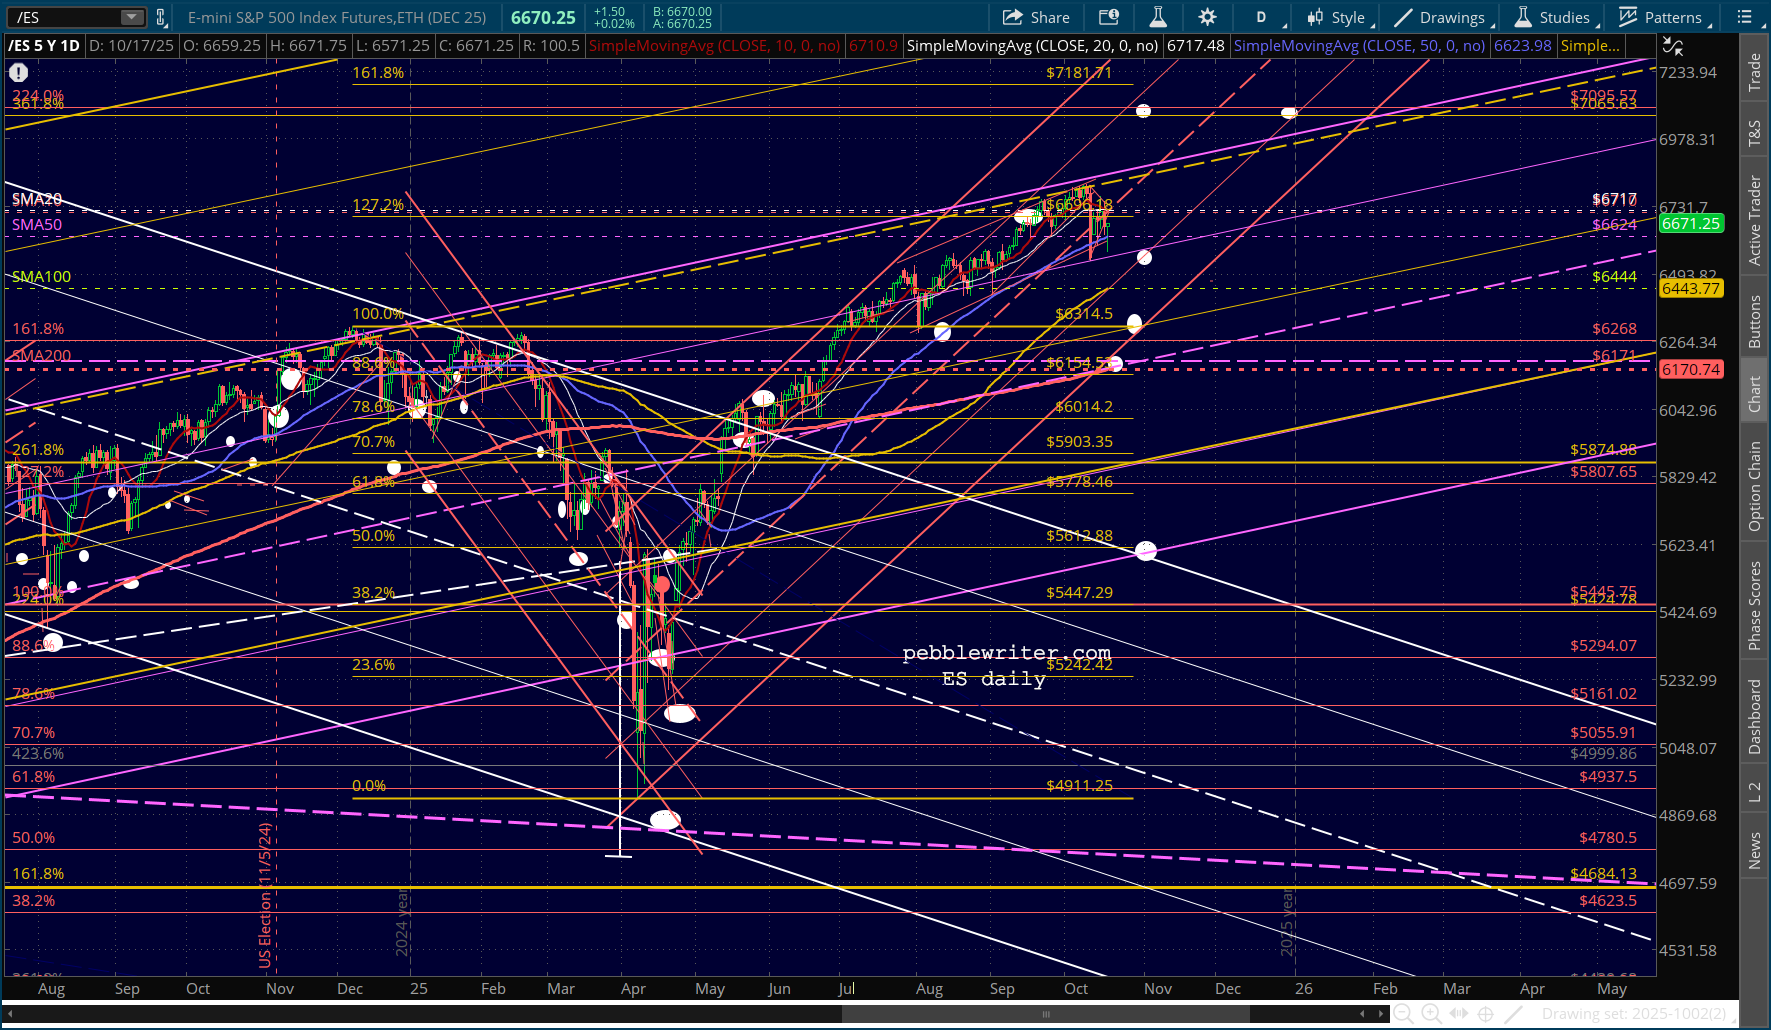
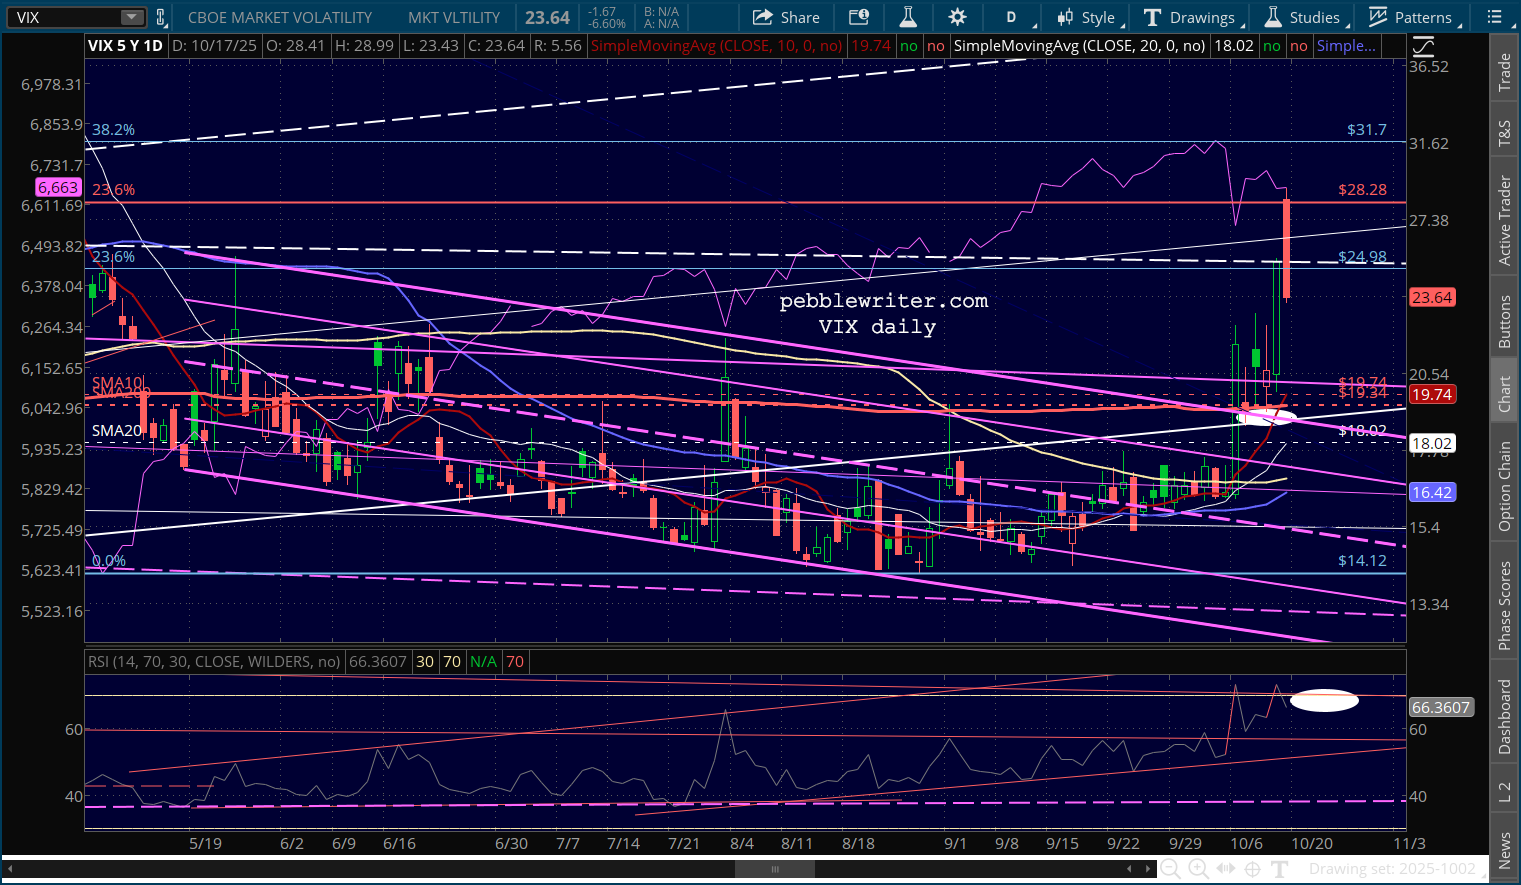
The rest of today’s charts show a sharp rebound in the last two hours based on Trump backtracking on China tariffs.