

RBOB came within .0045 of our next downside target this morning – an 8.4% gain for those who shorted on July 27. For those satisfied with the easy money, 2.002 is as good a place to get out as any.
For those willing to roll the dice just a bit, there is more downside potential as the 200-DMA is drawing tantalizingly close.

From the post Q2 GDP: July 27, 2018:
RB continues to inch higher, breaking through the TL but reaching channel and Fib resistance. The falling gray channel top should provide solid resistance if RB can break 2.18.
However, note that RB is already at the upper bound of the range established in June. Given that it just bounced at horizontal support, I suspect it’ll reverse here at horizontal resistance.

July inflation is already in the books. This morning’s PPI (+3.3% YoY, 0.0% MoM) supports our view that CPI will come very close to 3%. As expected, oil and gas prices were important components.
continued for members…
The daily chart shows the appeal of the SMA200 target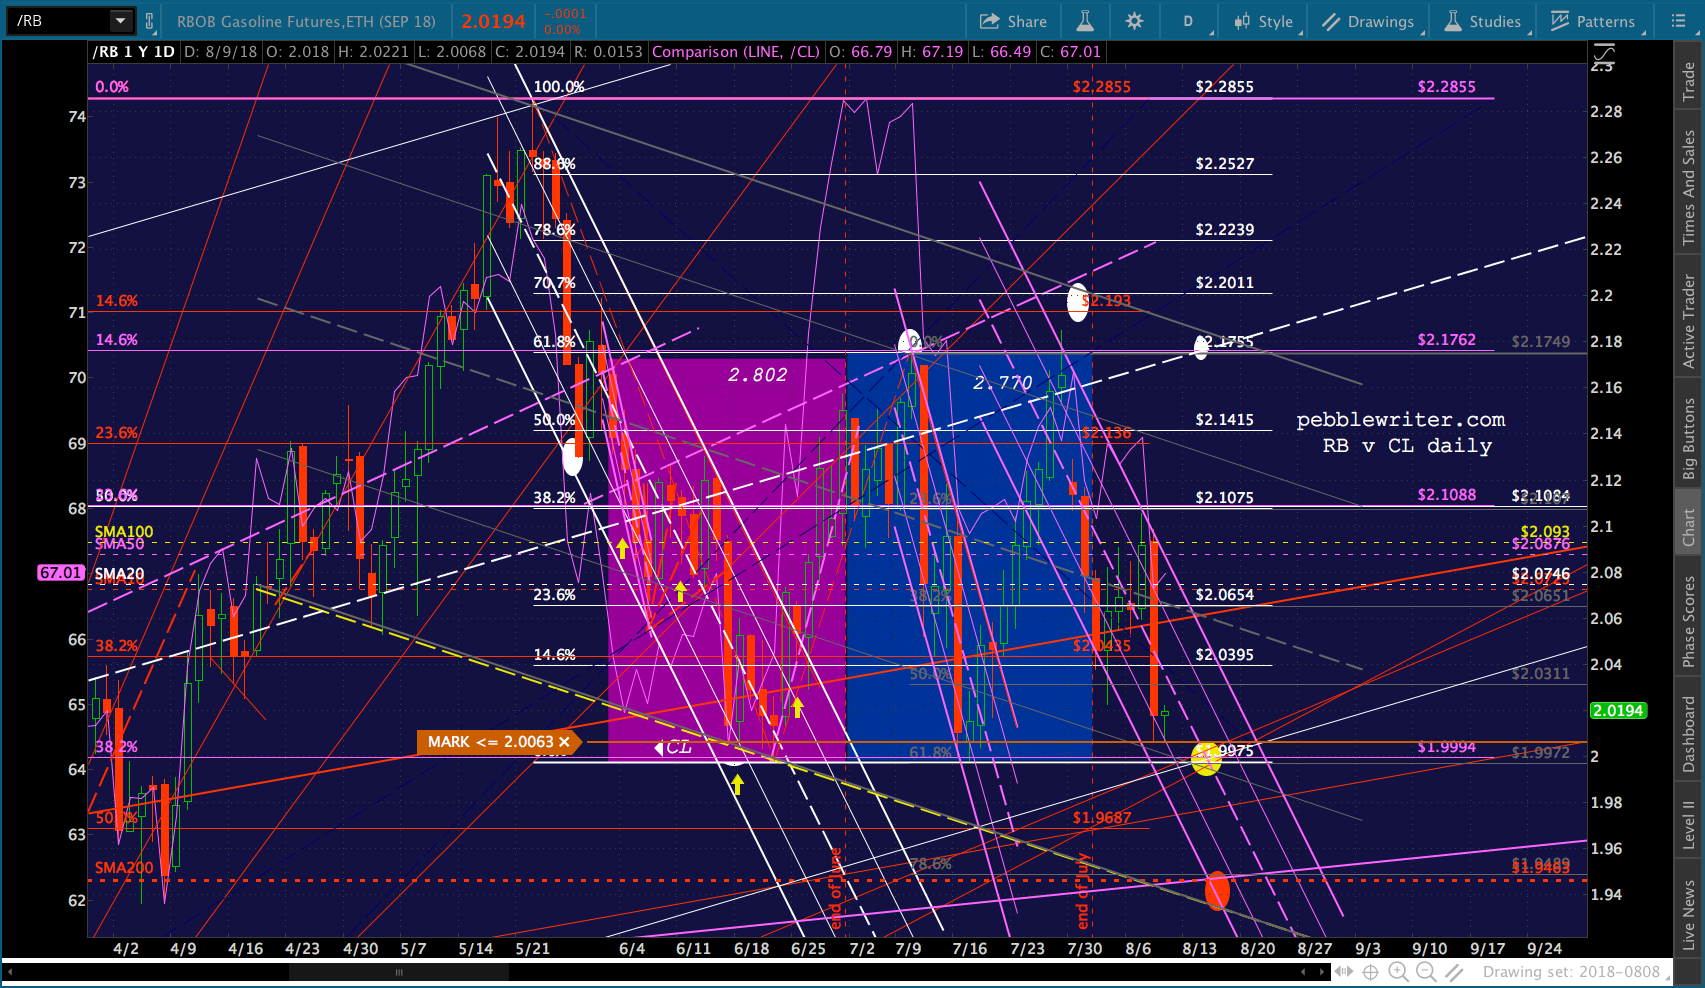
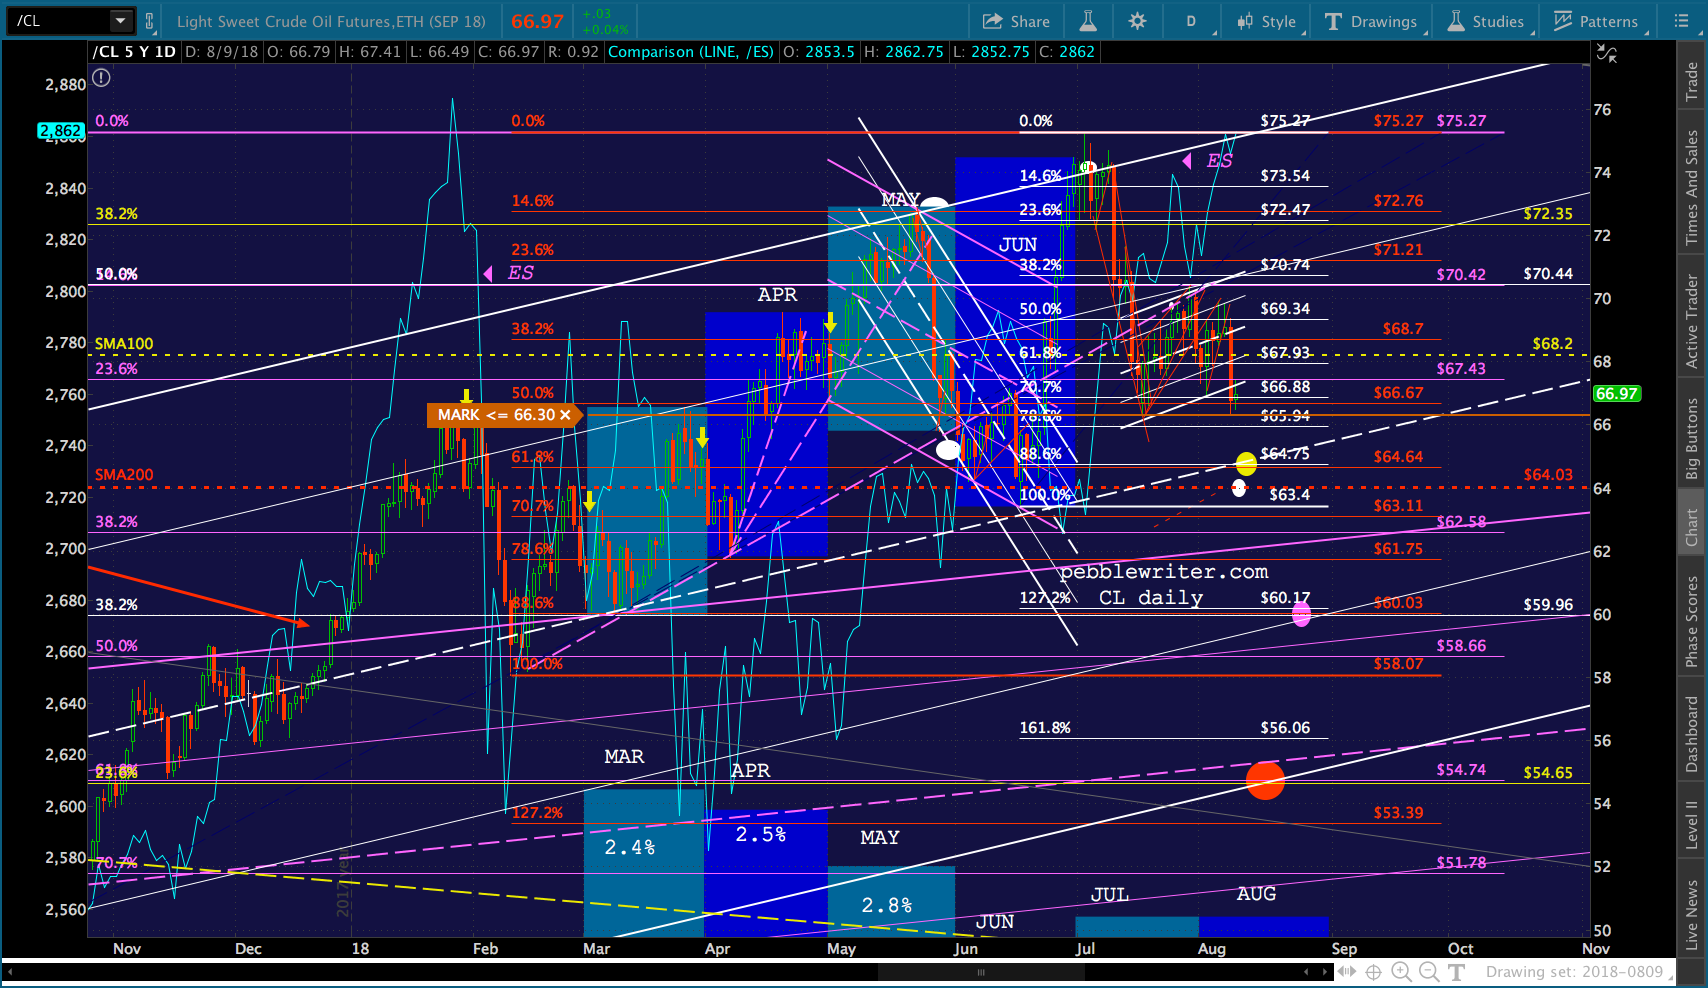
Note that CL also reached horizontal support, but seems even more susceptible to further decline when taking the recent flag pattern into account.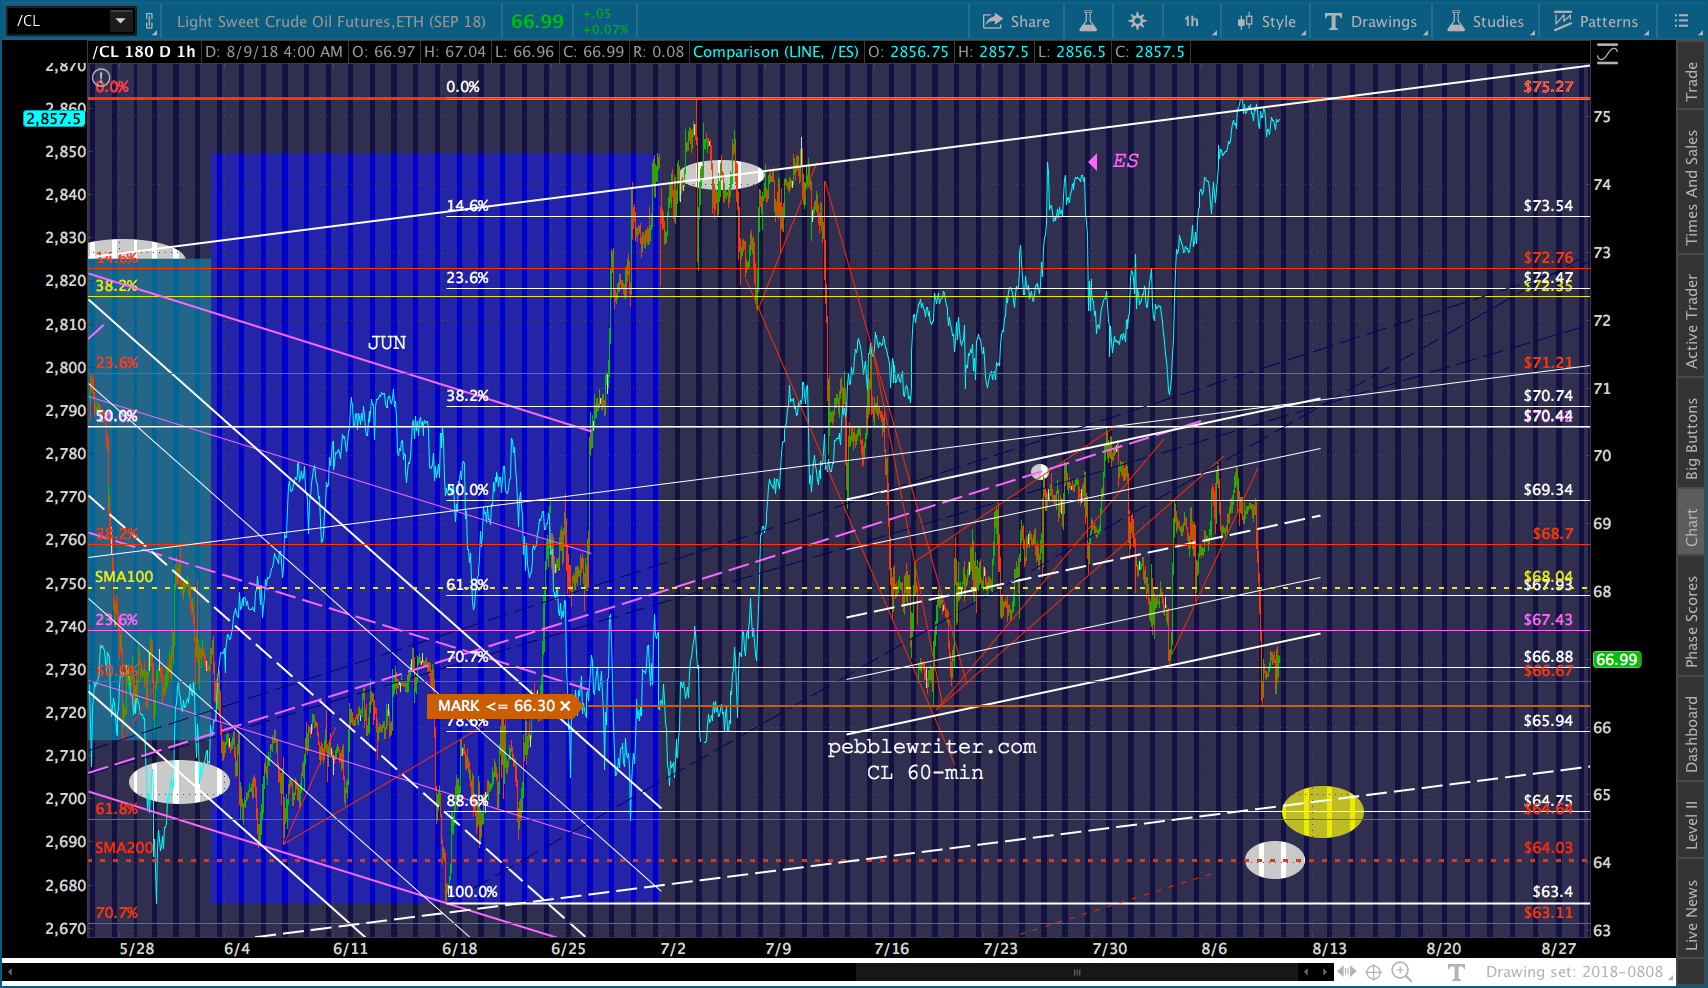 And, the Fib and channel picture is equally compelling.
 The rest of the cast is performing as expected this morning. VIX is making new lows…
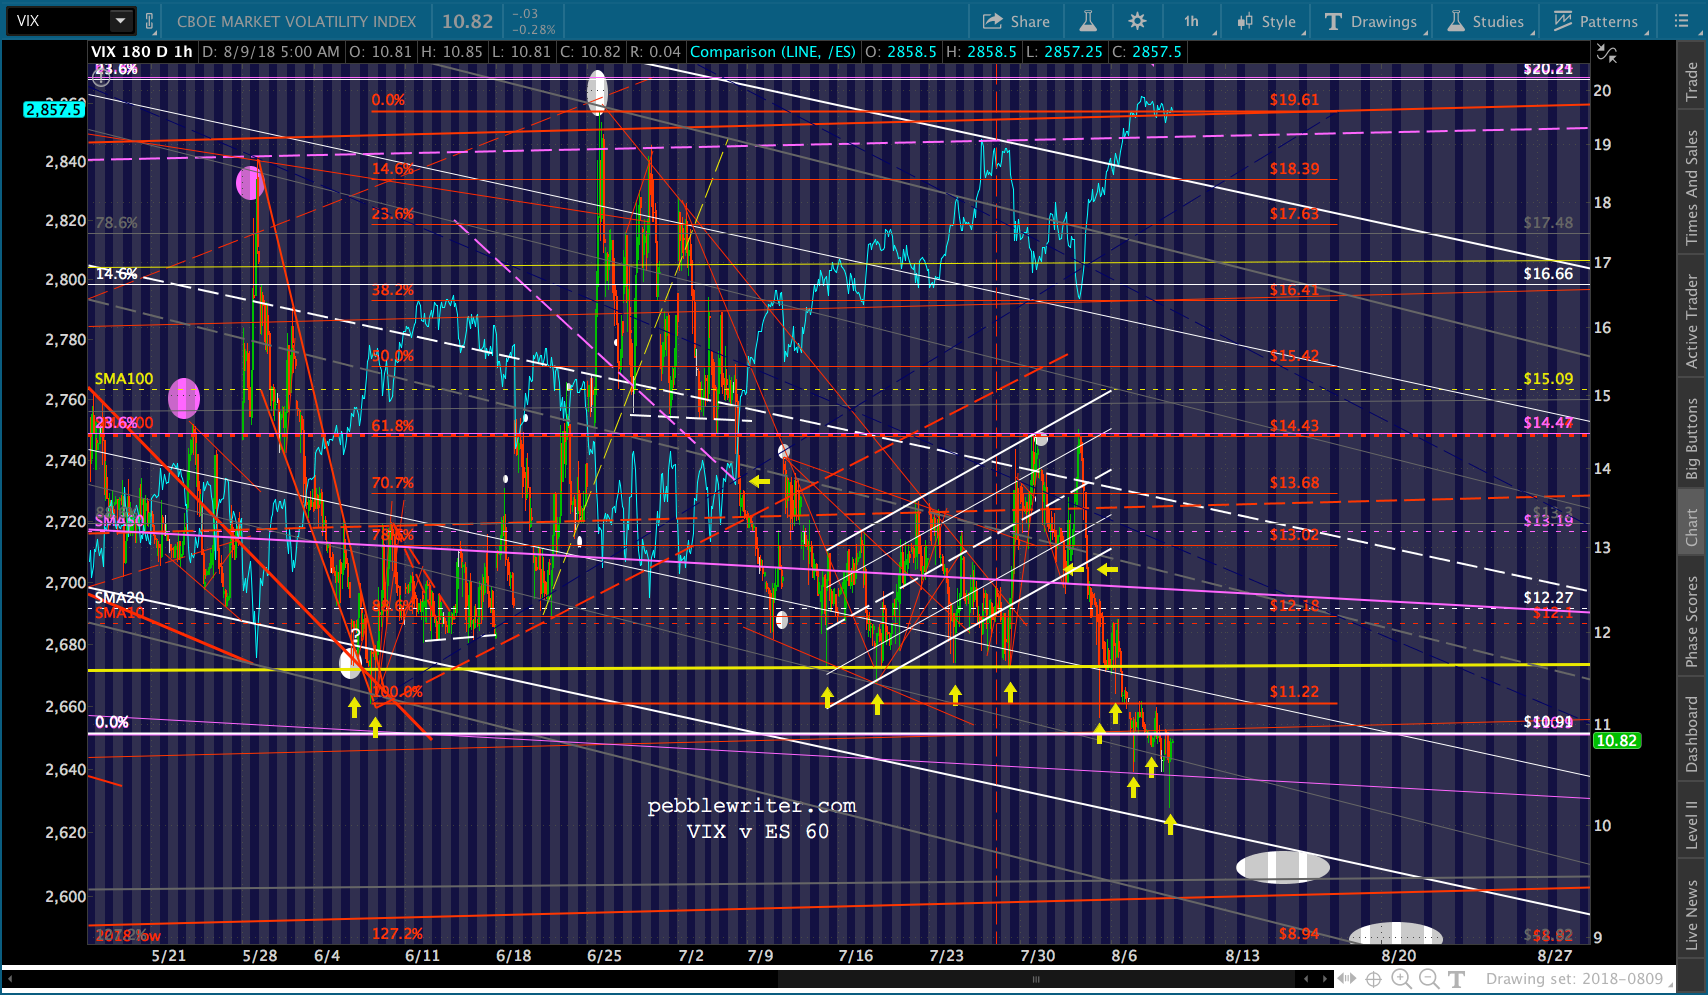 …which has kept futures in the green.
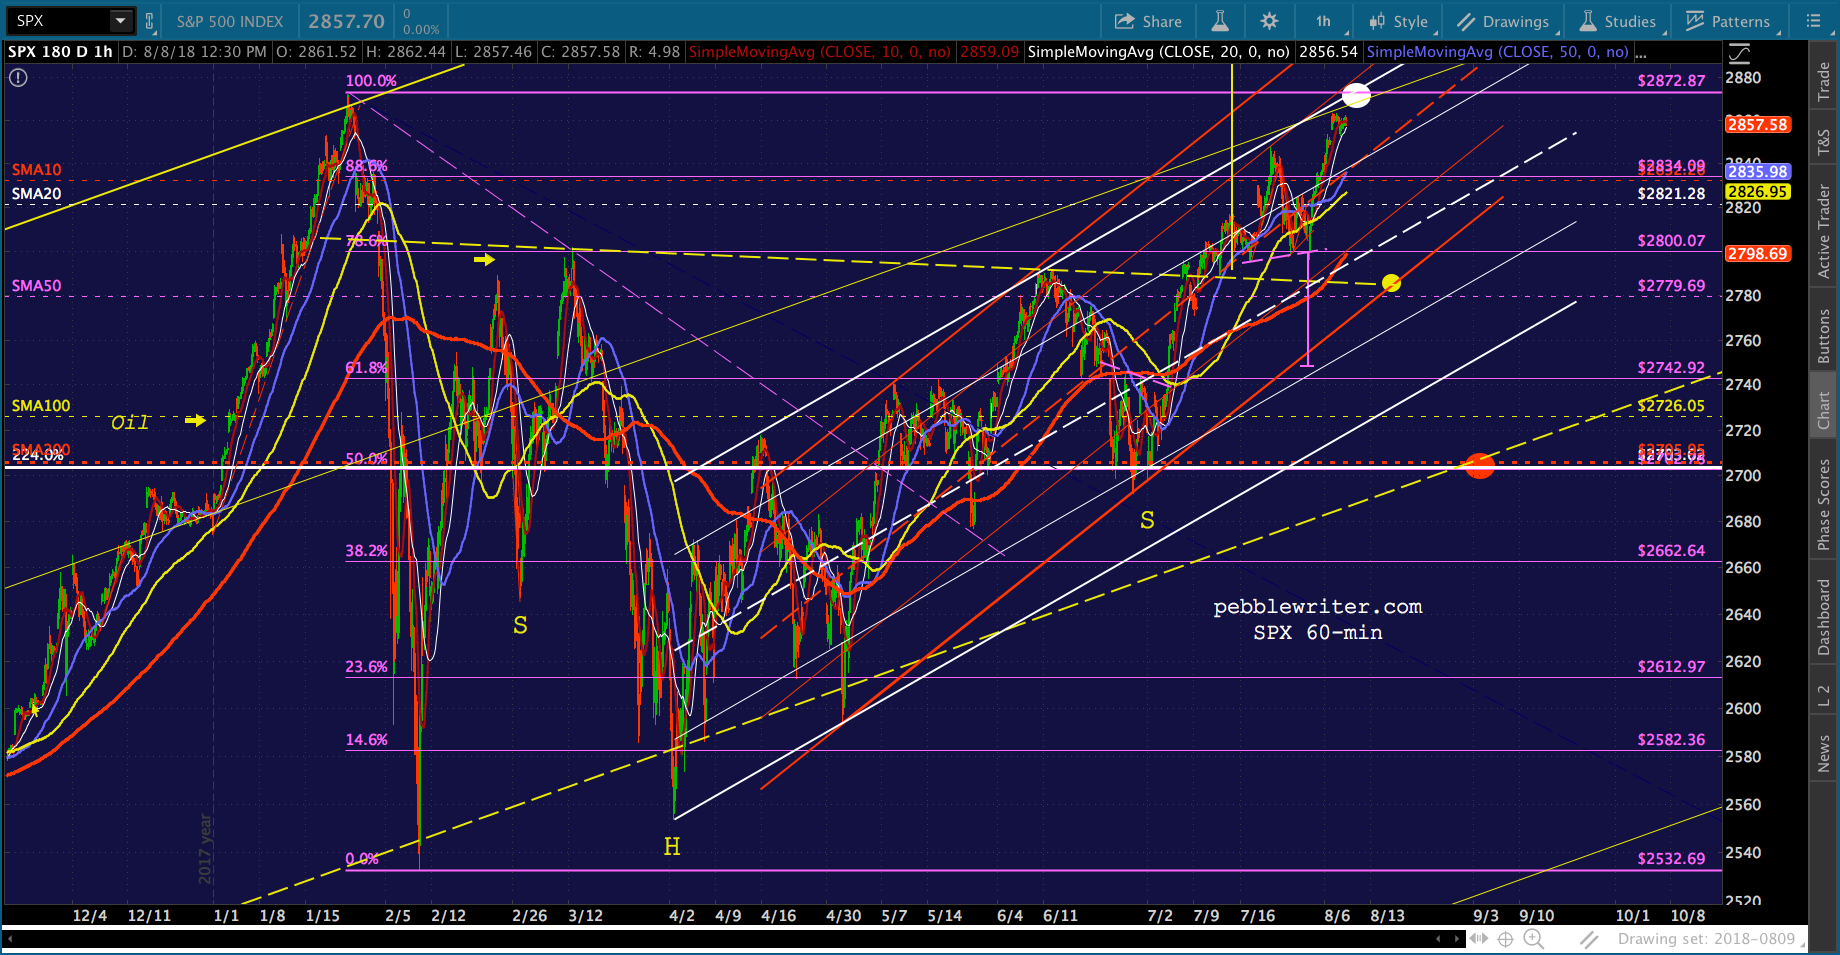
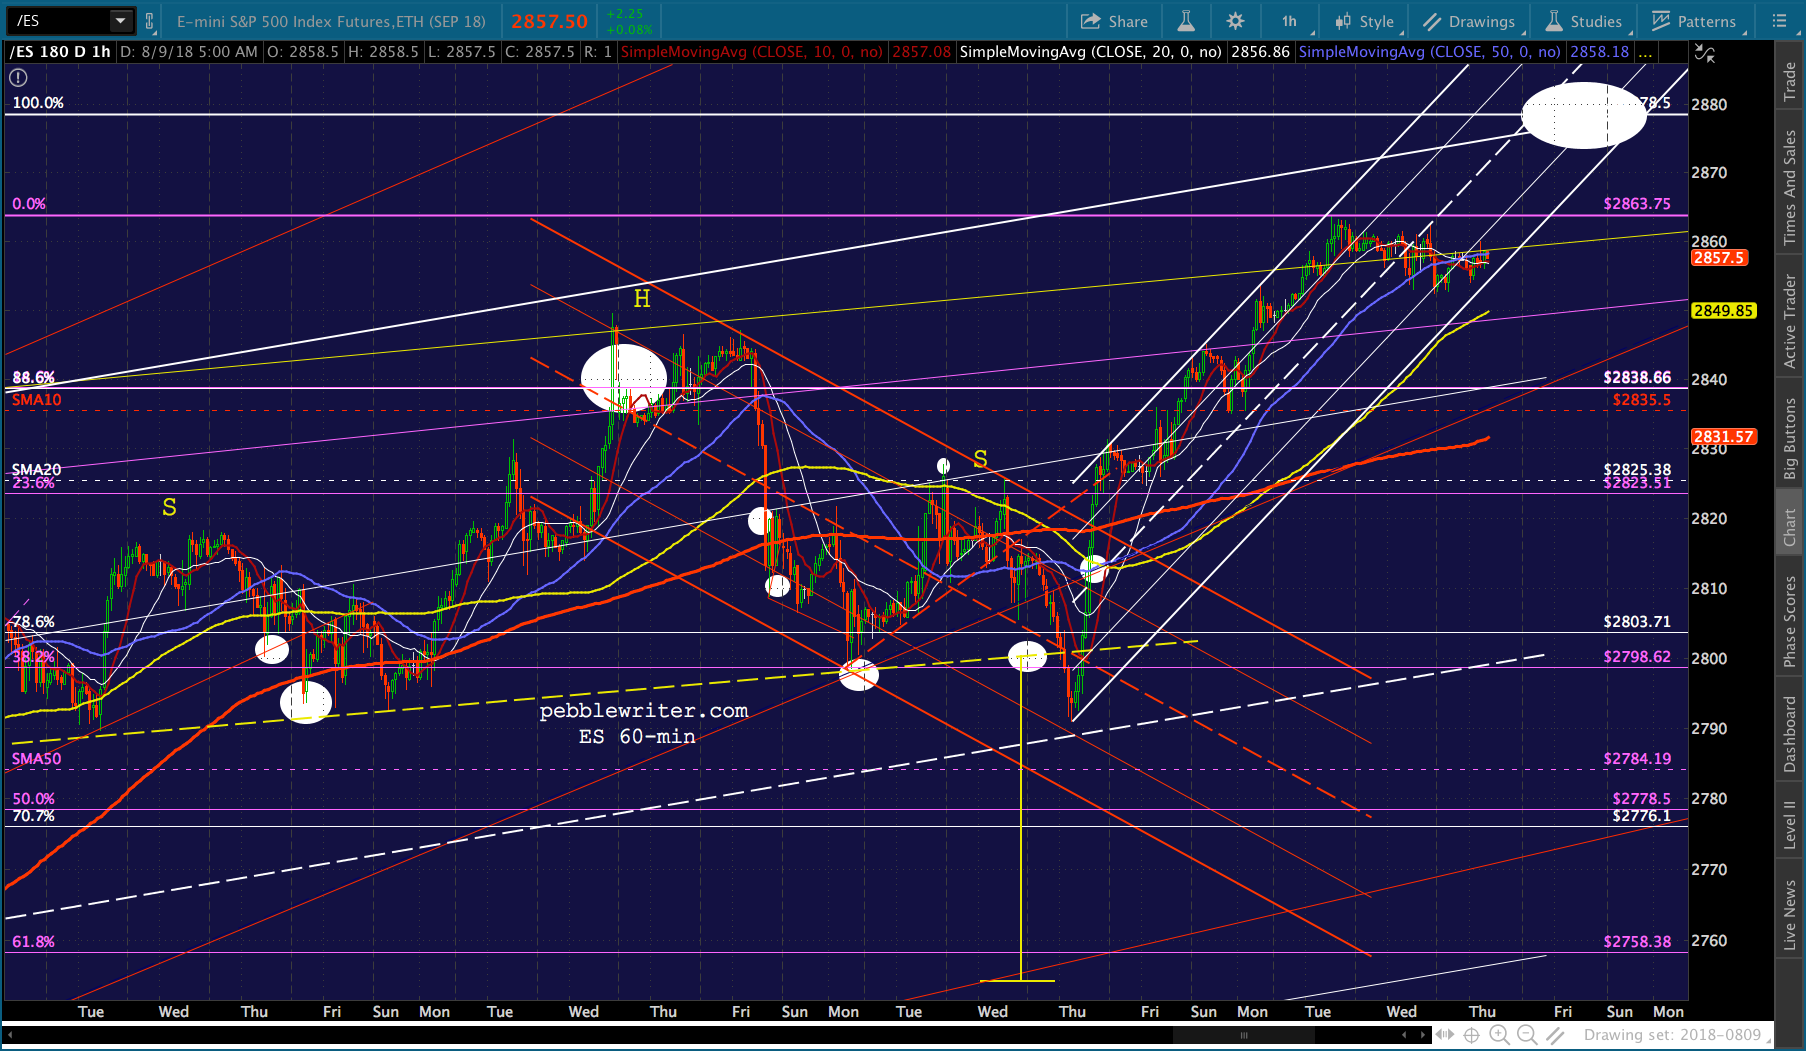 SPX remains within striking distance of new all-time highs.
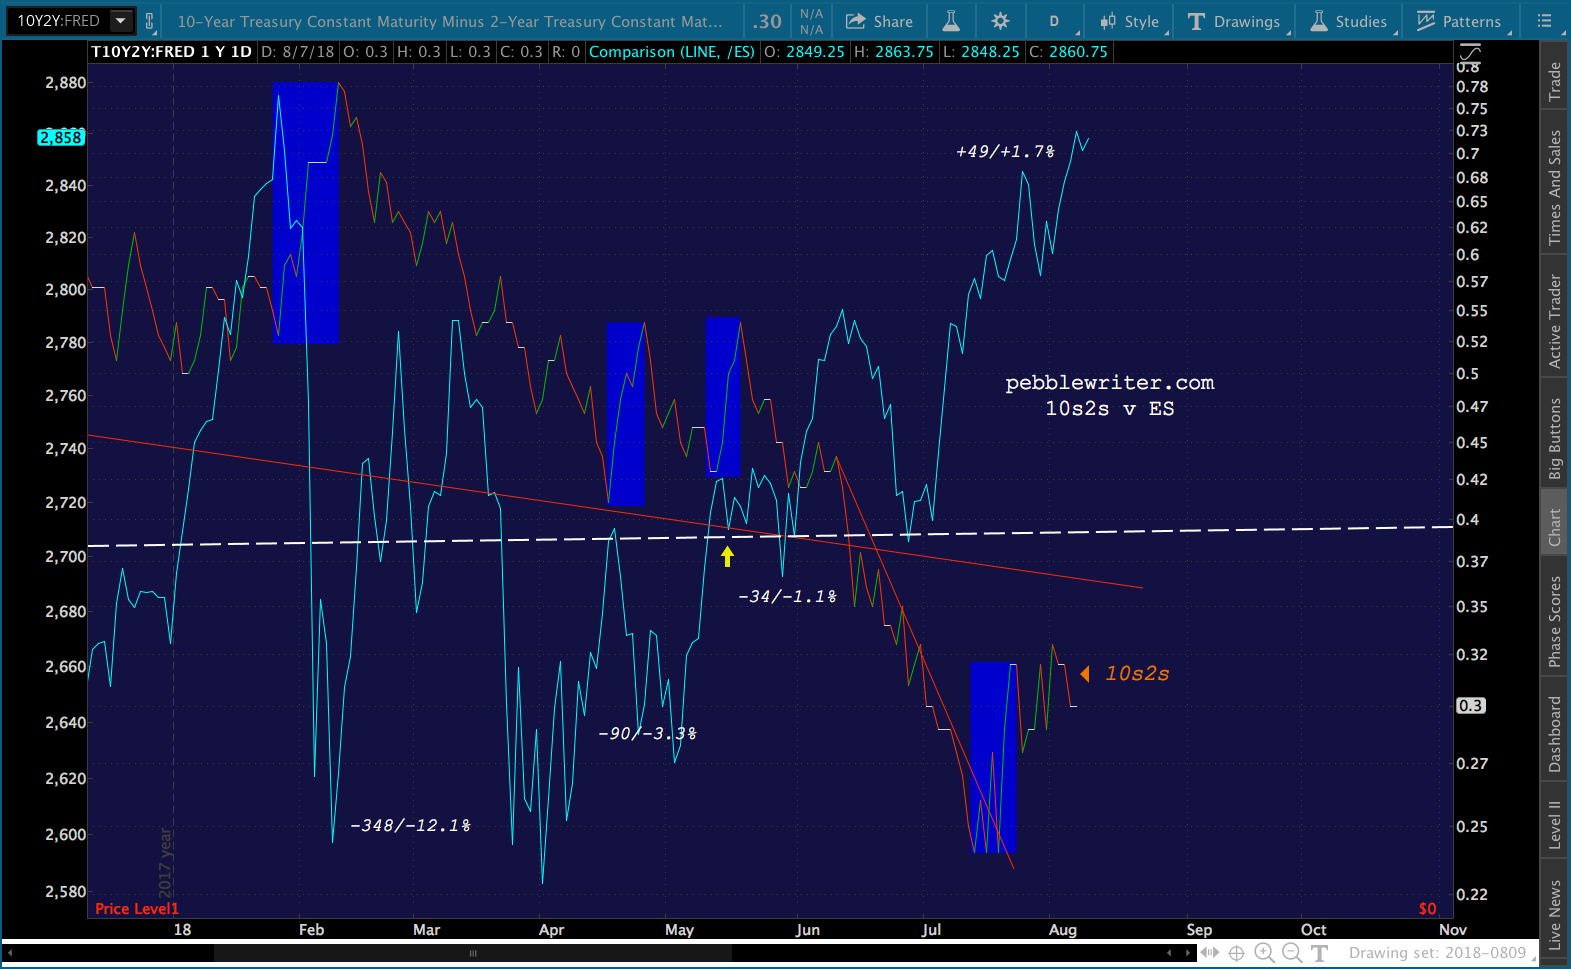
 And, the yield curve is declining again.
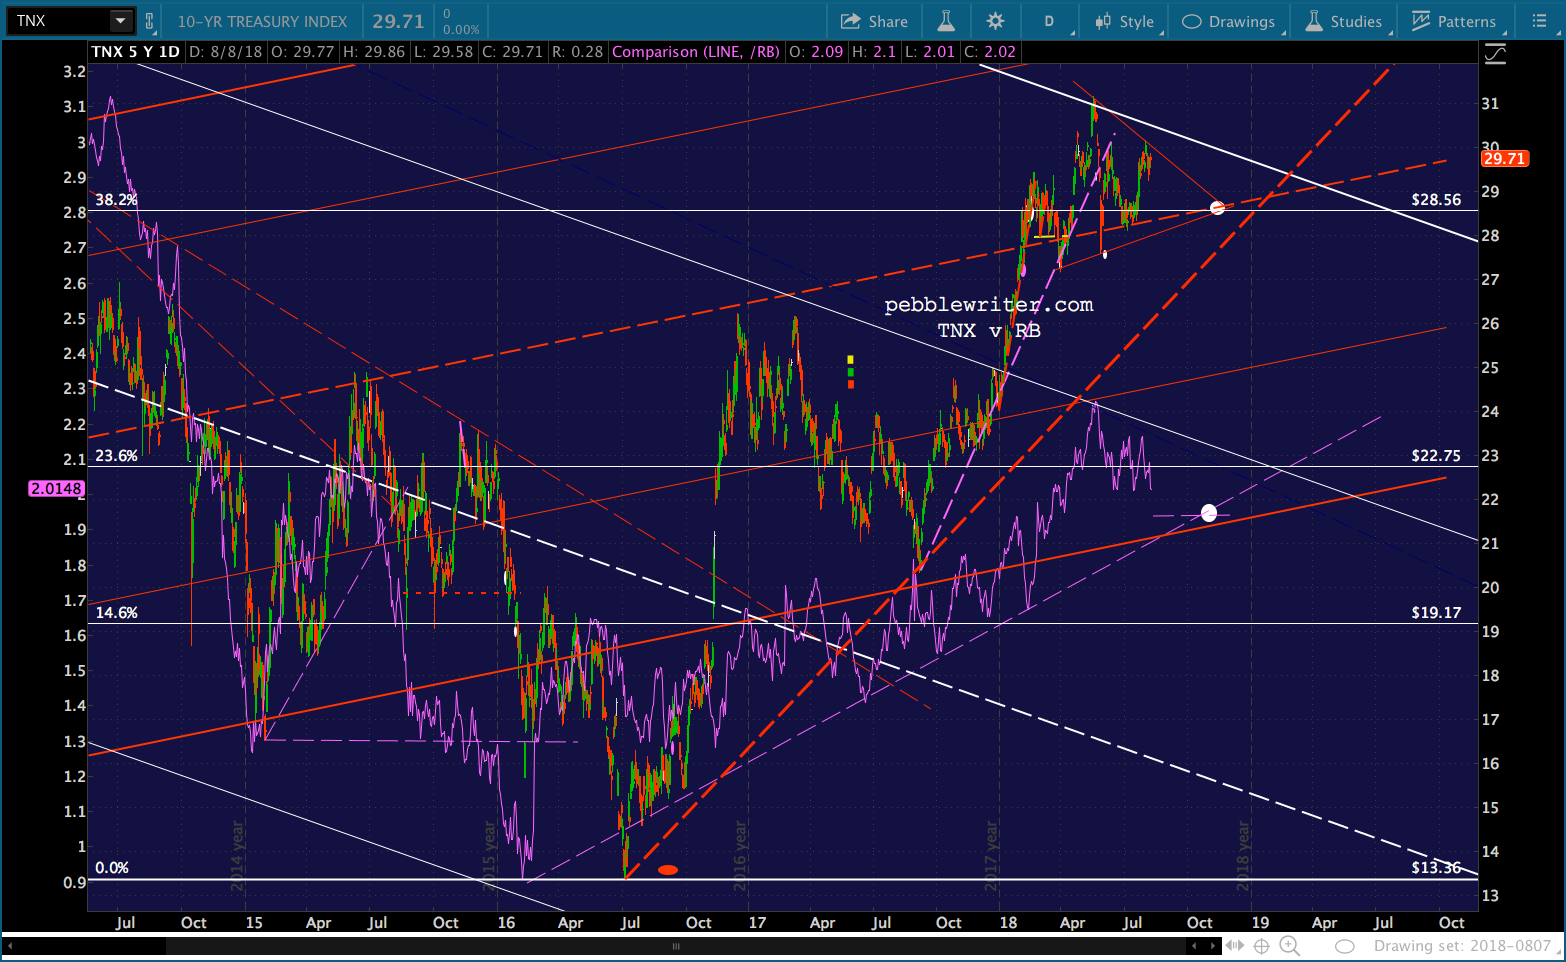
 The 10Y is still triangulating.
 …which is keeping the dollar steady…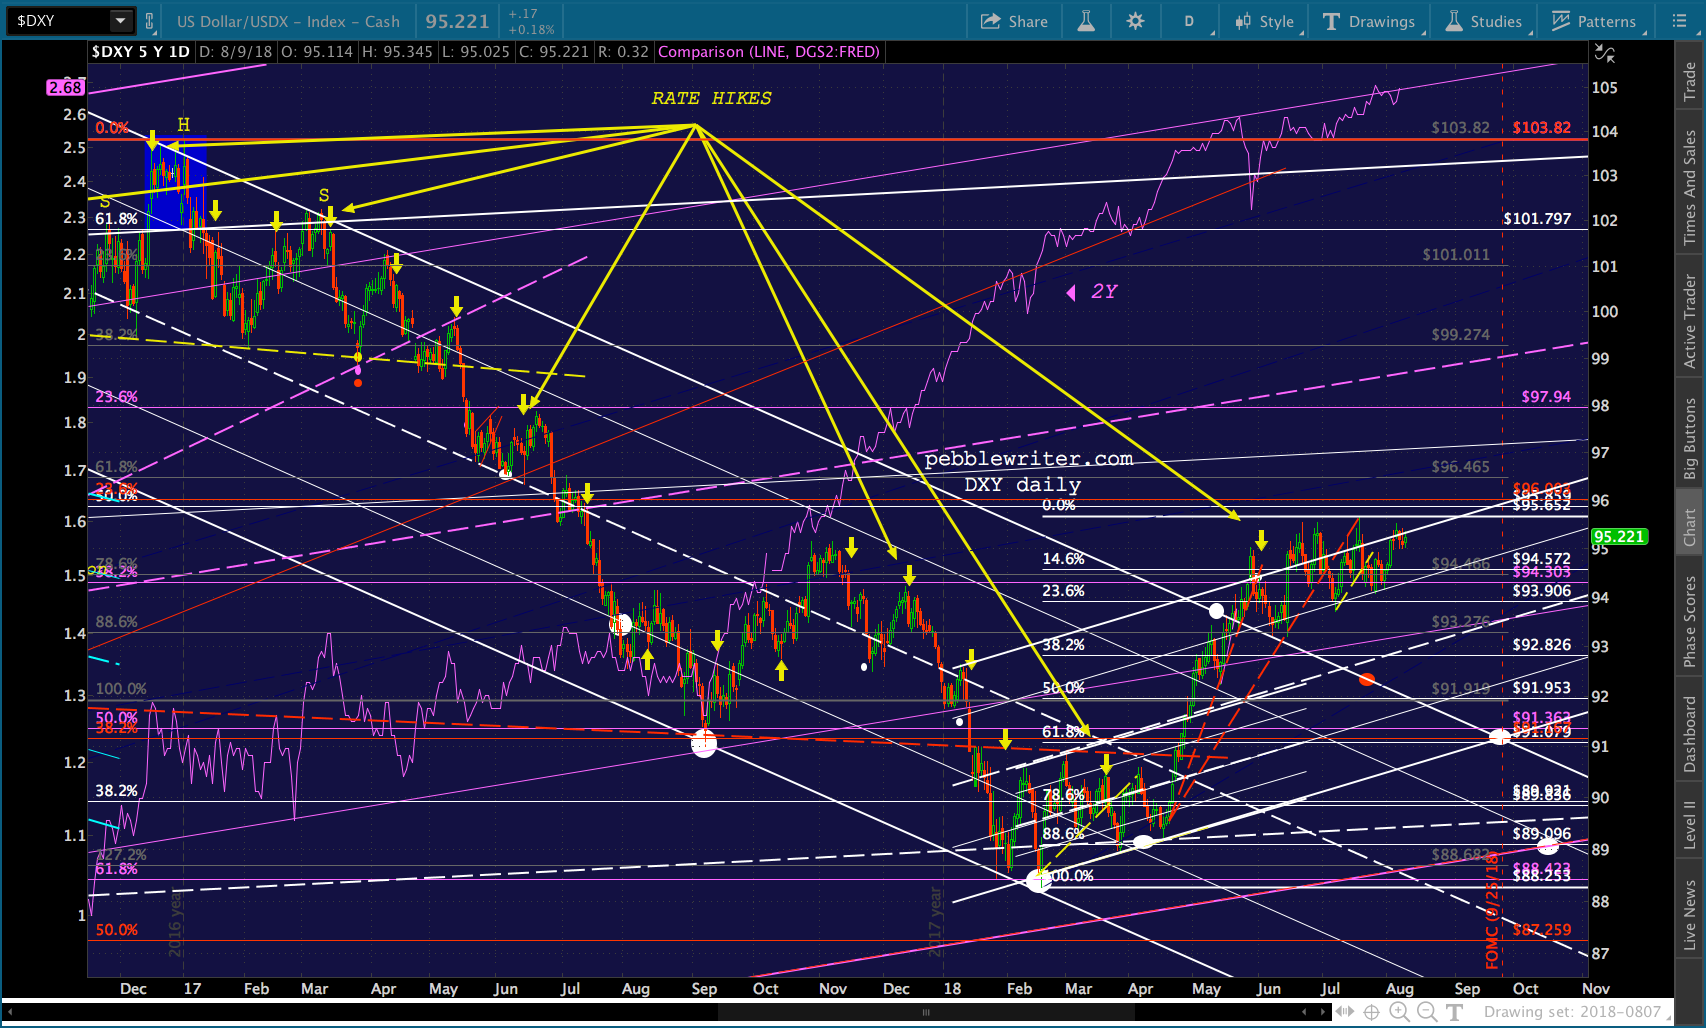
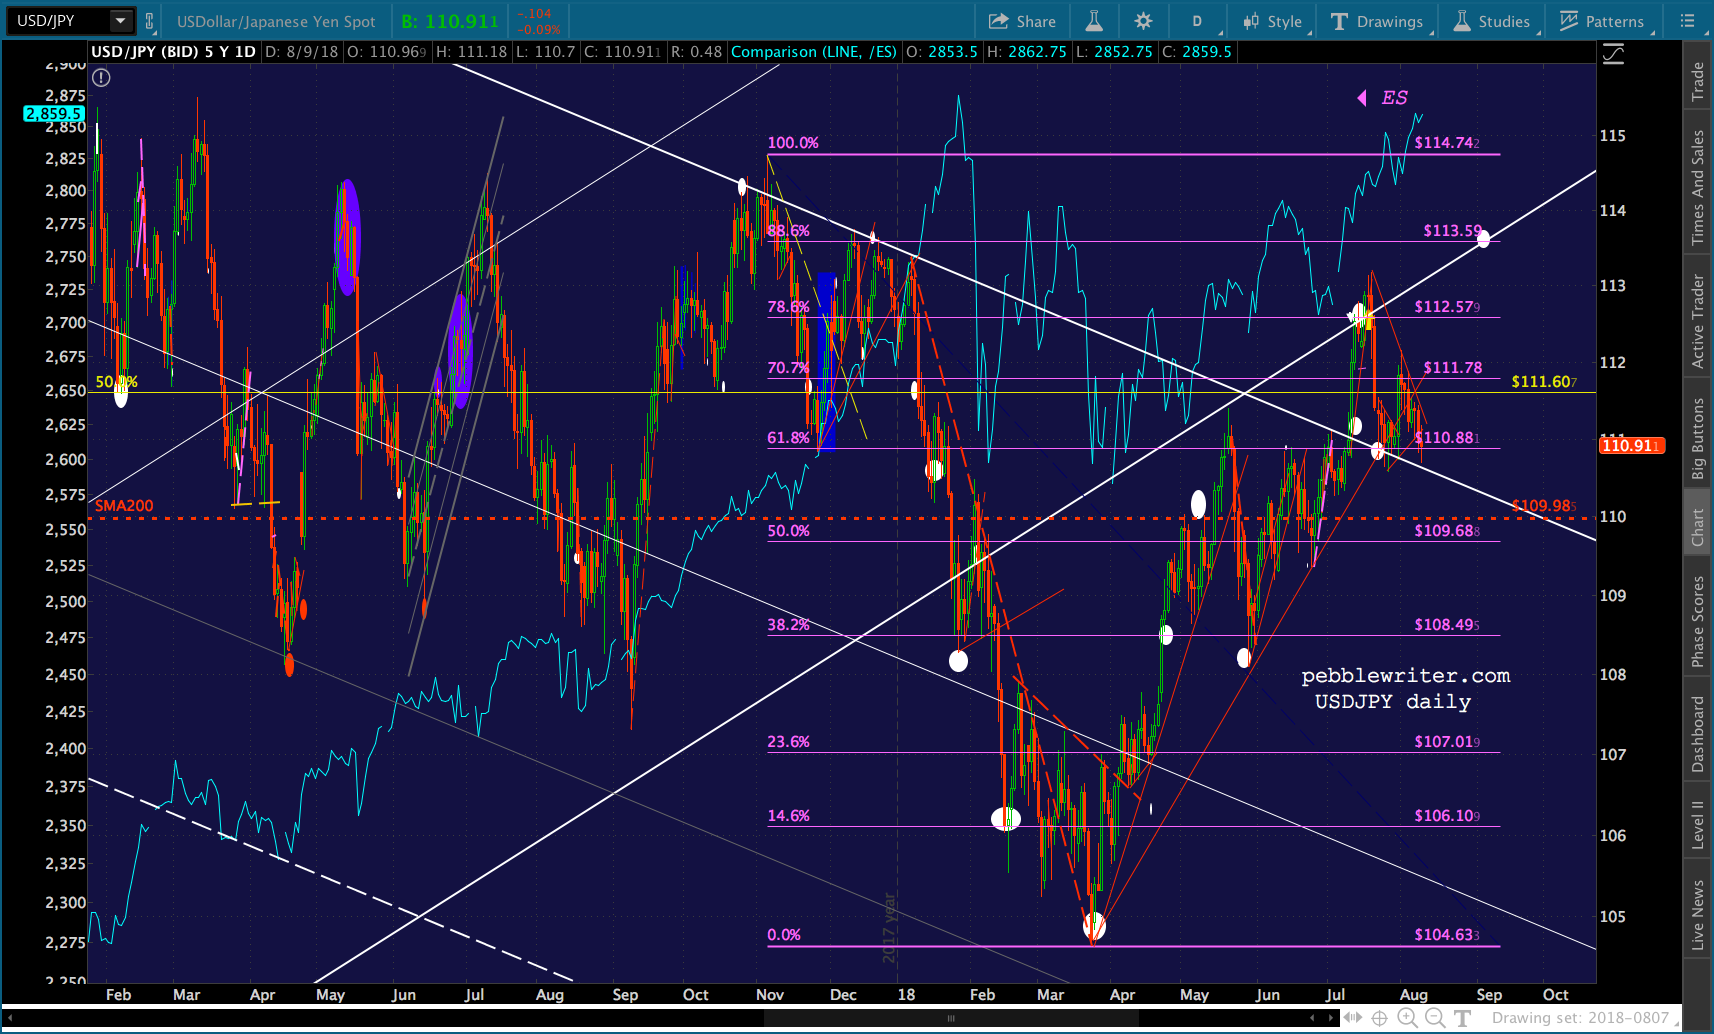
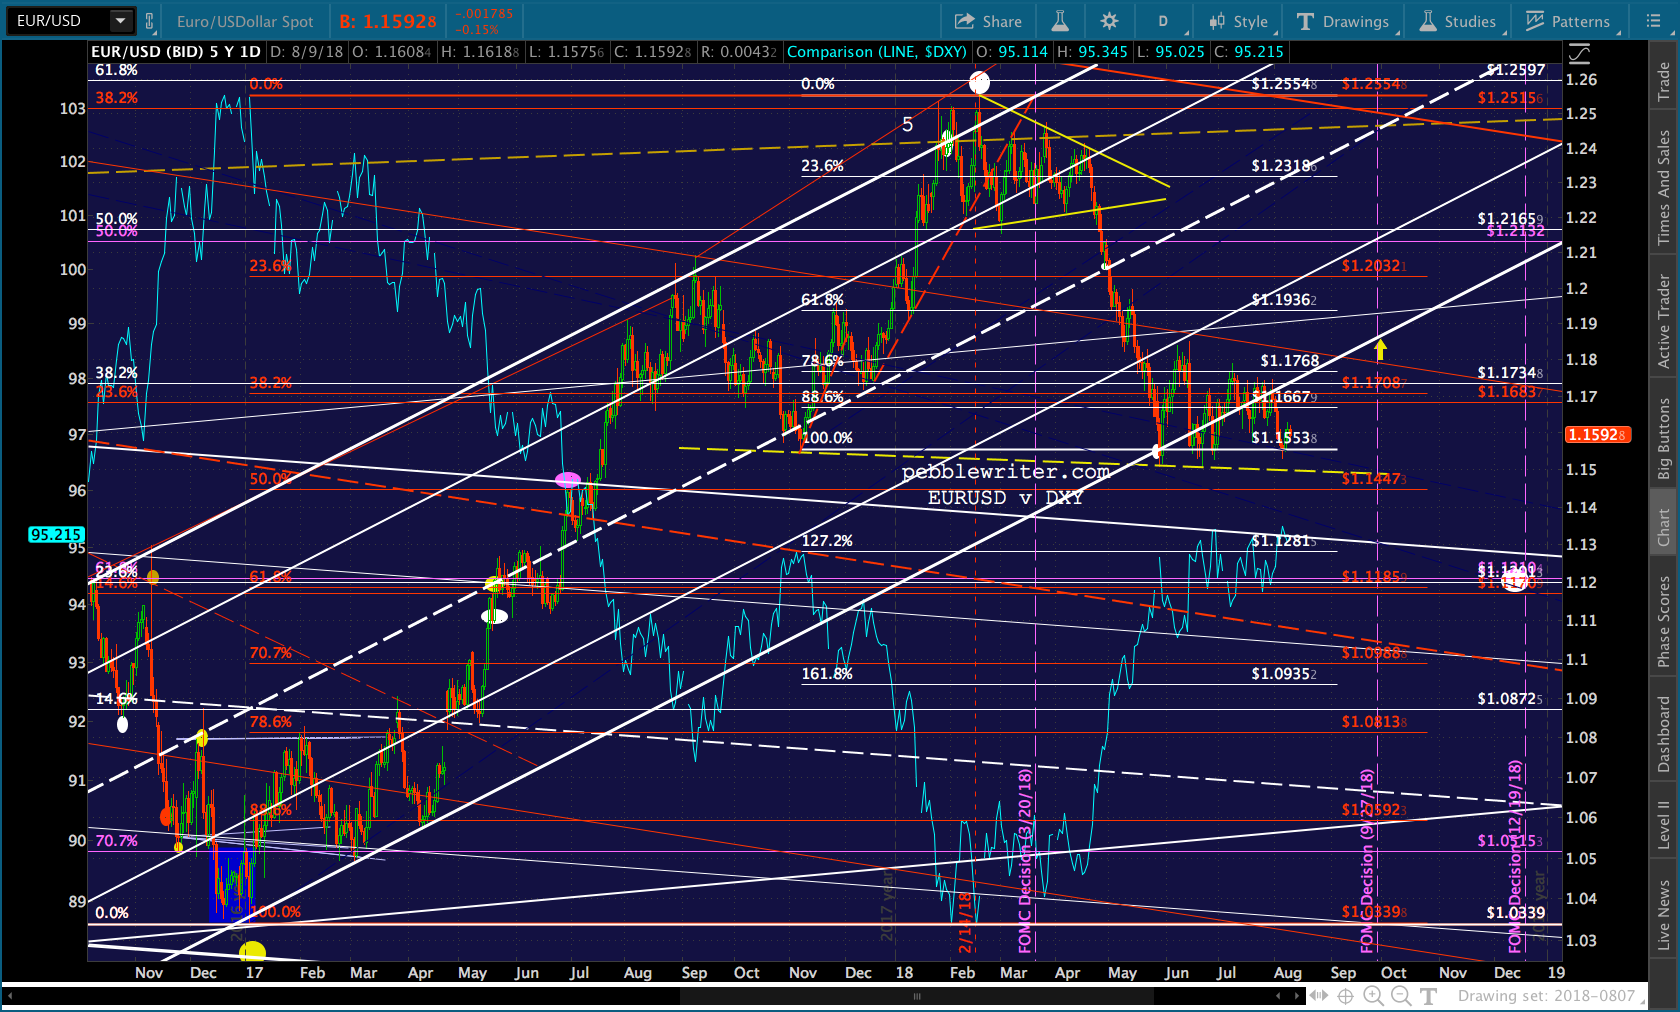 GLTA.
GLTA.