

It’s been a while since we last updated natural gas [see: Mar 28 Update.]. At the time, NG had bounced up to 1.852 after recently testing the 1999 lows. I wrote that, despite strong selling pressure and upcoming seasonal influences…
…there’s strong support for NG, and TPTB might well have made up their minds that it WILL NOT GO any lower.

I placed an upside target at 2.058 — the top of the falling gray channel NG had been in since 2014 — and we waited to see if it would break out or break down. We didn’t have long to wait.
The following day, NG gapped up above a key channel midline. Six days later, it tagged the red target (2.074), consolidated for two weeks, then broke out of the falling channel for good. Just this month, it reached 3.777 — more than doubling its Mar 28 price in little more than 8 months. So, it’s an excellent time to update the charts. Is NG running out of juice, or is there more left in the tank?
continued for members…
First, a quick overview of the big picture. The huge bounce off the Mar 2016 lows was meant to negate the downward-facing harmonic grid and the targets below 1.62 that it implied.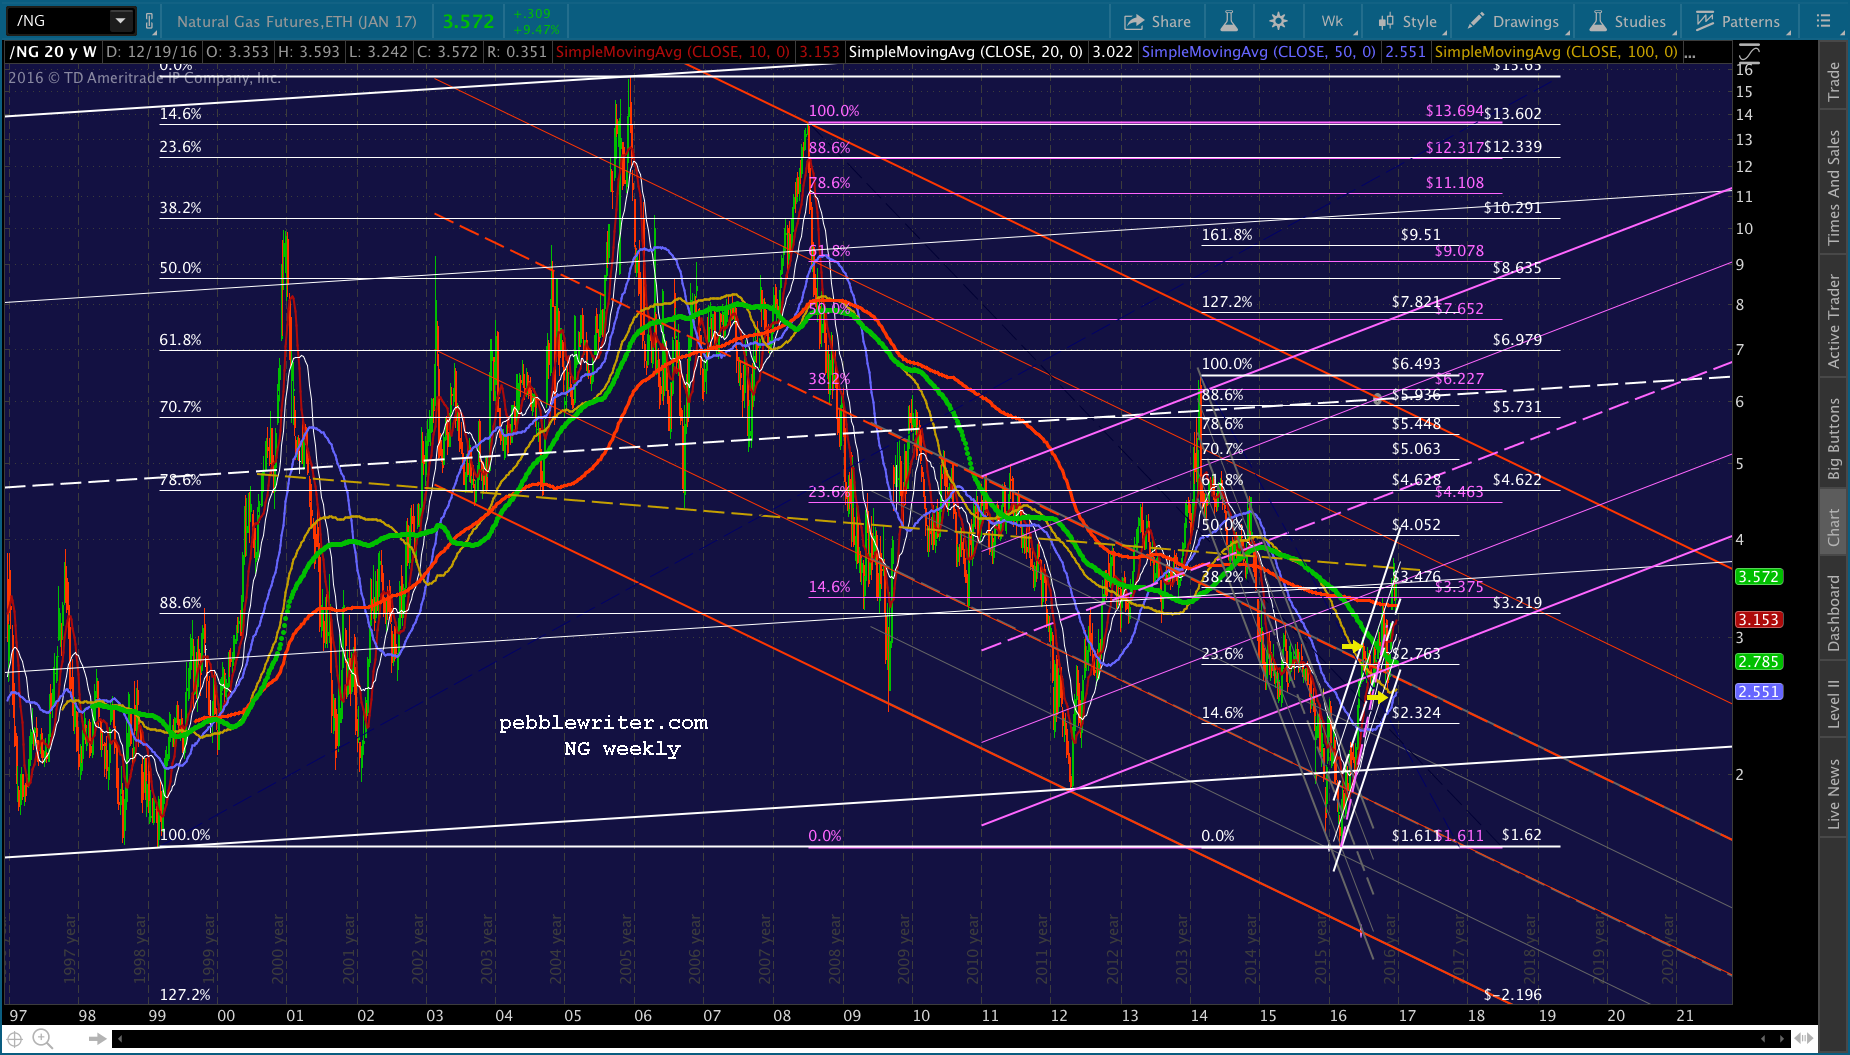 It’s fortunate for the bulls, as the falling red and gray channels suggested a drop to 1.25 or lower. Instead, the push above that channel line and back above the TL/channel line connecting the 1999 and 2011 lows resulted in a runaway rally that has taken NG all the way back to a TL that connects some important highs and lows. It can be seen above in yellow.
In fact, this TL is about the only chart feature which portends any bearishness at all. Contrast this with NG’s list of bullish accomplishments:
- broke out of the falling gray channel
- re-entered the rising purple channel
- re-entered the rising white channel
- rose above the falling red channel midline
- rose above the SMA10, 20, 50, 100 and 200
- rose above and, just today, backtested the weekly SMA200
Note that NG couldn’t even reach the rising white channel bottom and SMA200 in November. It was a perfect setup for a tag of both. But, the day after the election, NG began a one month, 48% spike.
From what I can gather, Trump’s election will likely increase NG production. The last time I checked, an increase in supply lowered prices rather than increased them. So, I’ll stand by my assessment from last March: NG represents “yet another centrally-managed price fixing designed to give the illusion of a healthy market.”
Having said that, our current outlook is that the energy complex is being ramped higher into the year end in order to assure a positive finale for 2016. In Oct 2007, as stocks were topping out, NG doubled over the next 9 months, from 6.846 to 13.694 by July 2008. As markets melted down, NG finally played along, tumbling to 2.409 by September 2009.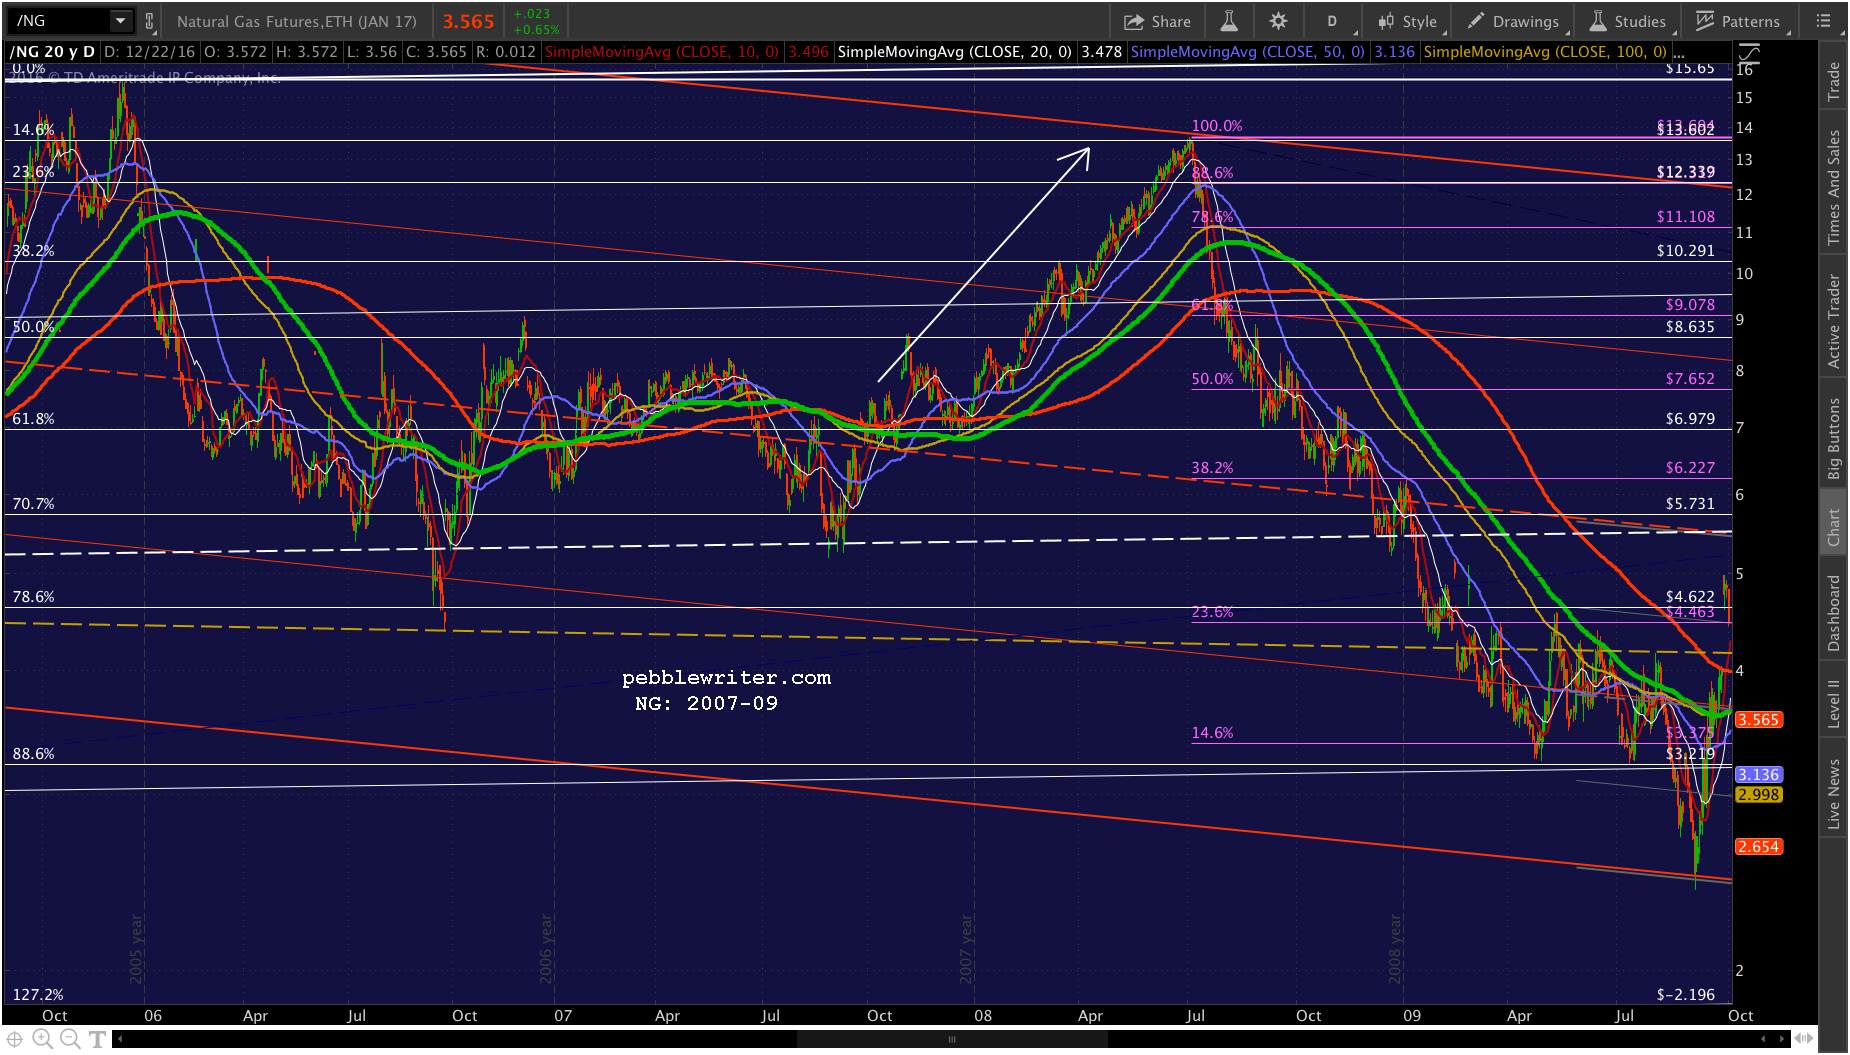
We’re currently replaying the 2007 top. Though, my assumption is that at some point TPTB will attempt to break out of that particular pattern. For now, NG’s challenge is to break through the yellow TL and the .500 Fib at 4.052. If it can then the next serious resistance is the rising purple midline at 4.688, followed by the .886 and white midline at 5.936.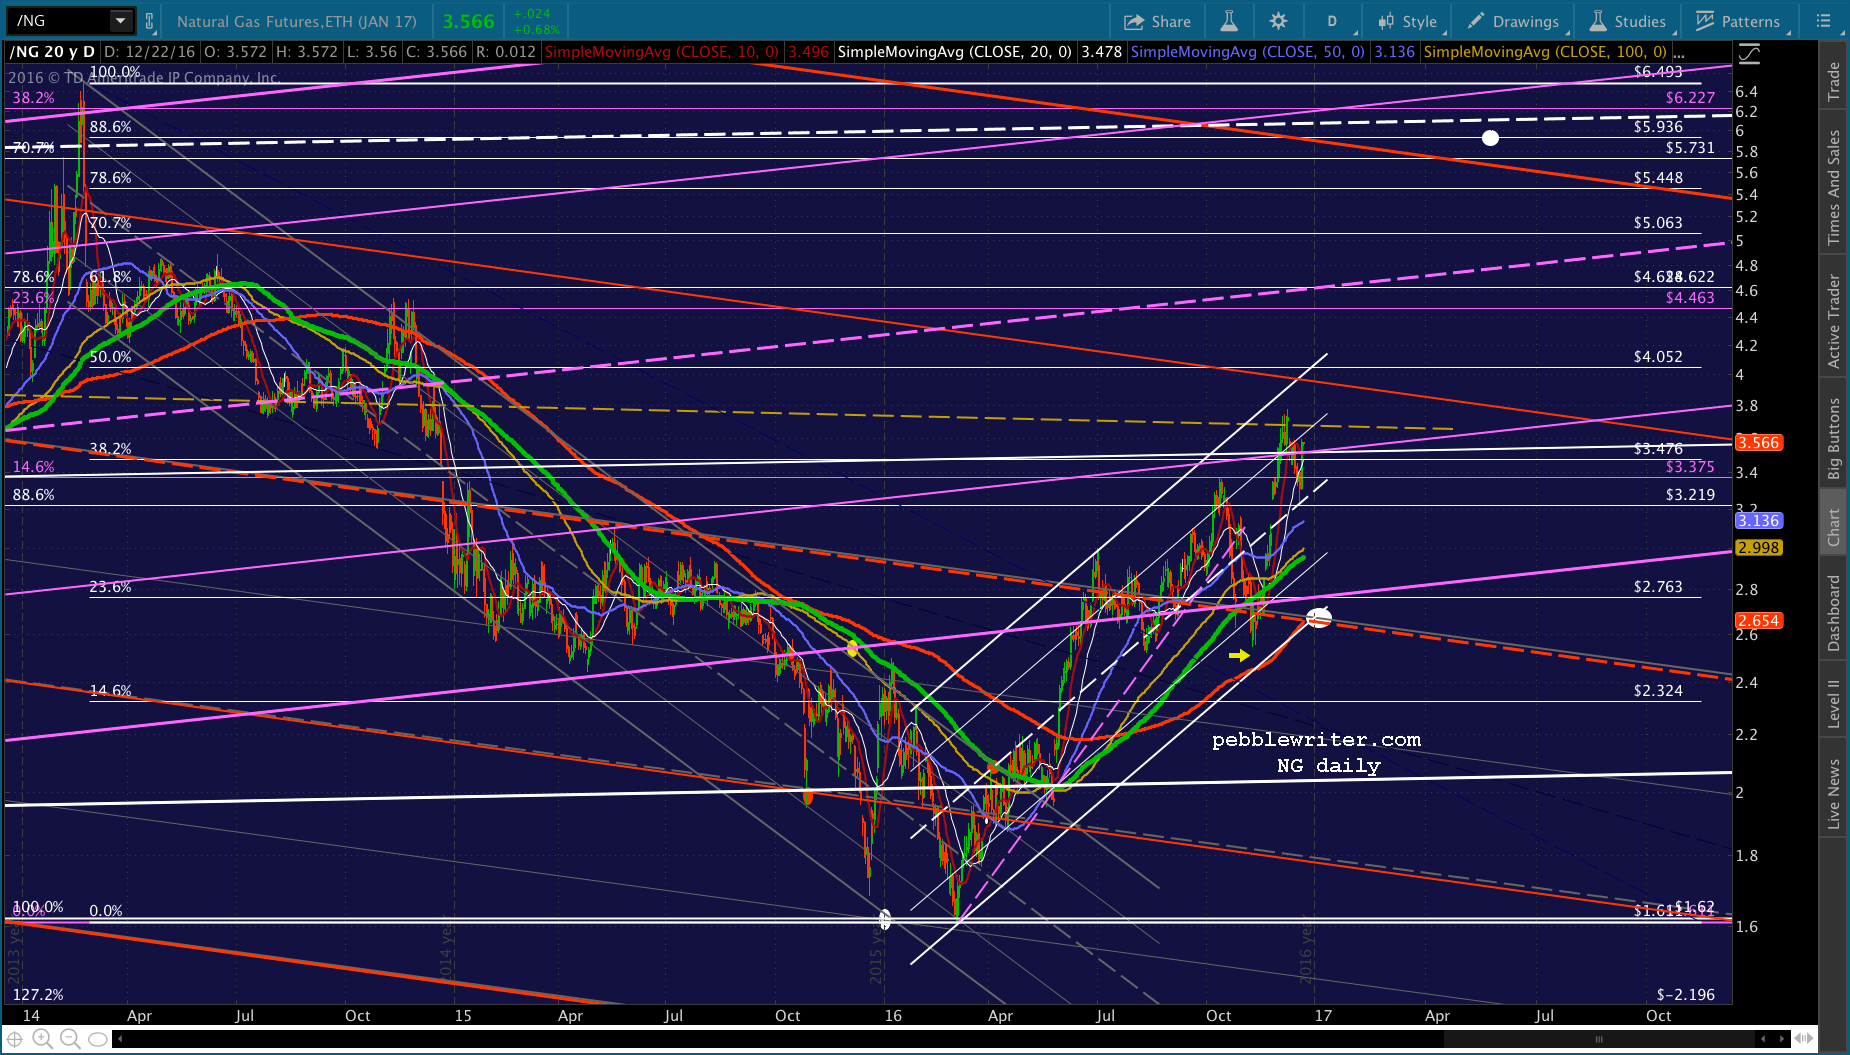 If it can’t break through the TL, then we’re going to see it fall apart after the new year, with the SMA200 at 2.654 as initial support. It doesn’t look like much, but it’s a 25% drop from current prices. My gut tells me we’ll see that drop before we see new highs, especially as inflation increasingly becomes a problem. Besides, the SMA200 is now above the red midline. So, a backtest is no longer a trend-breaker.
GLTA.