

In our December 26 Update, we noted that gold had broken out of a rising channel and was headed for several upside targets including 1292.10, 1346.30 and 1369.40.  Yesterday, it reached the 1346.30 target — a nice 14.7% rally since our Aug 15 bottom call at 1173.60.
 Interestingly, its latest spike has coincided with continued strength in DXY — an unusual but not illogical occurrence.
 We’ll take a look at why this is happening, and what’s ahead for gold. Is it’s strength a warning, as some have suggested?
continued for members…We’re looking for guidance on gold, which means figuring out what’s going on with the dollar — which means figuring out what’s going on with inflation, interest rates and the euro (not to mention oil and gas.)
DXY has steadfastly refused to correct at almost every opportunity…  …even as TNX has broken down.
 The relationship between TNX and DXY is filled with apparent contradictions. DXY usually tracks TNX, but not always.
 Most of us remember the GFC, when DXY moved opposite interest rates. It did so again between June 2013 and May 2015.
 There were a few things going on. Inflation, which had held steady between 1-5% for over 20 years, went negative. Interest rates followed along for the most part.
  The other factor was the euro. For whatever reason, many assumed the GFC was a US problem. Remember all those books advocating the euro as a safe haven? It was, for a while. But, it topped out in July 2008 and, despite numerous bounces along the way, has been falling ever since.
 It finally found support in March 2015, then bounced and broke down twice before a more lasting bounce throughout most of 2017 based mostly on hawkish forecasts (total BS) from the ECB.
  DXY plunged throughout this period, even though the FOMC was steadily hiking interest rates to keep pace with inflation.
  DXY finally reached out 88.423 target at about the same time that EURUSD topped out just shy of our 1.2597 target in Jan 2018. Recall that this was the time that CL and RB broke out, raising the prospect of a further spike in inflation and, thus, interest rates. TNX broke above key resistance at 28.56 and raced up to 32.48 — which (finally) attracted a lot of attention to the growing mountain of debt.
Also paying a great deal attention to rising interest rates was the current occupant of the White House. Rising oil and gas prices were good for stocks, but the inflation and higher interest rates they brought were a problem (leading to our top call in CL/RB in October.)
Since then, inflation has plunged (CPI dipped to 1.55 in January) and interest rates have sort of followed along. The 10Y has further to go, but there’s that nasty problem of an inverted yield curve to consider. At 13-15 bps, the 2s10s is dangerously close to signalling a recession.
The other way to keep inflation under control, of course, is by allowing the dollar to rally. Yes, it’s crummy if you’re a big US exporter. But, as a net importing country, the US benefits from lower prices on all the crap we import.
So, here we are, with interest rates and the dollar a little too high. The missing puzzle piece has been the EURUSD, which after establishing a clear pattern of falling hard after its previous rising channels broke down… …suddenly decided to go nowhere for seven months.
 A lot of what’s happening with the euro is related to Brexit. Personally, I think it’s a shit show with both parties likely to lose. I completely understand those who wish to exit the union, as the ECB at times seems to be a sinking ship. And, I completely understand those who would rather cling to a sinking ship than one that hasn’t demonstrated it’s capable of floating on its own for many years.
I’m working on the EURGBP charts lately, and should post an update soon. But, the chart below shows a great deal of indecision going back to late 2016.  What does this mean for the euro and hence the EURUSD? For now, TPTB seem perfectly content to let things go sideways — with a likely tag of the SMA200 somewhere around 1.1520 followed by more sideways — at least through the end of March.
The DXY should, thus, bounce on its channel backtest (96-96.2) and continue climbing until inflation is judged to be too low. All of this will put pressure on GC except for the fact that some investors will choose to hold it as a hedge against burgeoning uncertainty.
For those, it likely doesn’t matter that GC has reached an important Fib and a channel midline. They will also be happy to ignore the fact that it’s been in a falling channel since Aug 2011…
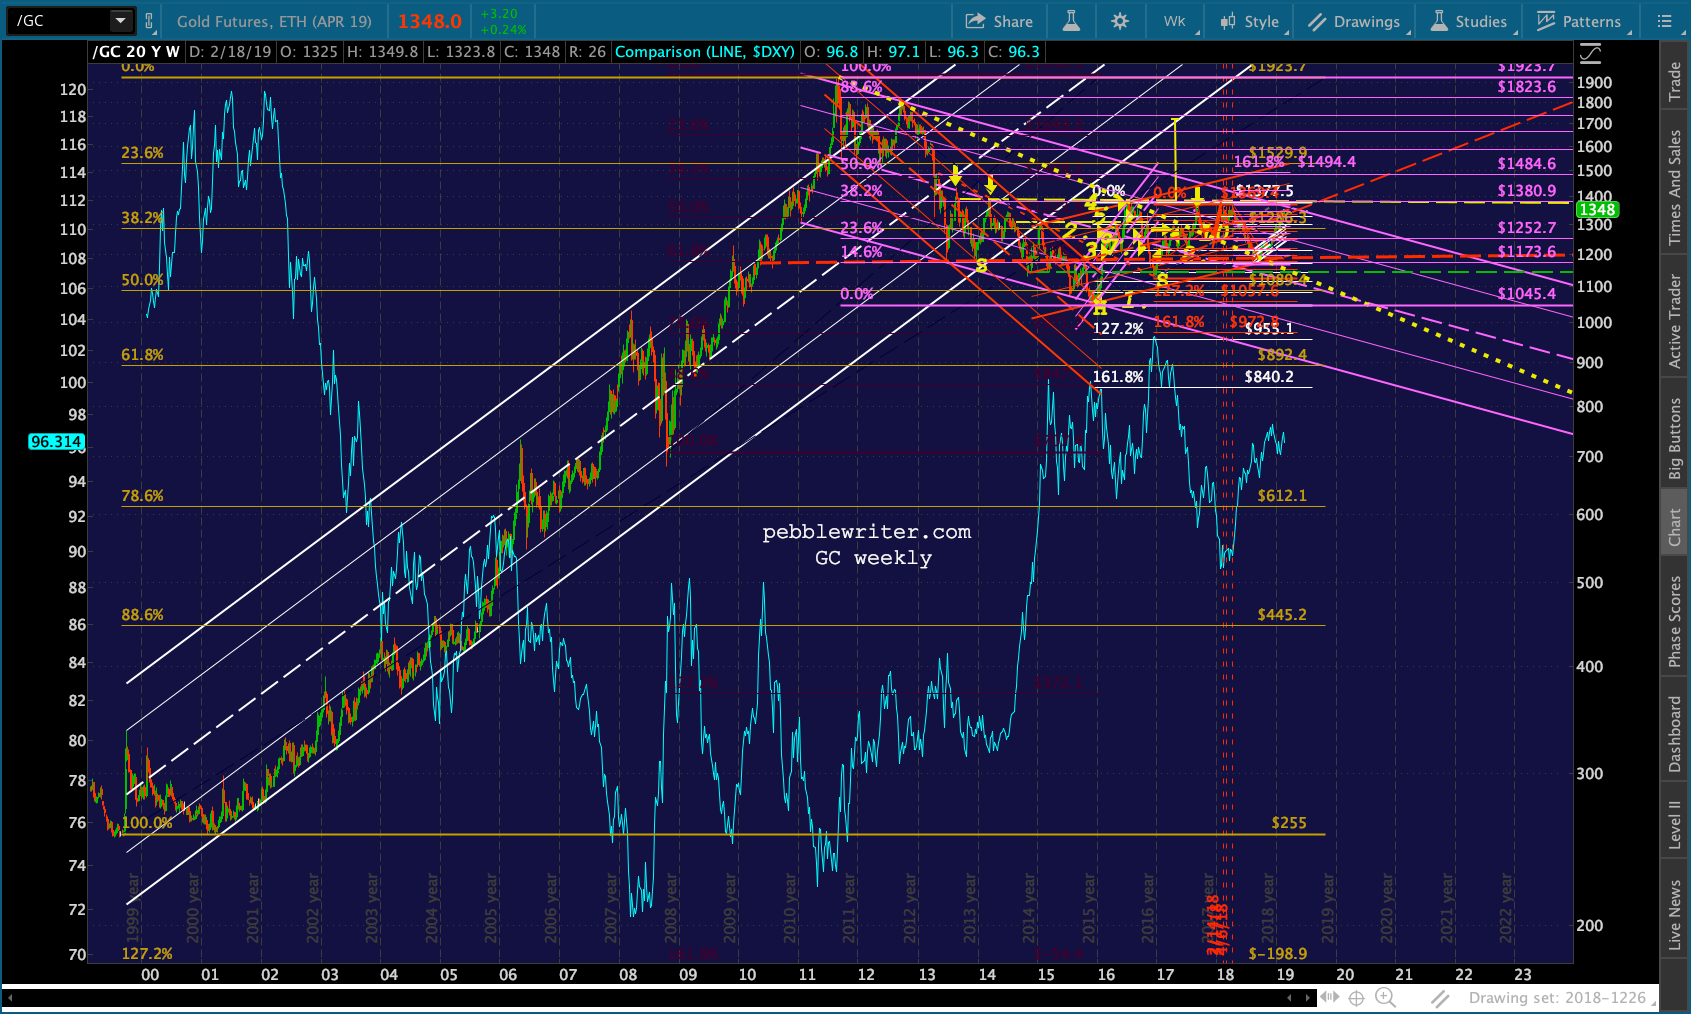 …and that, even if GC pushed through the .886, it will run into the horizontal resistance and the purple channel top at 1369-1377.
 I have no problem playing along on any push through 1346.30. But, I’d use very tight stops and be back to short on any failure at this level. I wouldn’t get excited about big upside gains until it pushes through 1369-1377.
  UPDATE on EVERYTHING ELSE…
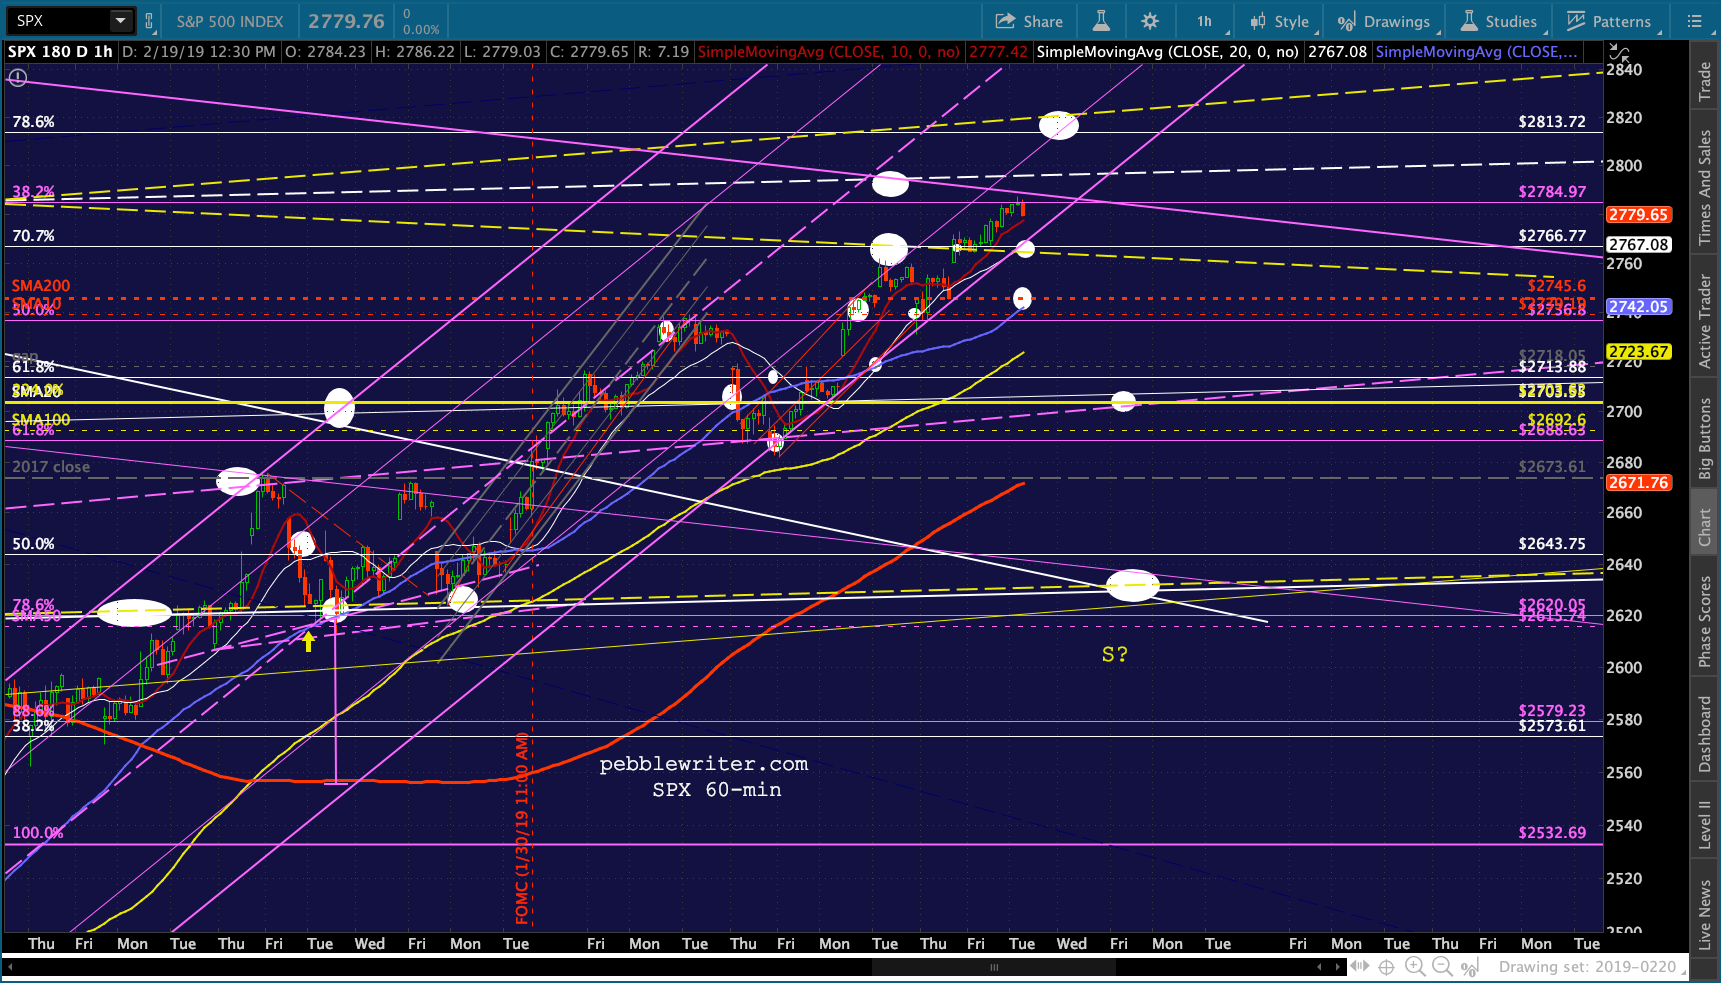
I’m running a little late this morning, thanks to some muscle relaxers that are working very well. Here are this morning’s charts for those of you who’d just as soon skip the gold/interest rate/currency discussion above. Bottom line, it’s still all about VIX. A breakdown is still very much a threat to the bears.


 Although it’s very interesting that ES topped out within one point of our A=C target.
 Yield curve model is still bearish…
 …the 10Y has still broken out…
 …but COMP, unlike SPX, ES and DJIA, has no room to backtest yet. This is almost certainly what has TPTB in full-on manipulation mode and VIX in danger of a breakdown.
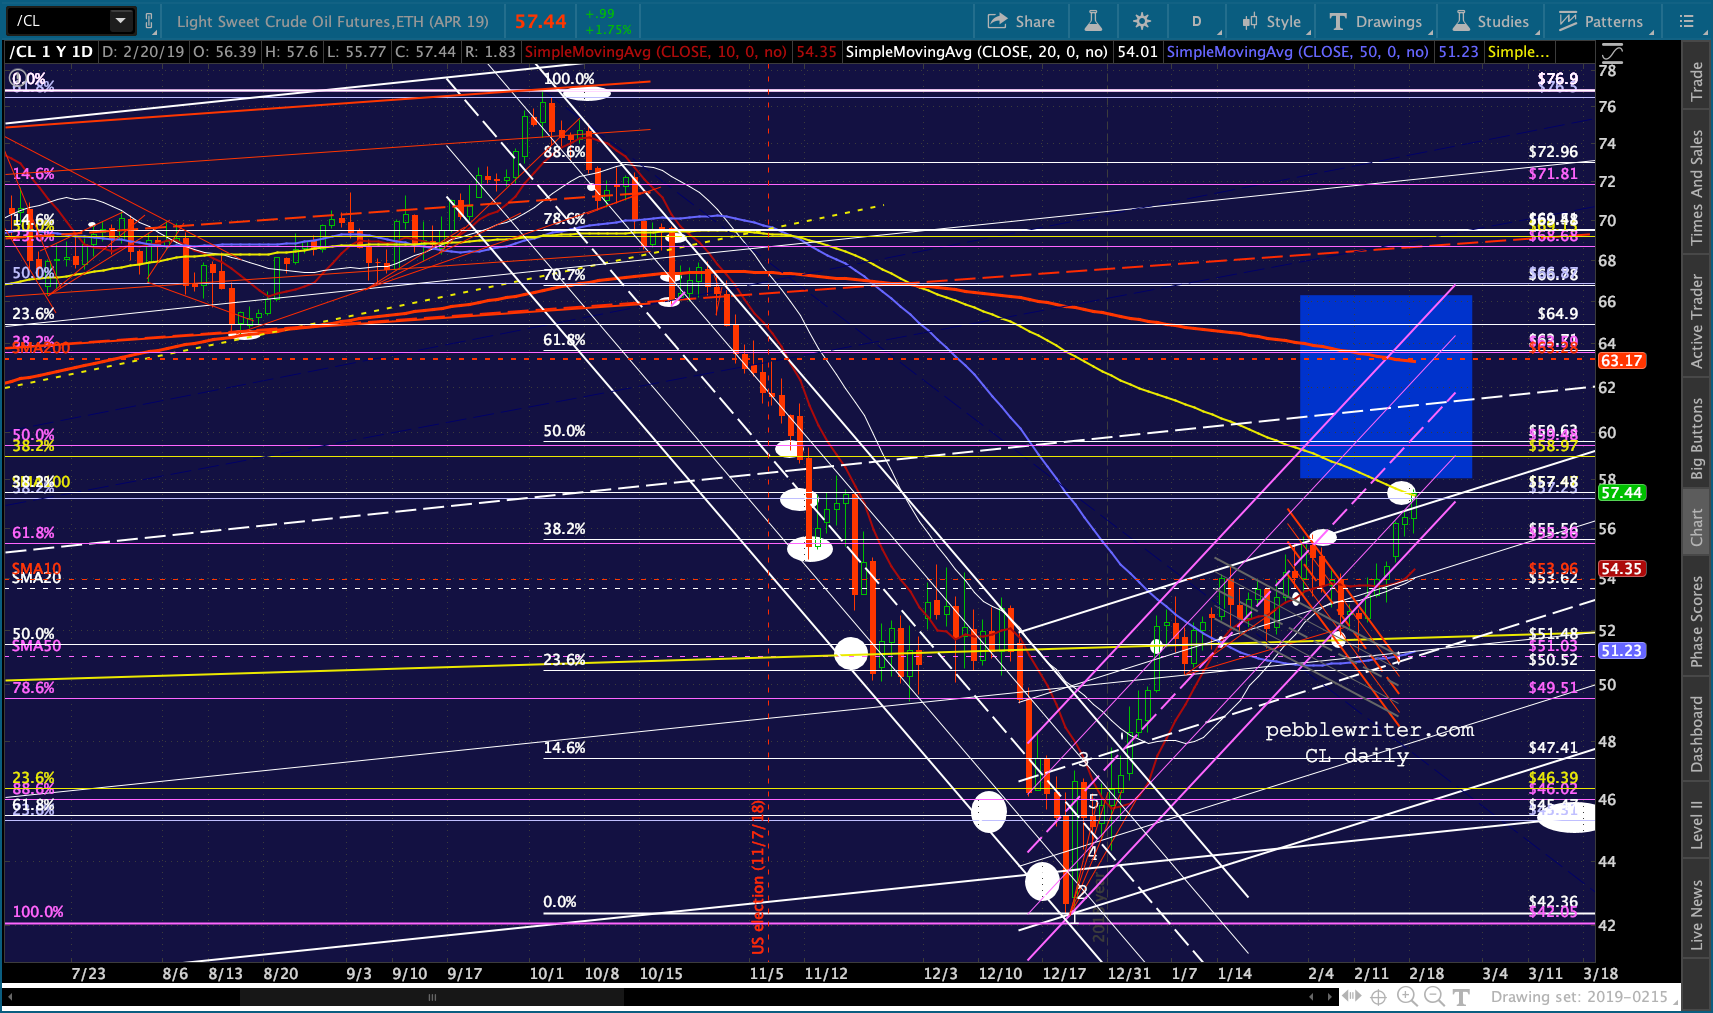
 RB and CL still seem to me to have topped, at least an interim top.
 While USDJPY continues going nowhere…
 …EURUSD appears to finally be ready for its SMA200 tag — probably to coincide with DXY’s channel backtest.
 UPDATE: 12:10 PM
ES tested its earlier highs on a slide in VIX and rallies in oil and gas. But, for now at least, it is holding off making new highs. 
 GC has pushed slightly above 1346.30. I’d play along, but with very tight stops. I’d be short in a jiffy on any drop back through 1346.30.
 I have to run out for a doctor’s appointment, will be back in a couple of hours.
GLTA.
UPDATE: 4:00 PM
VIX has officially broken down. Typically, this means stocks are going higher. Though, it’s not guaranteed, doesn’t necessarily mean new highs, and isn’t necessarily immediate – depending on what else is going on. Note, for instance, that COMP is still barely above its SMA200. But, CL and RB both had good days, and USDJPY hasn’t broken down. So, for now at least, the bulls appear to be in charge. Until things clarify, it’s a good time to remain cautious.


