

We had a lovely snowfall Sunday night. The Monday morning landscape was exquisite, with a beautiful frosting adorning the pines lining our street. There was just enough snow underfoot to look charming, but not enough to require shoveling.
Unfortunately, there was also just enough to hide the dangerous black ice lurking below. As I lay on the couch later that day, trying to recover from the inglorious splat I executed on our driveway, I realized I had happened upon a pretty good analogy for the current state of the markets.
Everything is indeed gorgeous on the surface. Just this morning, we are reminded that some retailers such as WMT are doing wonderfully (even if they’re just stealing market share from the multitude of retailers that are closing up shop.) But, what about the dangerous undercurrents that no one notices until it’s too late?
One of my favorite chart patterns is the consolidating triangle, seen this morning in the 10-year note futures (ZN.) In a way, it’s like black ice — lulling investors into a false sense of security that everything is contained.
 Readers will remember that ZN came up just short of our 123’100 target on Jan 3. It would have capped off a lovely 5% rally since our bottom call (top call on rates) in October.
As rates plunged toward our 24.98 target on Jan 3, stocks took notice. The Dec 24 rally began to falter. The DXY began to falter. Our yield curve model woke up. Clearly, something had to be done.  The charts show the resulting triangles which formed in the aftermath of a bounce in yields, droop in prices. The targets are still there. But, now they’re waiting for the triangle to break out or break down and — more importantly — for stocks to build a little more cushion before playing out.
With SPX and DJIA well above their 200-DMAs, they’re in the clear. COMP, however, has struggled to reach its 200-DMA, let alone push above it. Recall that it faced similar problems in November, when a push above its 200-DMA faltered, and again in December when it failed to reach it at all — producing a 17% plummet. With the 10Y triangles about to break out or down, CL and RB at or near our upside targets and VIX having reached our next downside target, is the market about to go splat?
continued for members…
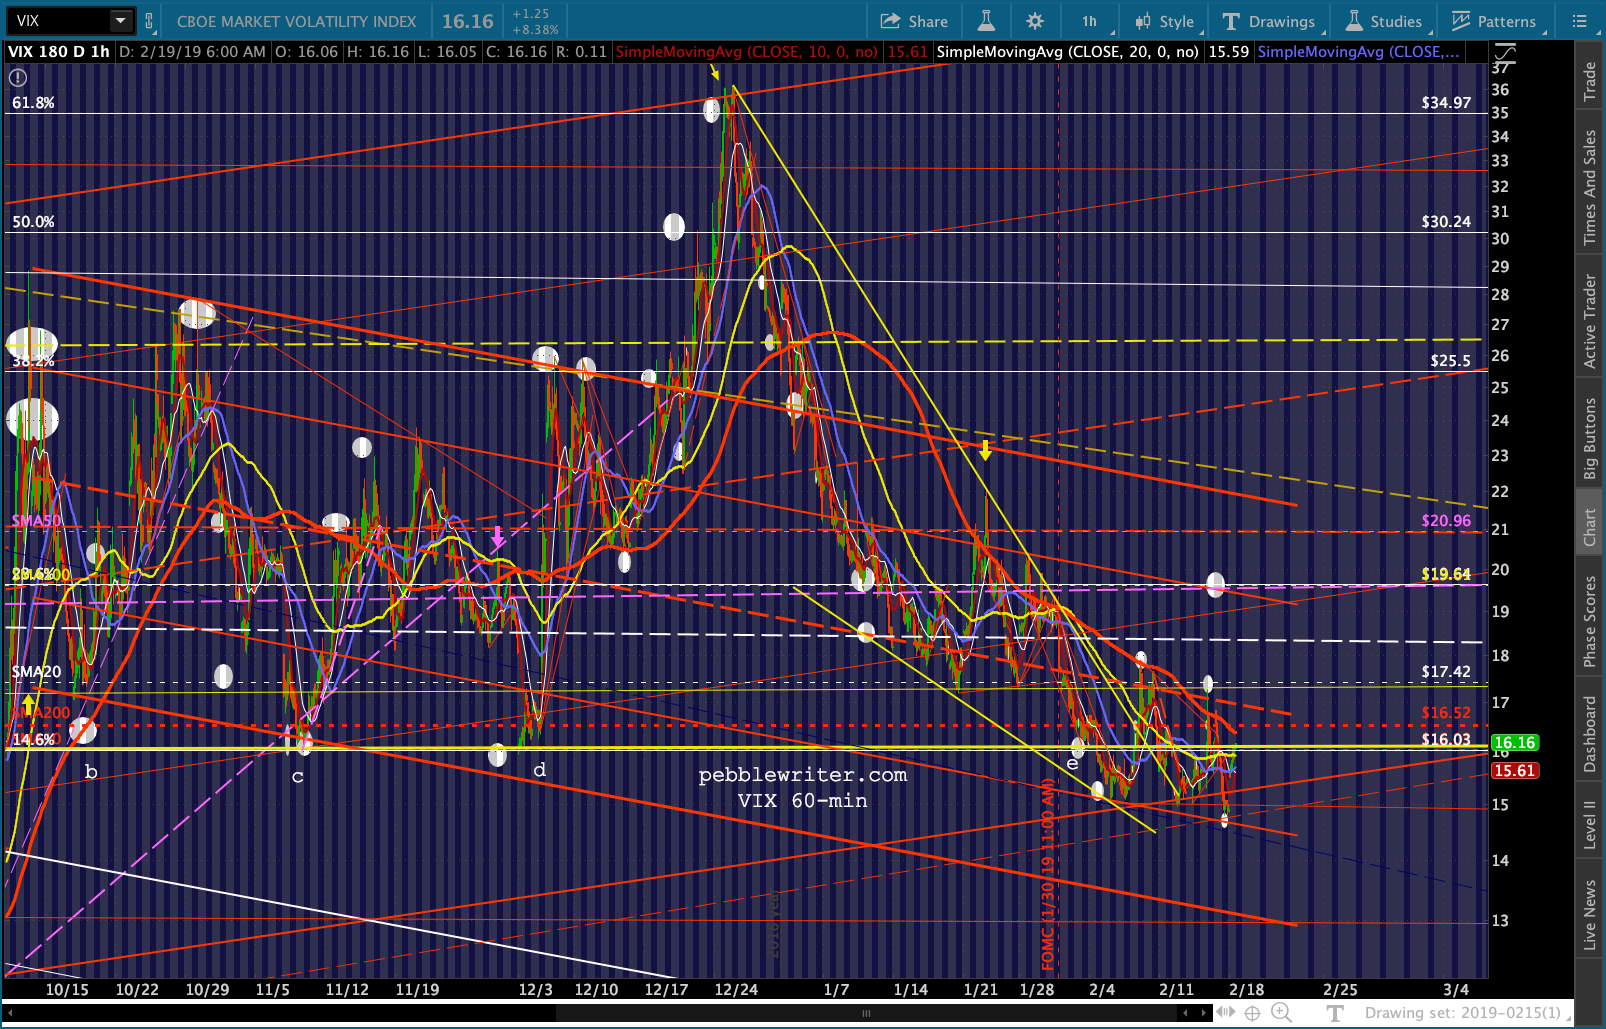
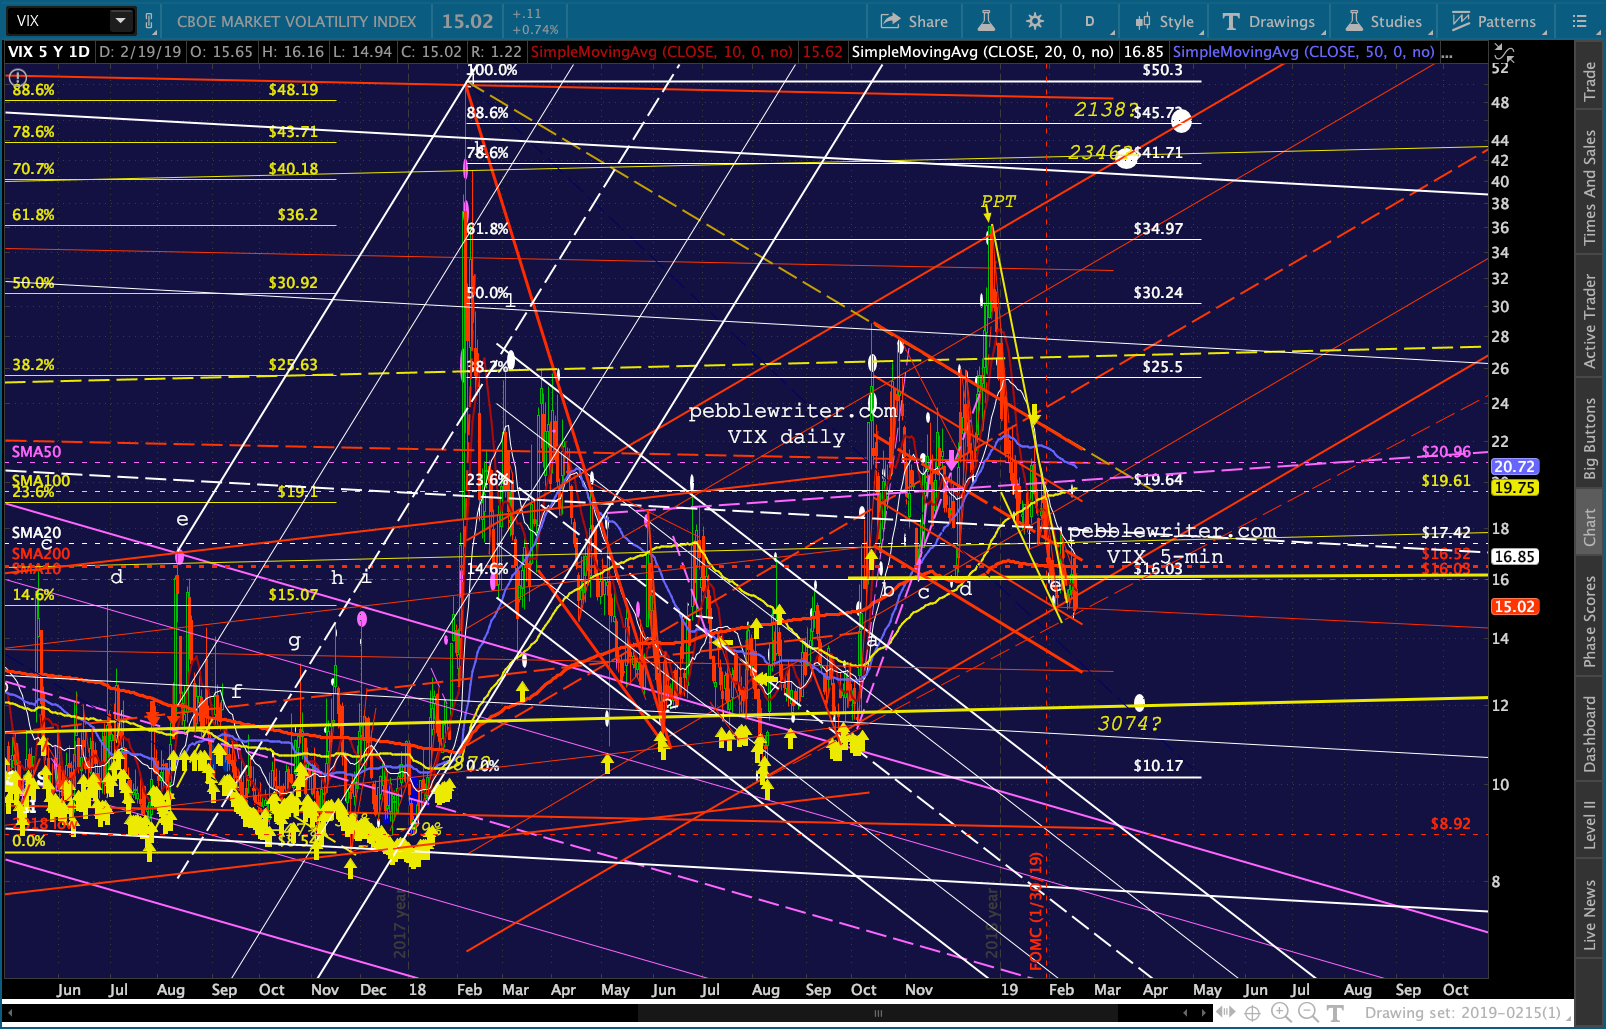
It’s hard to imagine COMP breaking out with AAPL joining in. Lately, though, it looks like it wants to pull the covers over its head and hide.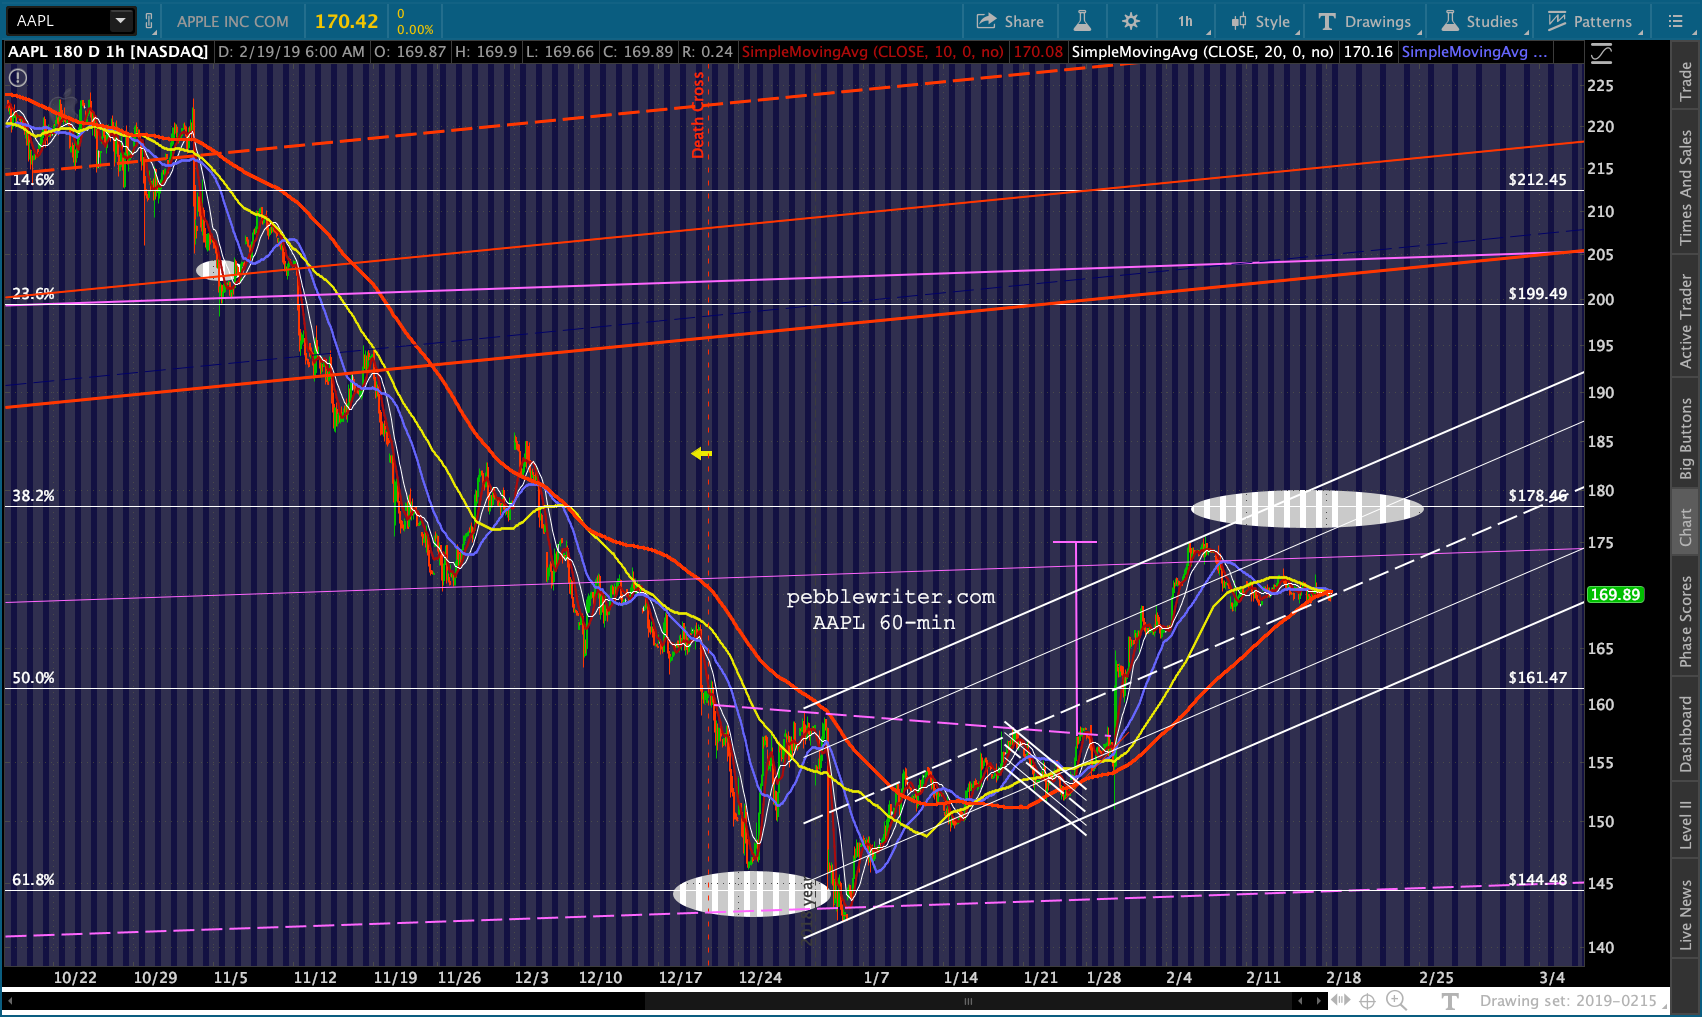 We’ll start with VIX, which reached the lowest possible level of support last week. Any lower and it almost guarantees a continuing rally for stocks. It it bounces instead, we’ll finally see a correction. With futures off 10 points and VIX pushing up against the yellow channel bottom, we’re probably at an inflection point.
 For SPX/ES, this means a backtest of some sort, maybe even a right shoulder for the potential IH&S Pattern we’ve been charting. SPX has 20+ points of cushion above its SMA200 and 70+ points above its 2.24 Fib.
 It could form a nice IH&S right shoulder by dipping to its red neckliine around 2630.
 ES is similarly positioned, with one interesting difference.
  It’s coming up on its B target for an A=C corrective wave that would land it at its 1.618 at 2155. The magic number is 2786.25.
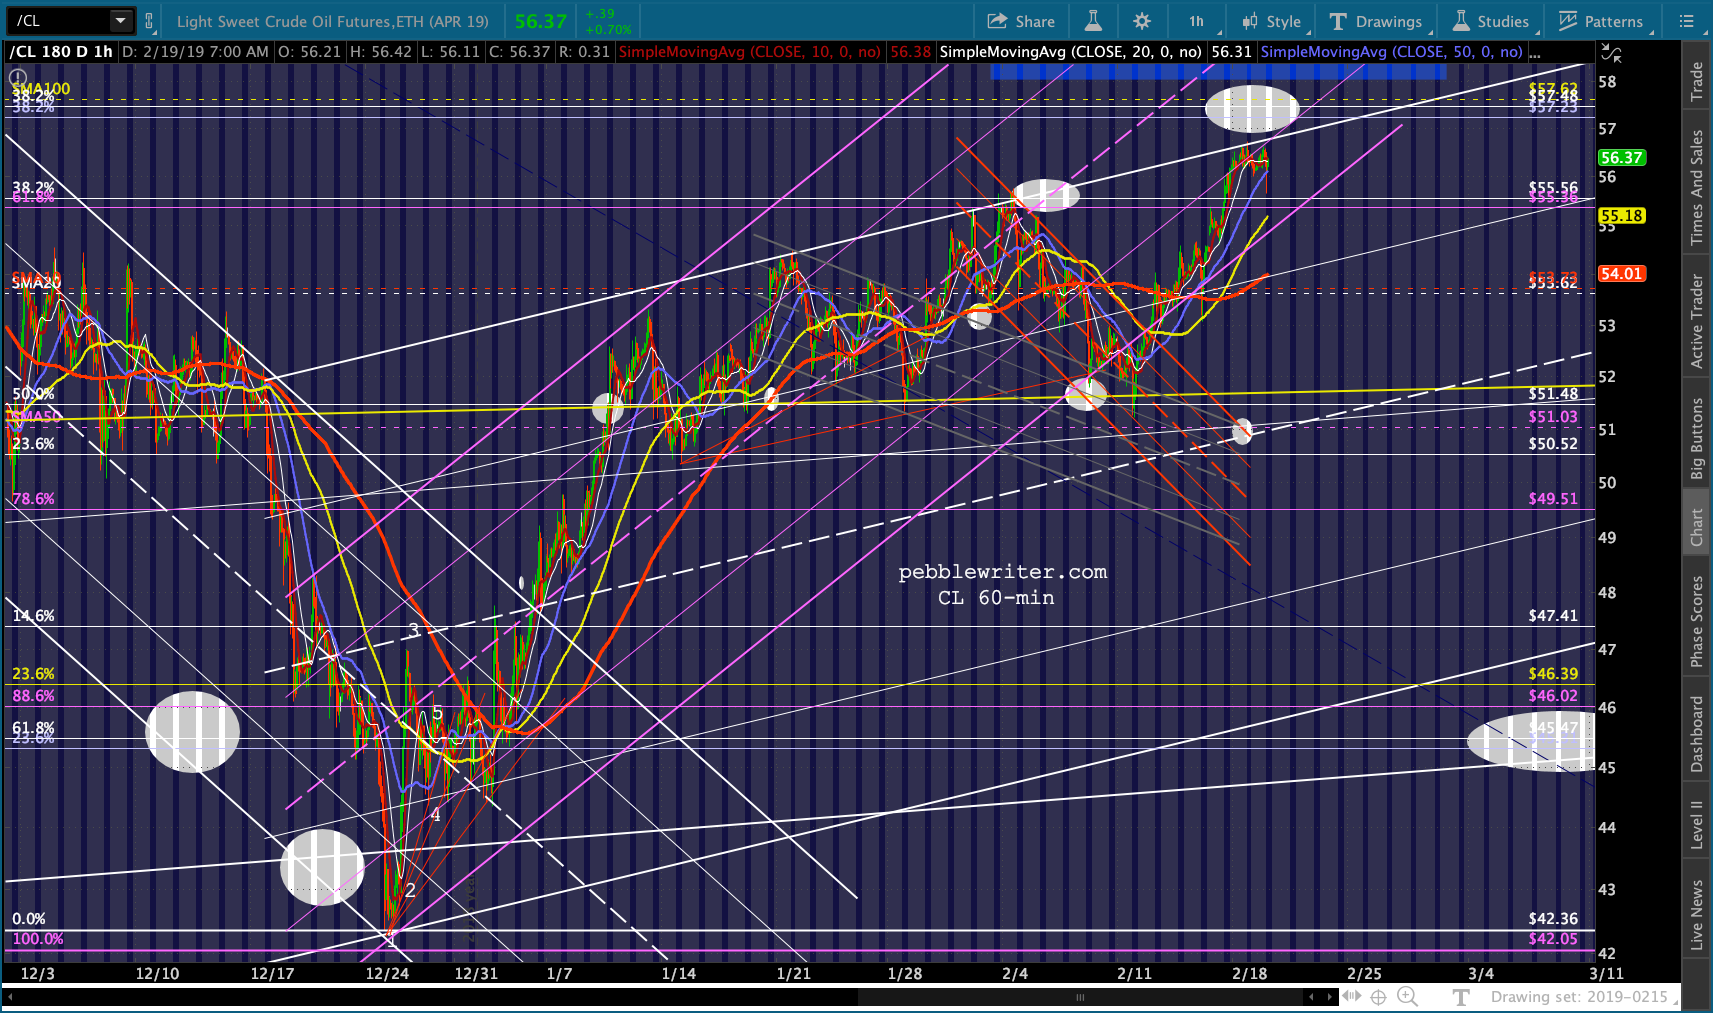
 CL has a little more headroom to advance…
 …but RB should have topped out on Friday.
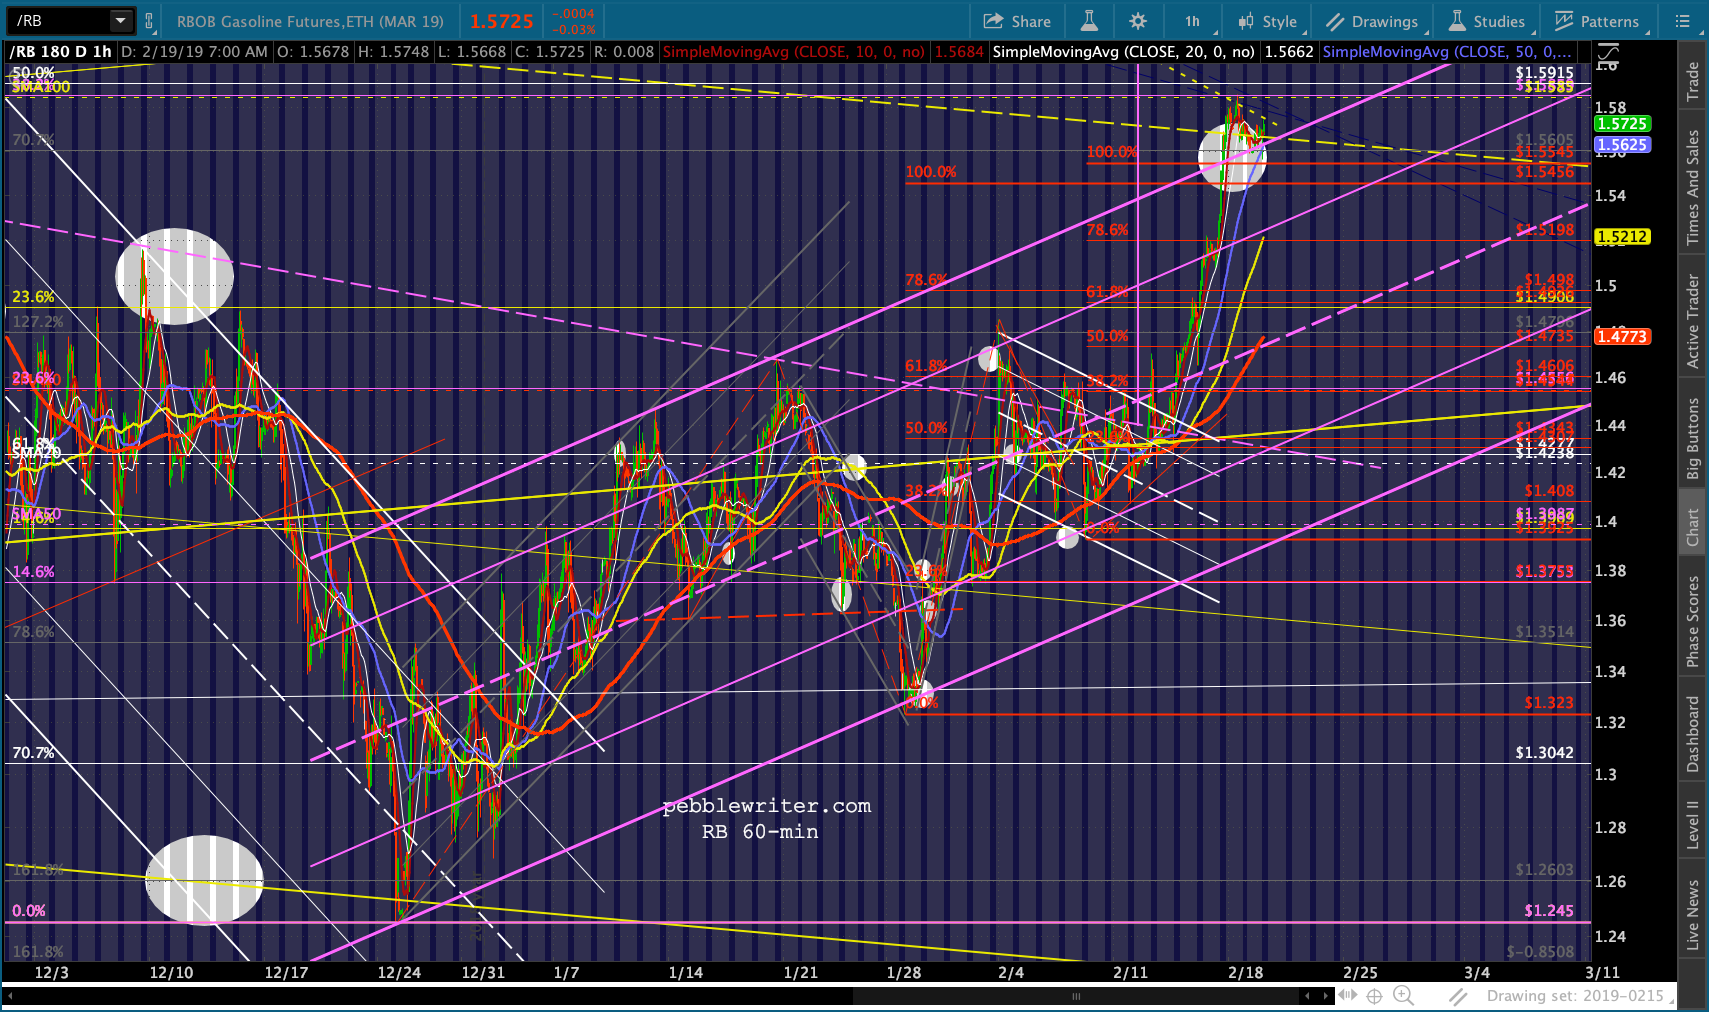 The currency picture continues to look like something’s about to snap. The DXY broke out of the falling white channel on Feb 6, but had trouble at the rising channel midline.
  And, though EURUSD’s flag pattern has technically broken down, the pair refuses to die or rebound just yet.
  USDJPY is in maintenance mode, trying to do as little as possible to do any damage. The purple TL broke down, but the white channel is obviously still intact without even so much as a midline test.
  Our yield model is chugging along – still warning of a significant tumble to come by virtue of the break out above the red dashed line and a breakdown below the yellow dashed line. It doesn’t always call the exact top, but it has yet to fail us in signaling a downturn.
 The ZN looks ready to pop, with multiple even higher targets on deck. 123’100 looks like a gimme, and 123’285 is very appealing.
 Last, GC is popping this morning even though it never quite closed the last gap. It’s well ahead of schedule, so I would watch it carefully for signs of a reversal at or near its .886 at 1346.30. A push through the Fib means 1369.40 — the previous high from last April — is our next bogey.
 If we shift the rising red channel just a bit, we can see channel midline resistance at 1370ish — though there have been many overshoots of that very same midline. Clearly 1370-1390 represents formidable resistance.
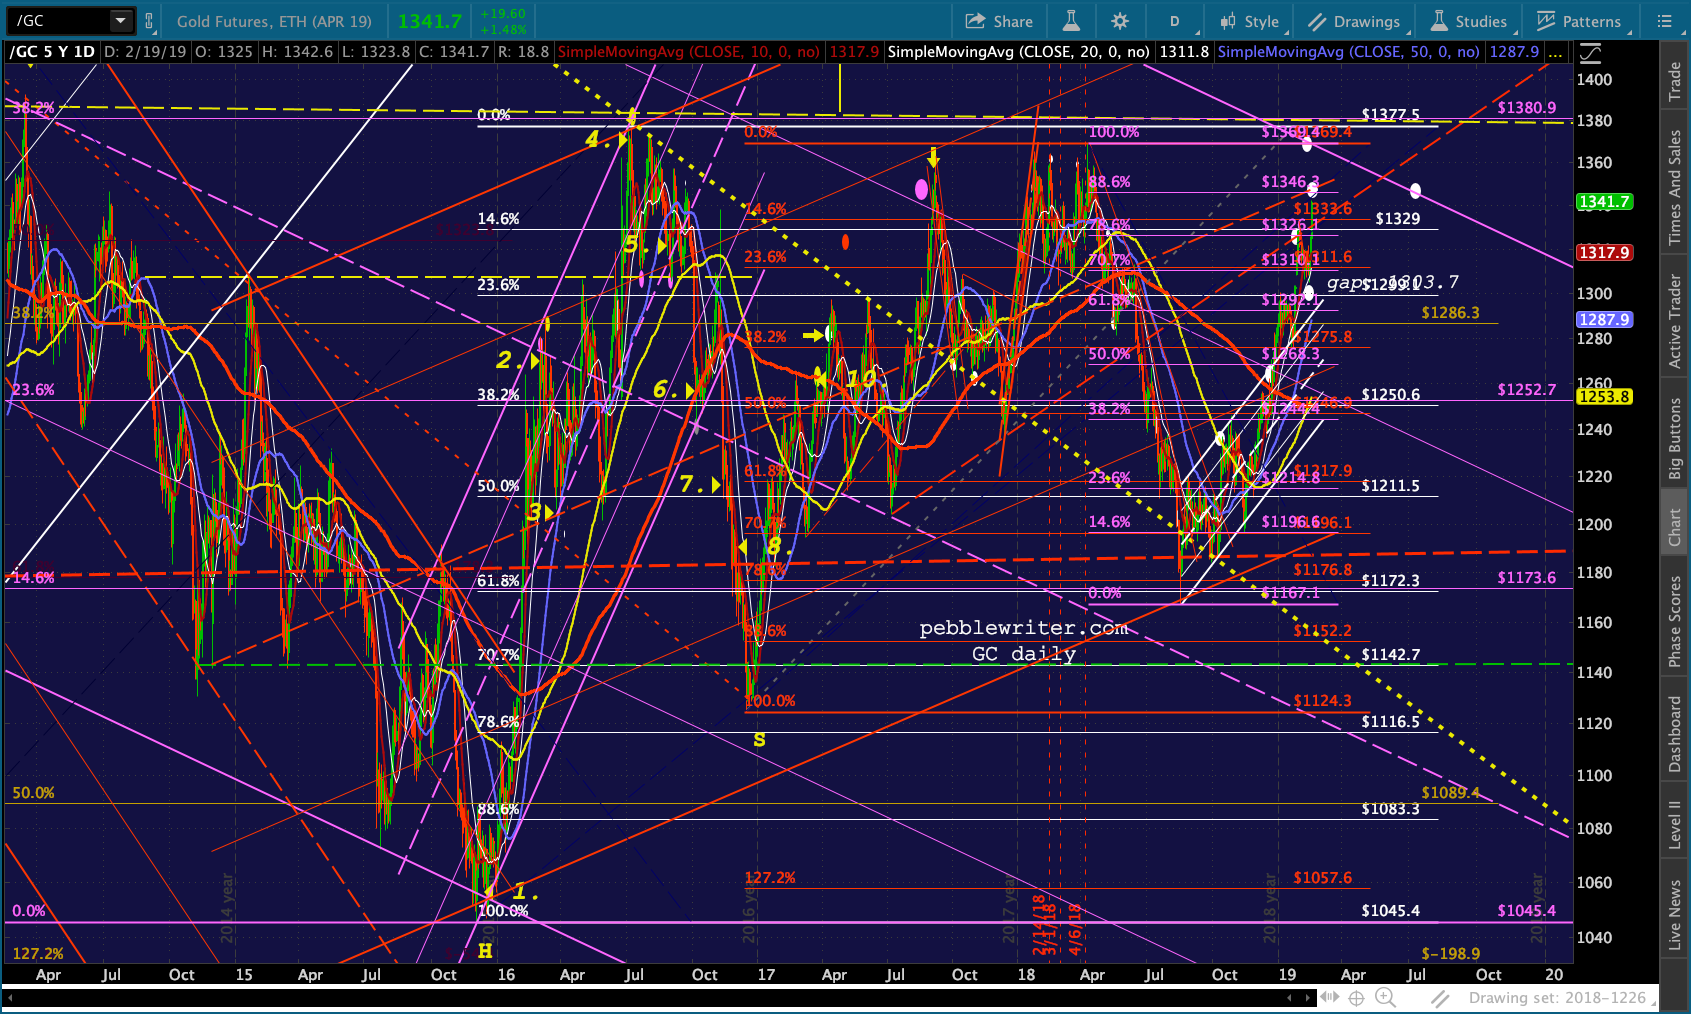
UPDATE: 1:15 PM
ES is inching toward 2786.25…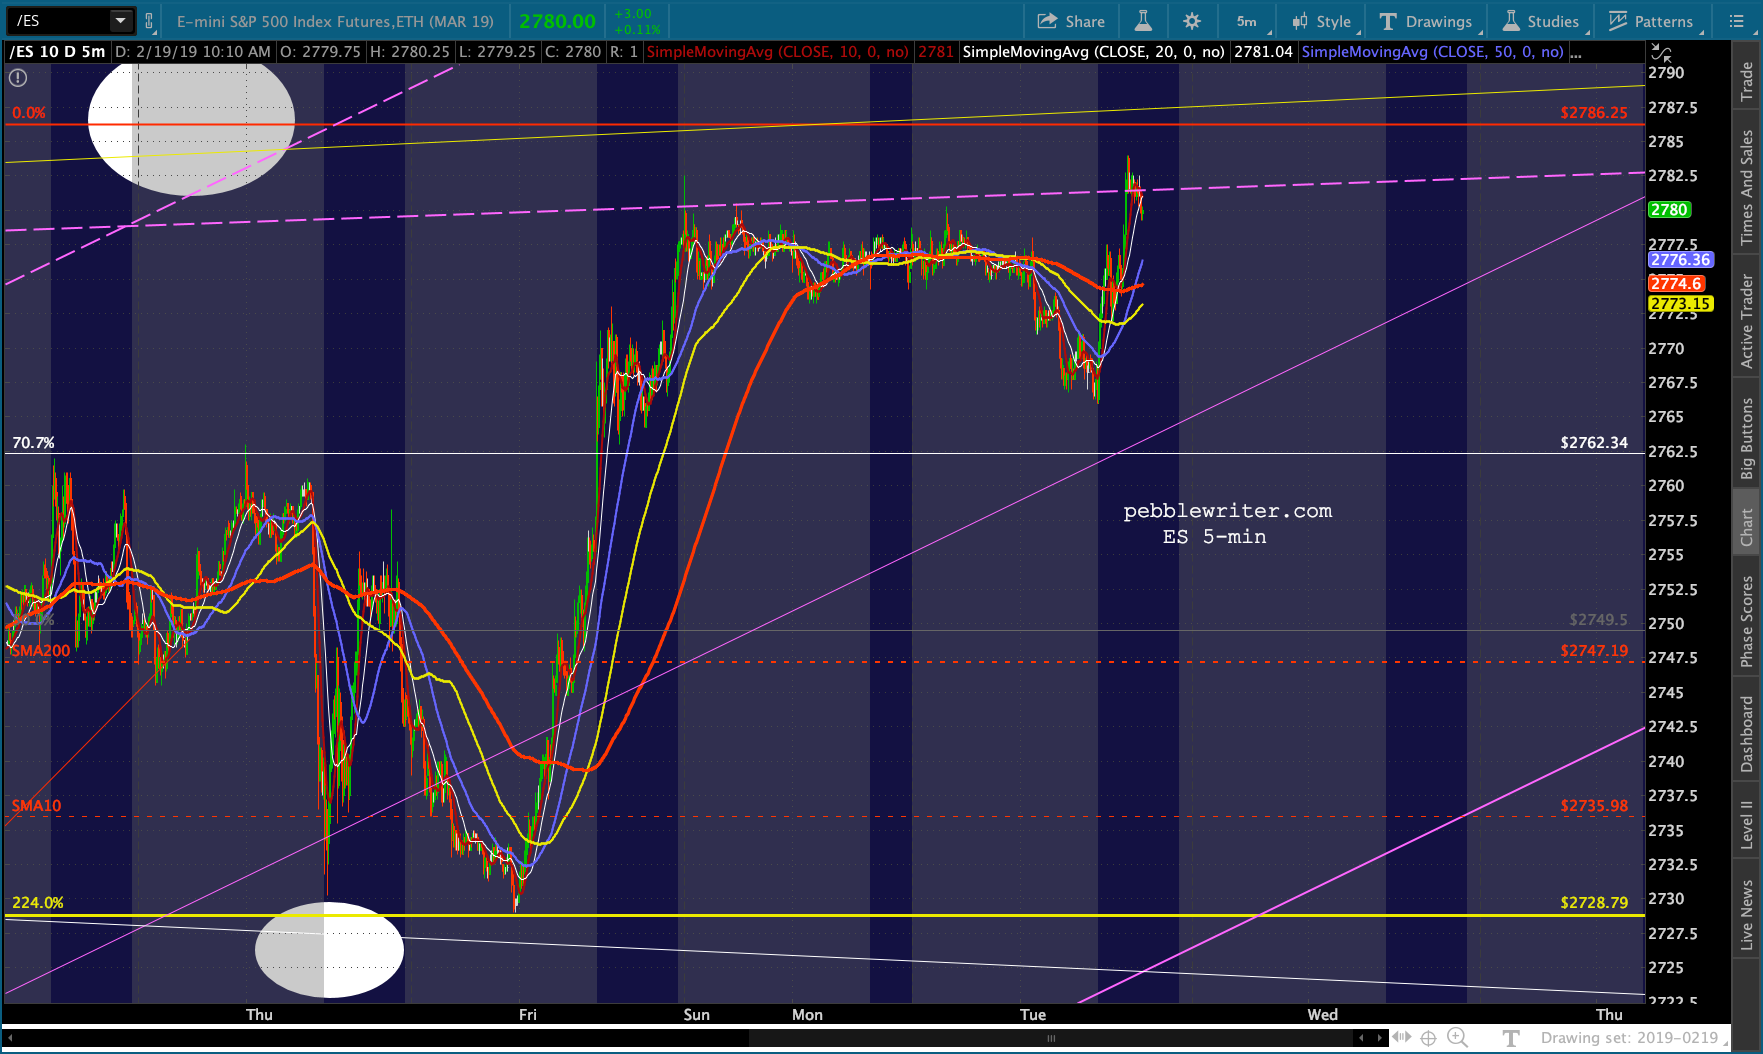 …as VIX is back down near its lows.
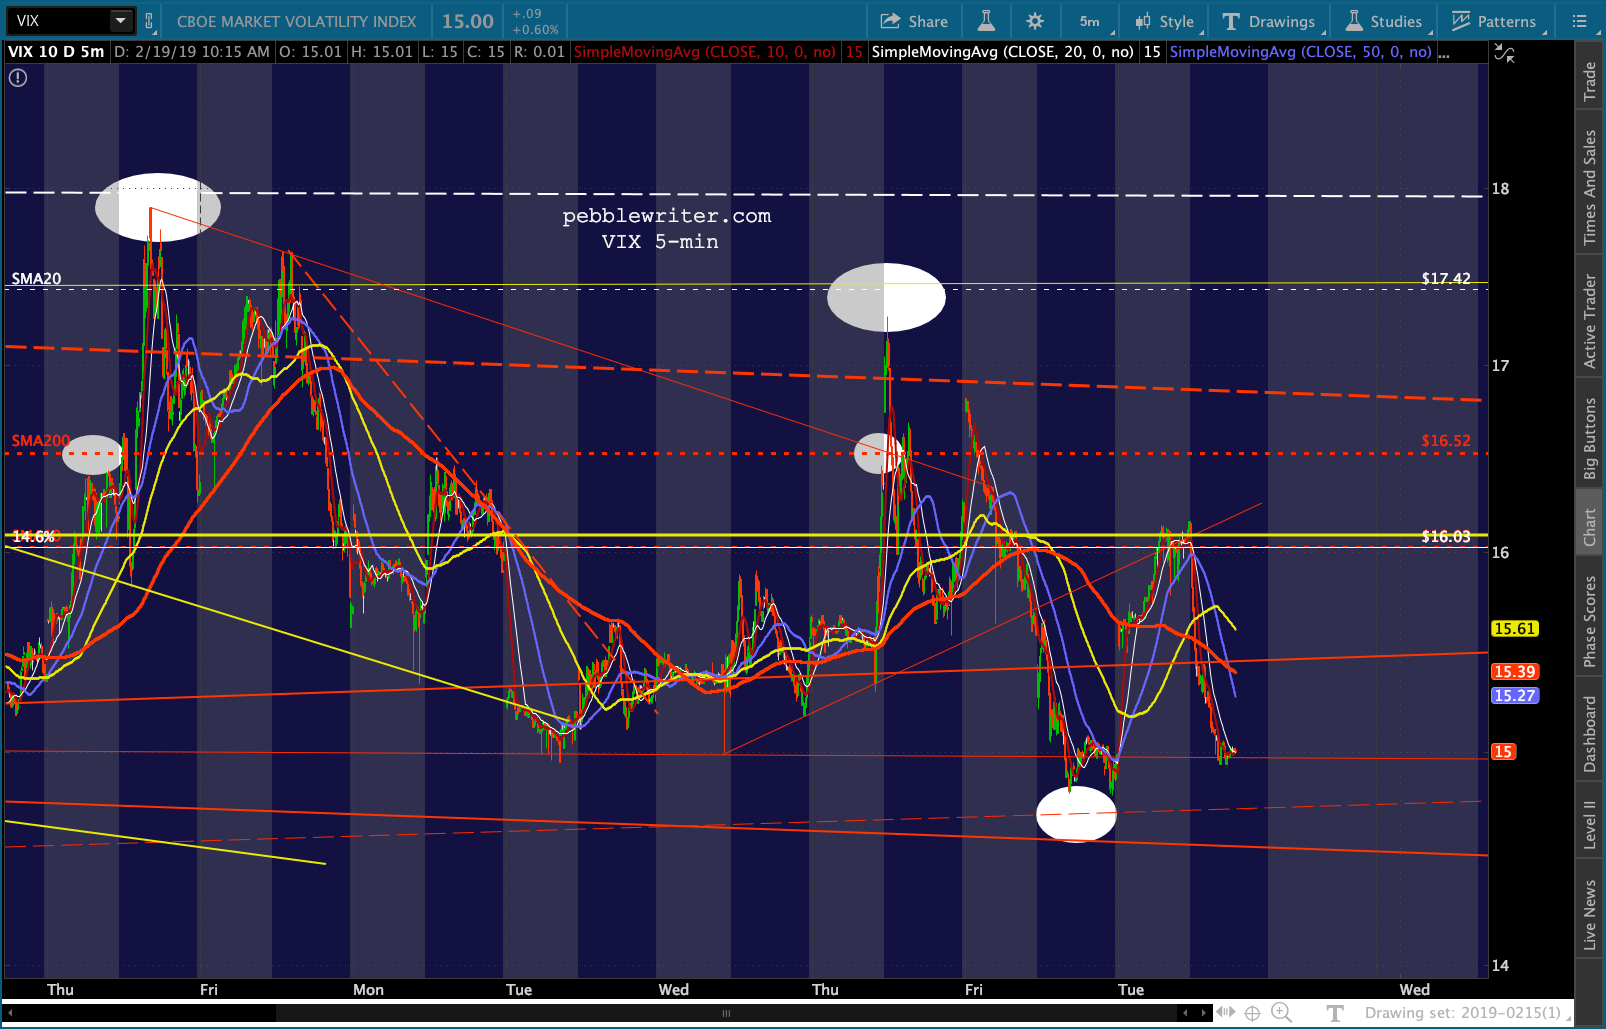
 Note that ZN has broken out very slightly…
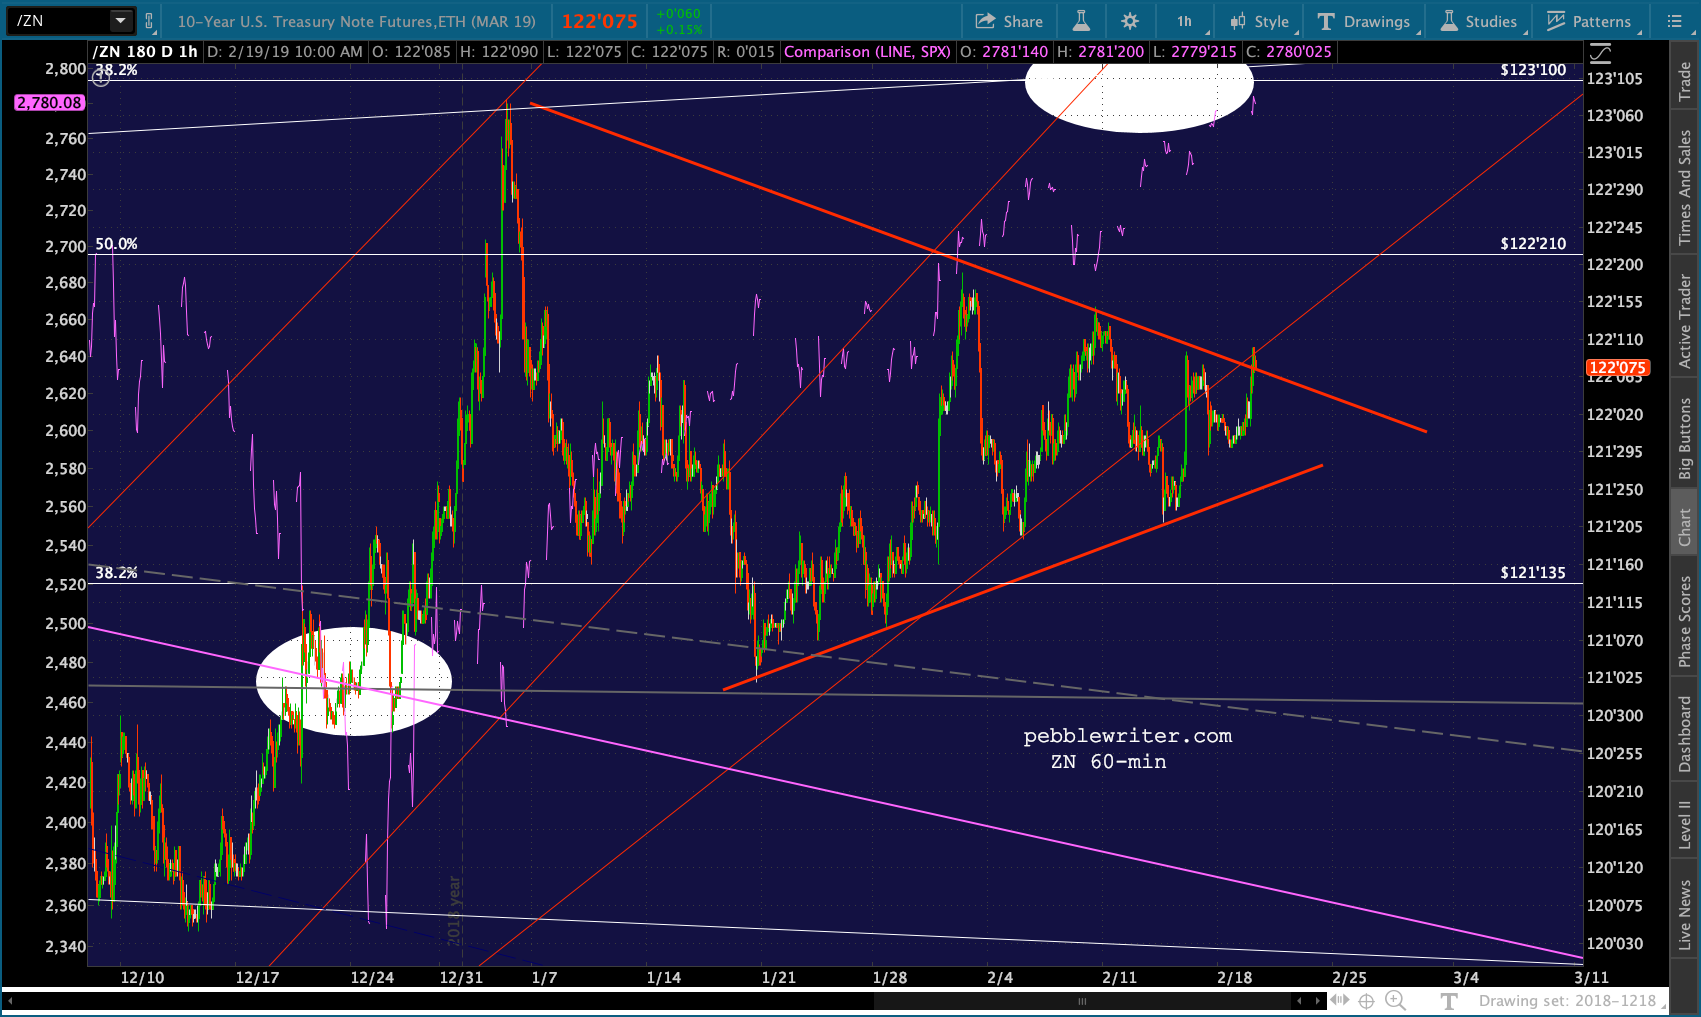
…as TNX continues to look more and more vulnerable. Gold: almost there.
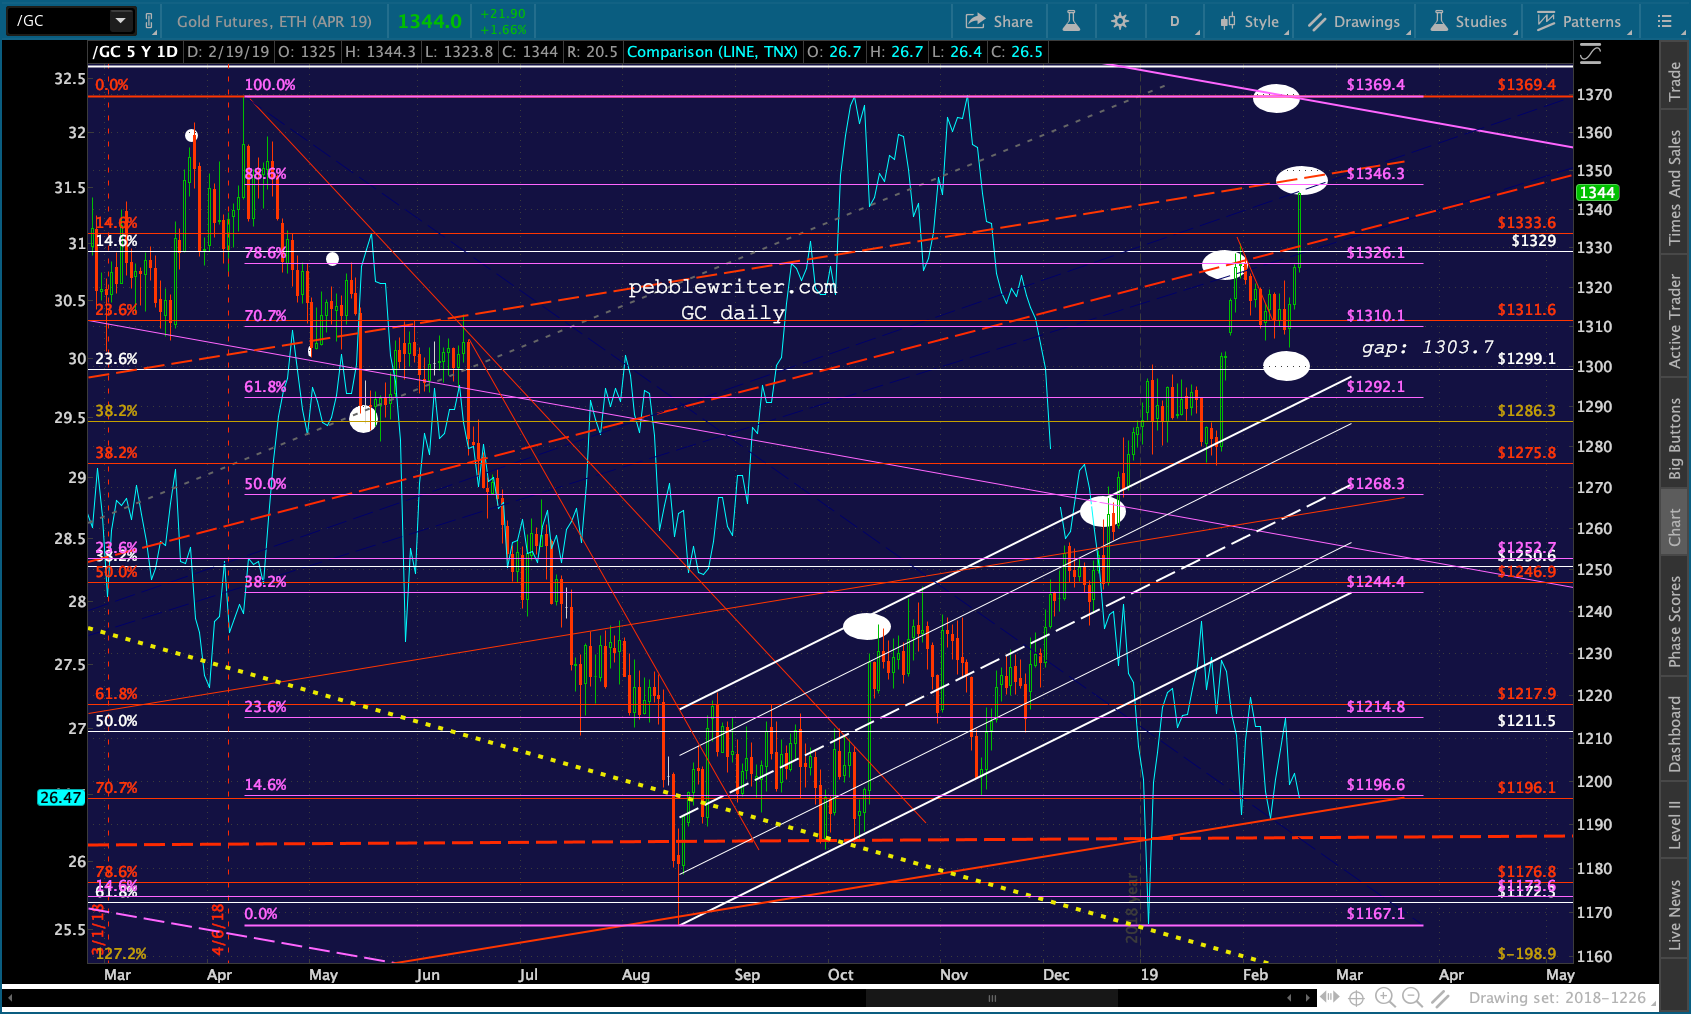 I have to run out for a series of meetings and might not make it back until late tonight. Will post if I get a chance.
GLTA.