

In our last update on the US Dollar [see: Sep 18 Update on DX] I theorized that the euro would play an important role in balancing the yen/oil/US dollar/stocks equation — a role that would see it break down soon.
EURUSD’s rising purple channel broke down after Brexit, backtested for the next two months, and has broken down again. If the channels and harmonics have anything to say about it, it has a long way to go.
EURUSD has dropped only 3% since that call (yellow arrow, below.) But, the pattern it’s establishing says a lot about what to expect from both currencies and stocks going forward. continued for members…
Note that EURUSD has essentially gone sideways since Mar 2015 — shortly before equities topped out in May. There was a very clear Flag Pattern setting up through May 2016, when the pair retraced about .886 of its drop from the Aug 2015 highs.
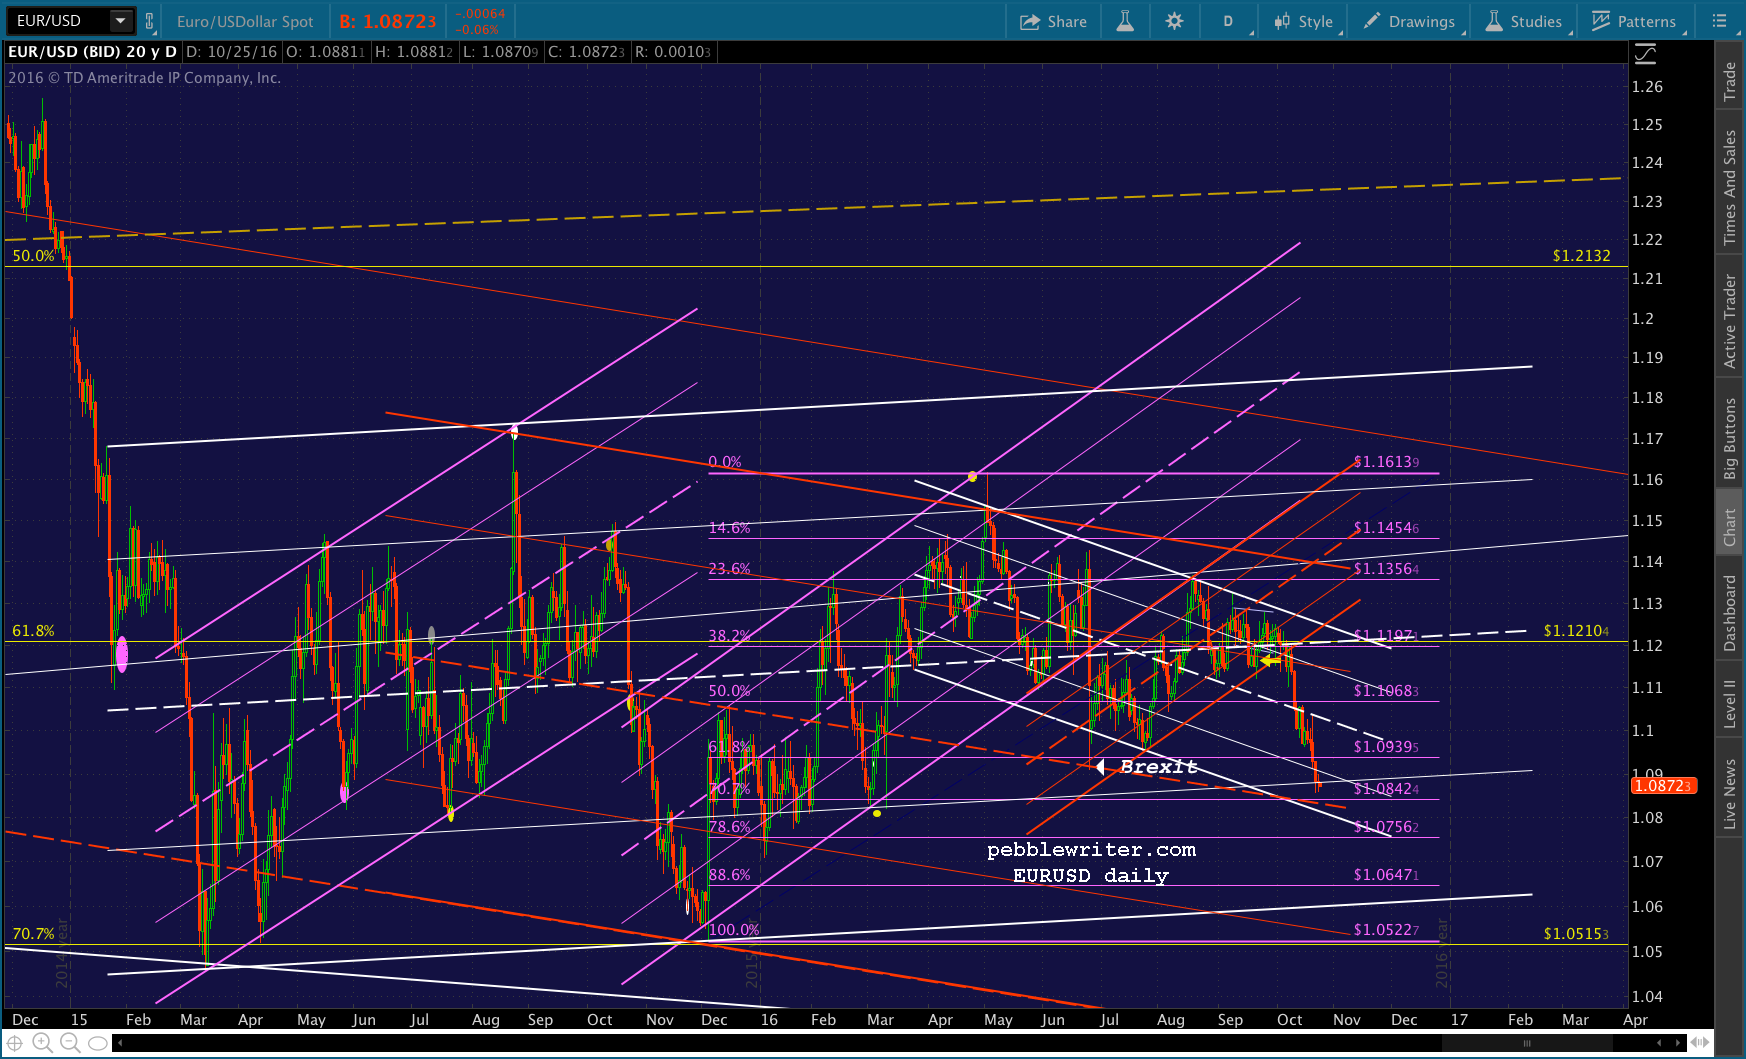
The Flag Pattern was being guided by the rising white channel. Note that the May 2016 reversal occurred at the channel’s .786 line. Ordinarily, such a reversal would result in a drop to the .236 line — as almost occurred post-Brexit.
The plunge was aborted, however, by support coming in at the purple .618 at 1.0939. Had the decline not been so rapid, I imagine we would have seen more synchronicity between tagging the .618 and the channel .236 line.
In any case, we got an A-B-C bounce up to the .236 Fib as TPTB scrambled to prevent a disaster. It was that bounce that formed a parallel channel that recently failed and ultimately allowed the .236 channel tag to take place just yesterday.
Ordinarily, we might expect a bounce here. And, the falling red channel, while admittedly a little forced, suggests it’s a real possibility — as does the small, falling white channel (even more forced) whose bottom is just below and the nearby .707 Fib. I’ll call that target 1.0812 – 1.0842.
The harmonics, however, don’t argue for much of a bounce. June’s .618 tag suggests a further drop to at least the .786 at 1.0756 and possibly the .886 at 1.0647. The big question is timing. To answer that question, we need to look at DX, which is on quite a tear.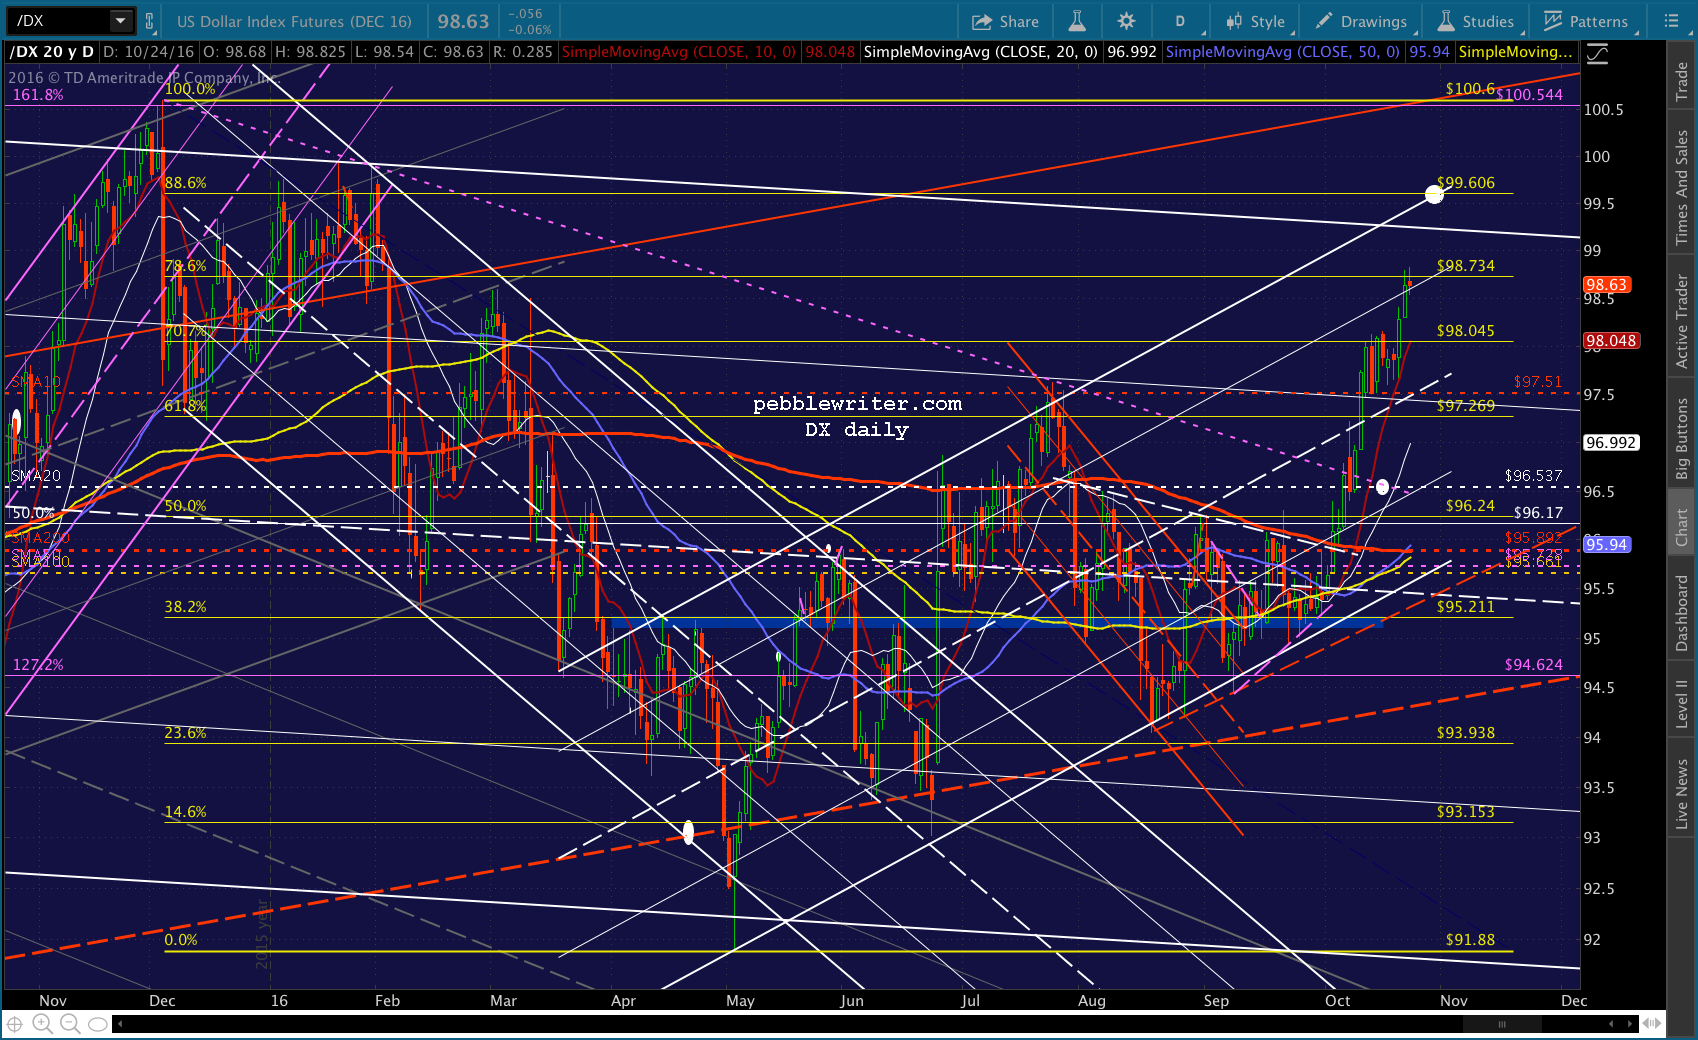
A nice reversal here at the .786 is possible; it would align with EURUSD’s1.0812-1.0842 target and could potentially reach the white midlineat 1.1210. But, the more significant target remains the .886 at 99.606, which could occur in a week or so. My gut tells me this target is the better bet. It would perhaps align with EURUSD’s drop to 1.0756 or 1.0647.
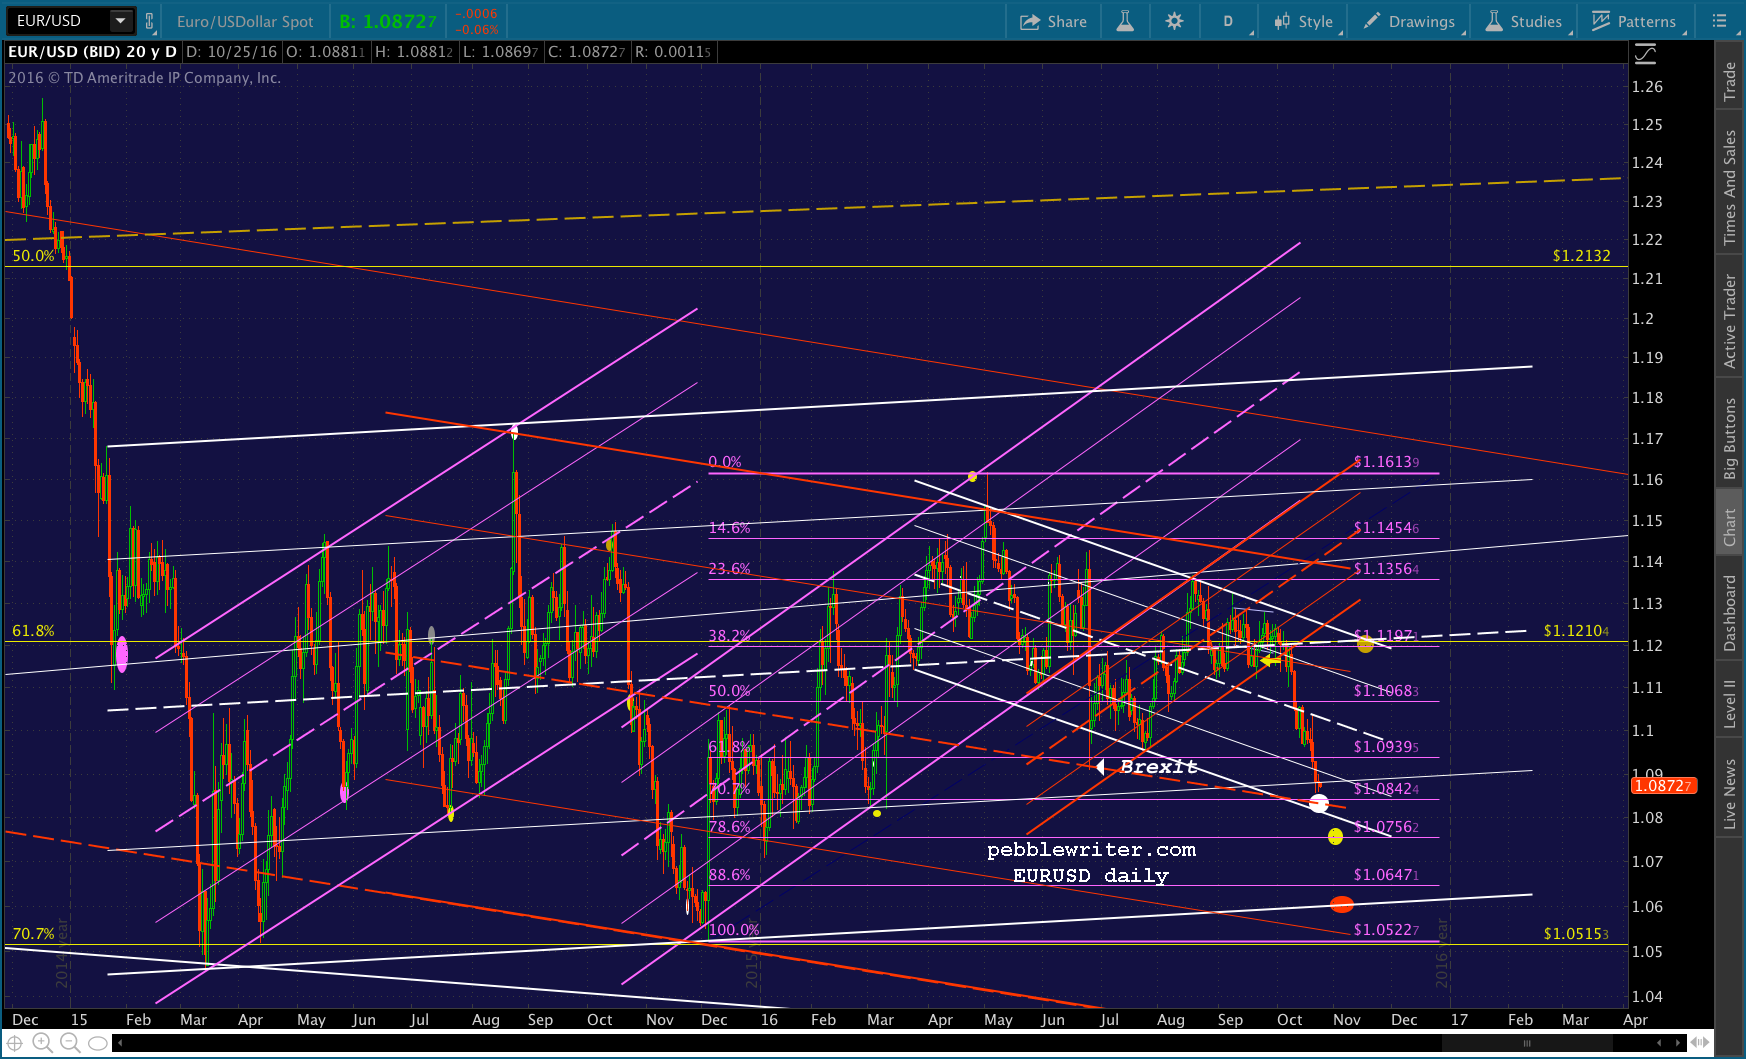
Trying to piece it together with the big picture is… interesting. I’m looking for stocks to sell off after the US election, which would usually result in higher DX. But, sometimes it doesn’t turn out that way, as the chart below shows.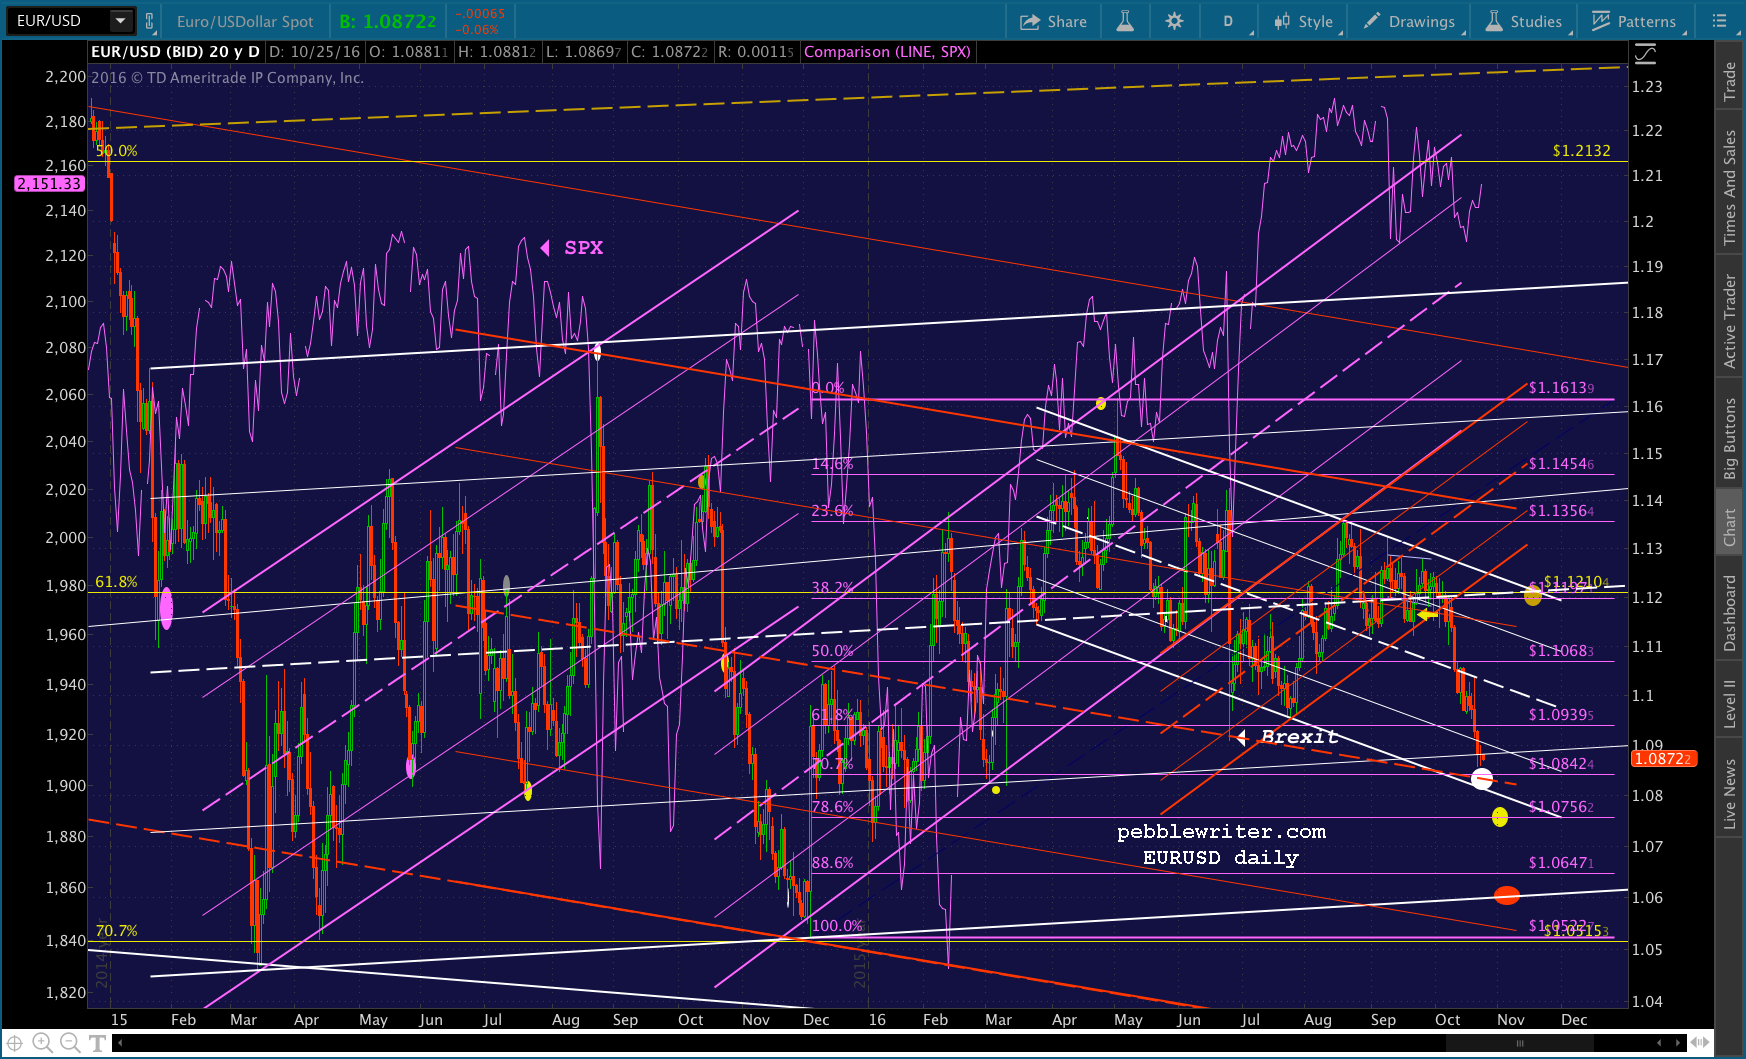
As we discussed in our last EURUSD post, the correlation has been all over the map. The divergence over the last 10 days has been striking, though nothing like the divergence that has occurred since April 2014.
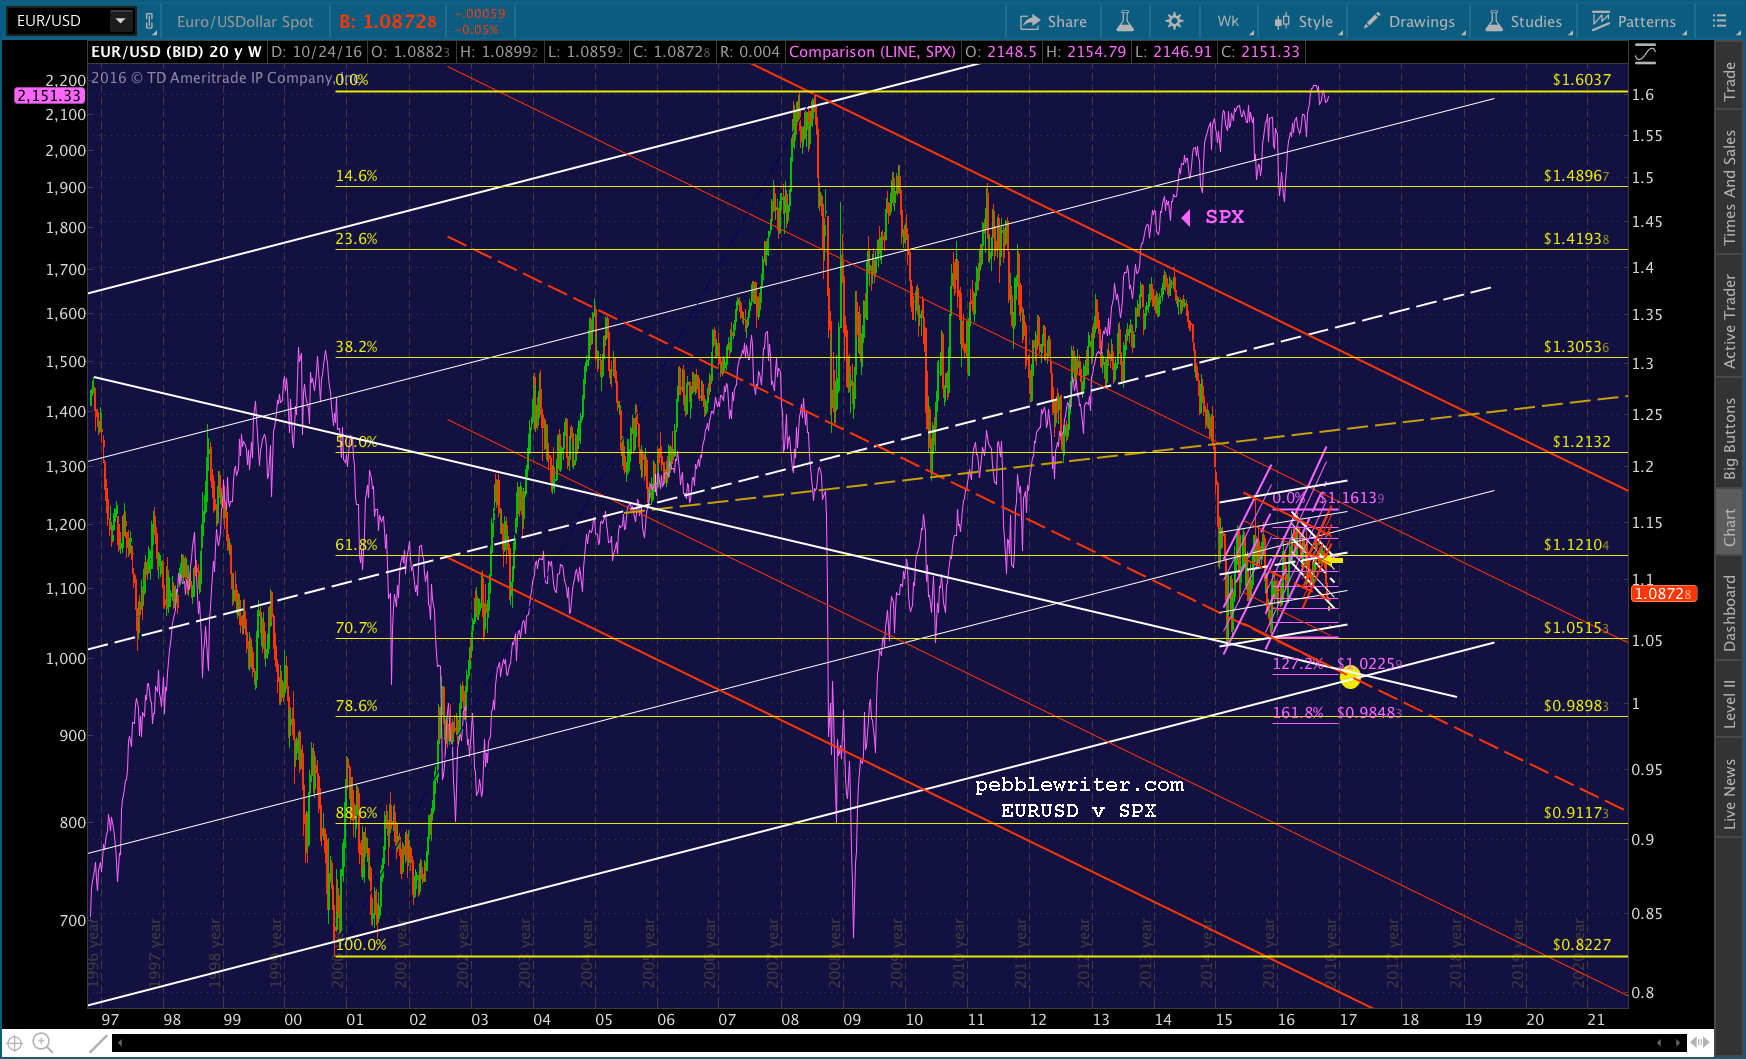
It is this chart that suggests EURUSD will blow through those Fib levels mentioned above and head straight for the rising white channel bottom at 1.0602. And, unless Draghi and friends panic (of course they will!) the next lower target would be just above parity at about 1.0225 (the yellow dot.)
Bottom line, the EURUSD has mostly lost its ability to influence SPX. It has much less influence than USDJPY, which has much less than CL. I’ve heard speculation that the euro will become the next yen carry trade. But, frankly, I don’t think it has much potential.
True, eurozone rates are extremely low — lower than US across the board. But, I don’t think the currency has the headspace to make a meaningful here. The bottom of the rising white channel is around 1.0225 – only 6% lower. If the Flag Pattern breaks down, then we’ll see.
The problem, though, is that a rapidly declining euro has heretofore been associated with equity weakness. And, like the US and Japan, it would produce real, live inflation that wouldn’t jive with the ECB’s justification for the easing which is propping up stocks.
Taking all that into account, I think the most likely path is a bounce at one of our downside targets (1.0842, 1.0756 or 1.06) followed by a rebound back to the white channel midline — currently at 1.1210. But, frankly, I see other, more interesting and predictable trading vehicles out there. I’d steer clear of EURUSD for the time being.
GLTA.