

As we expected [see: Dollar Duldrums] the US dollar has continued to slide. Today’s price action threatens to take out the November 27 low and reach our 91.483 target.
 Today, we’ll update some key currency pairs and see if we can make sense of the bond market.
continued for members…
Recall that our current forecast calls for new lows if/when 91 doesn’t hold. The purple 1.272 and white 1.618 line up very nicely with the midline of the huge rising white channel from 2003 and the .618 retracement from the May 8, 2014 lows.
I think we would have reached it already if not for the need to prop up stocks going into the year end.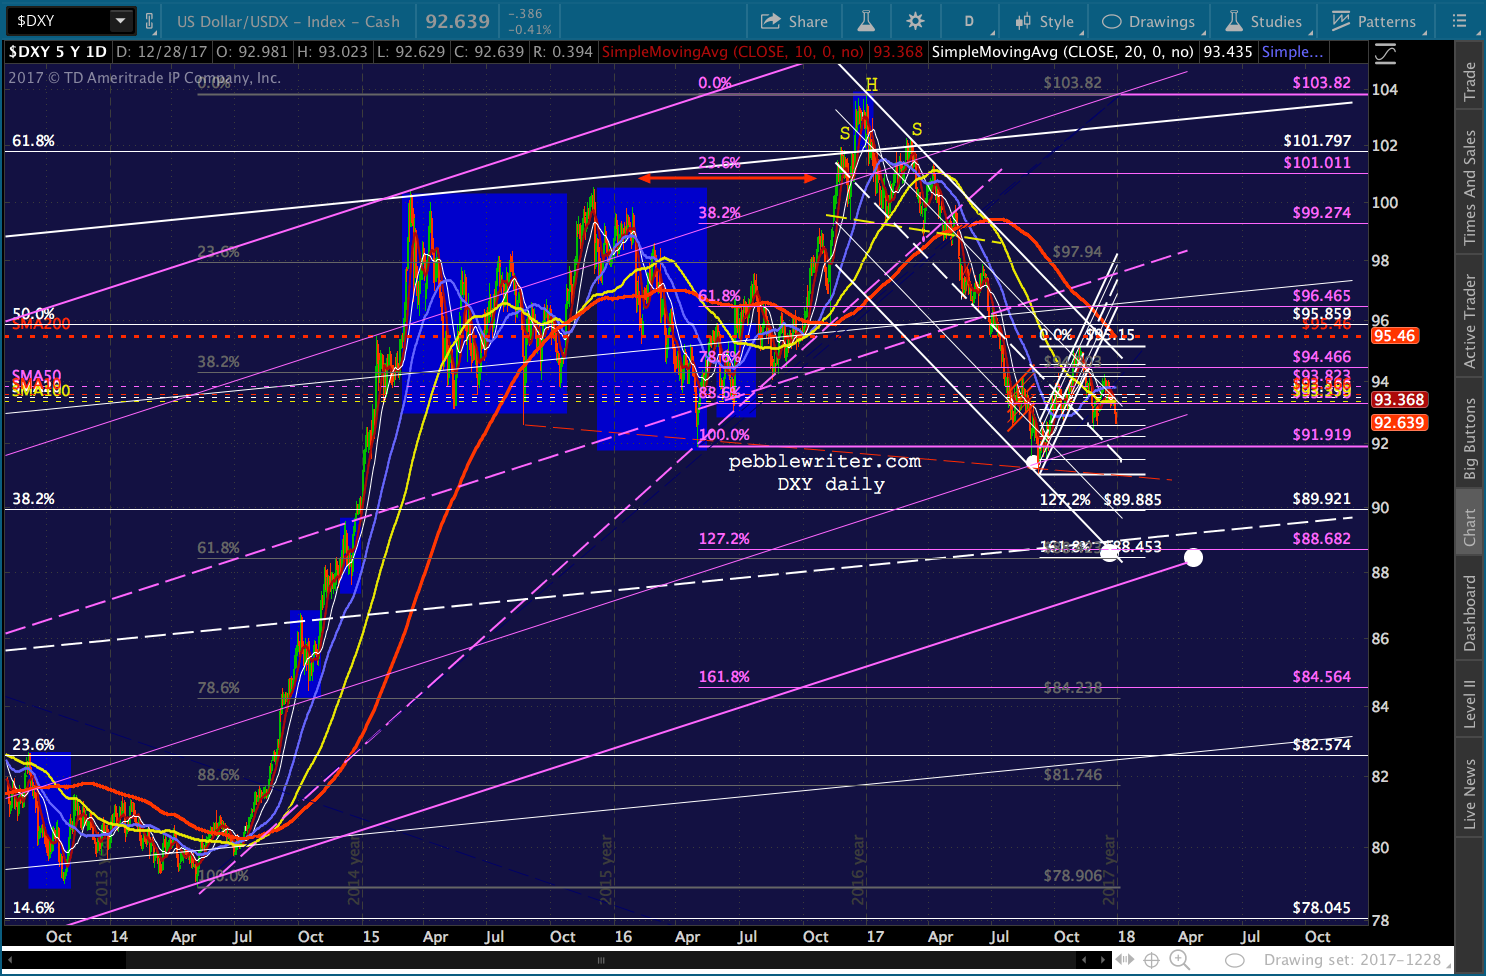 If the rising purple channel should break down at that point, it opens up the lower half of the rising white channel. We get a nice intersection of the red .618 and white channel .236 line at 83.351 in March 2019 and the red .786 and channel bottom at 77.786 in June 2019.
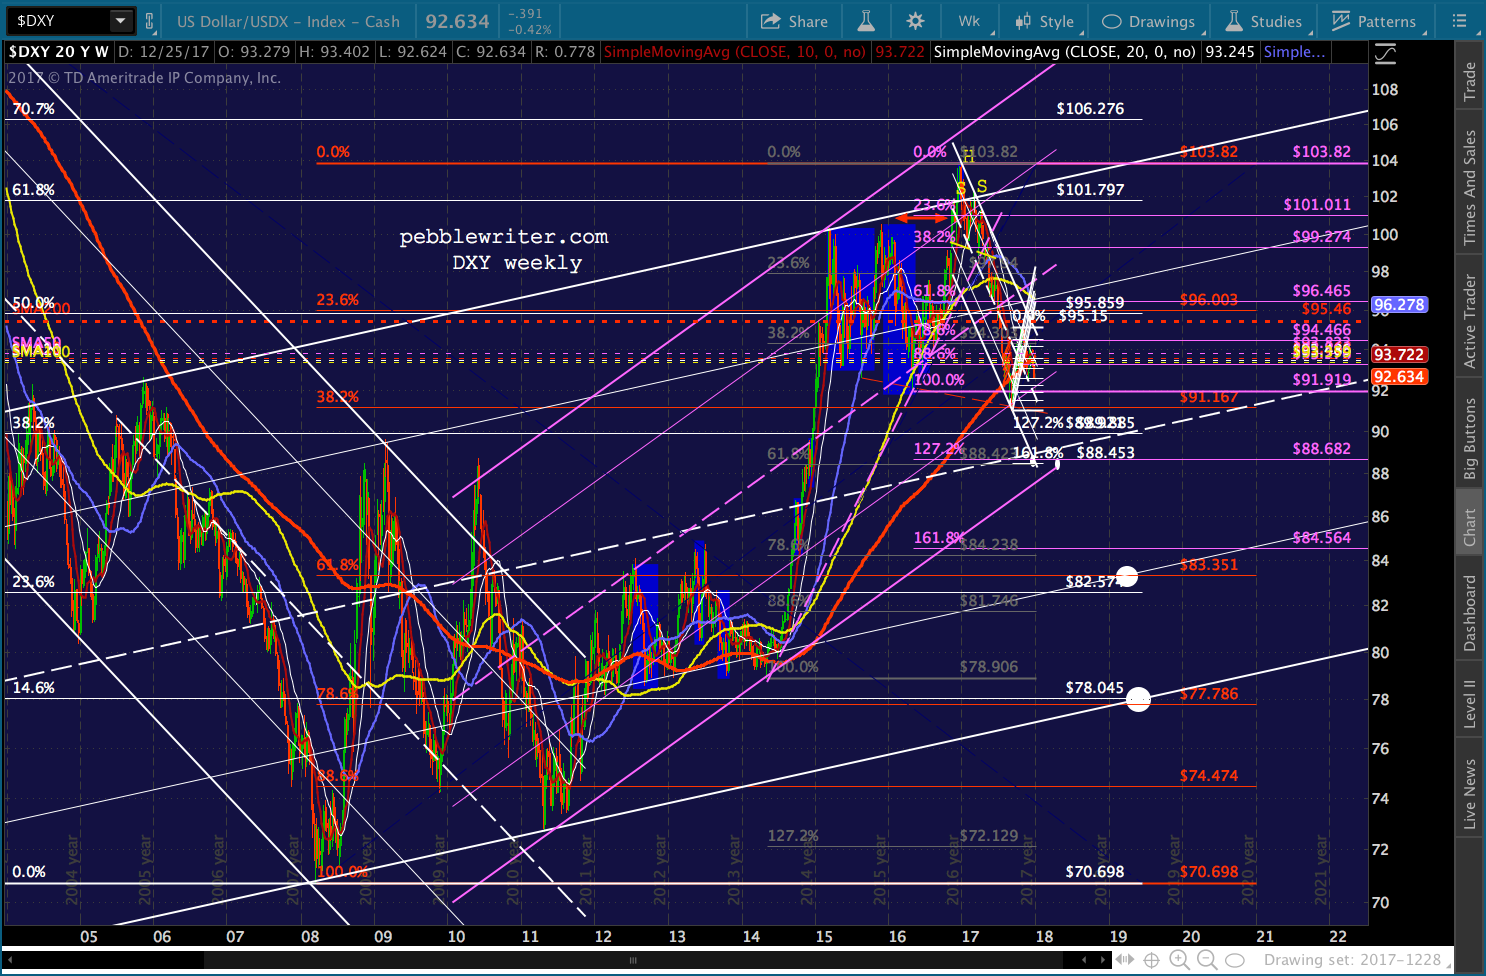 There are obviously some serious implications of such a move. First, it would mean that the USDJPY and, thus, the yen carry trade have fallen apart. This would spell serious trouble for the stock market.
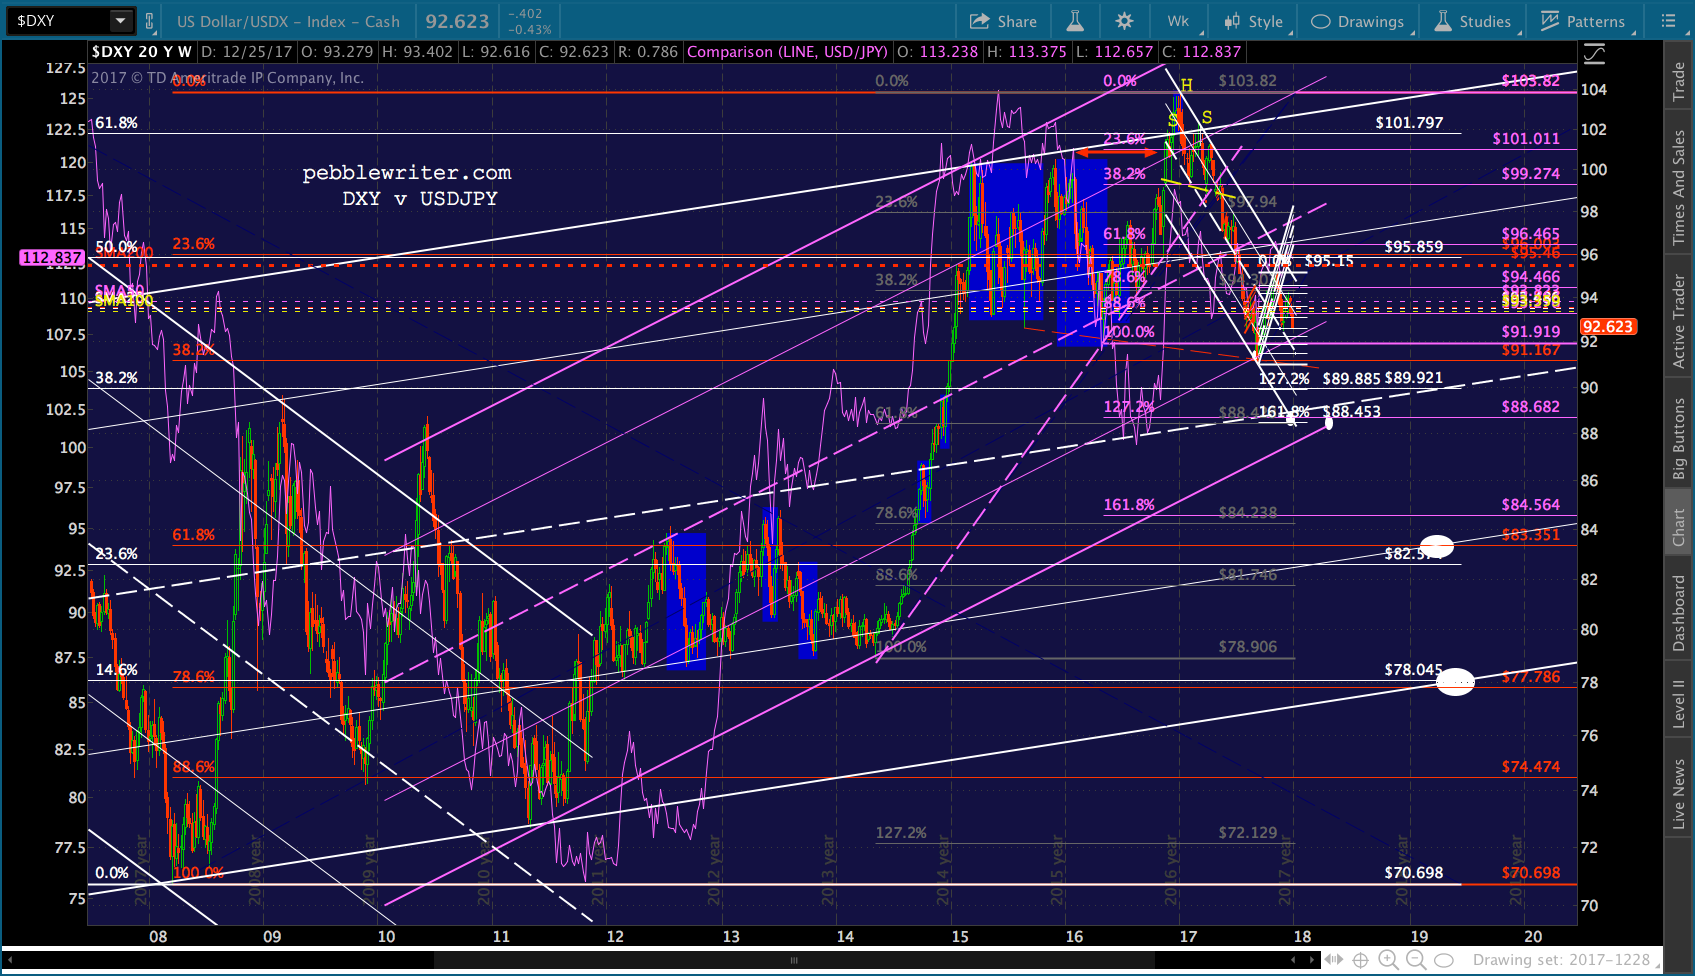 Could the yen really strengthen that much relative to the dollar? It would presumably mean more easing by the Fed than by the BoJ — which to me would require a recession. I have no problem with the assumption of an official recession by 2019. Statistically, we’re long overdue. And, since Japanese rates are already at the zero bound (and negative) the Fed could presumably adopt a relatively more accommodative stance going forward.
Second, it would mean the EURUSD continuing to strengthen (i.e., the dollar continues to weaken relative to the euro.)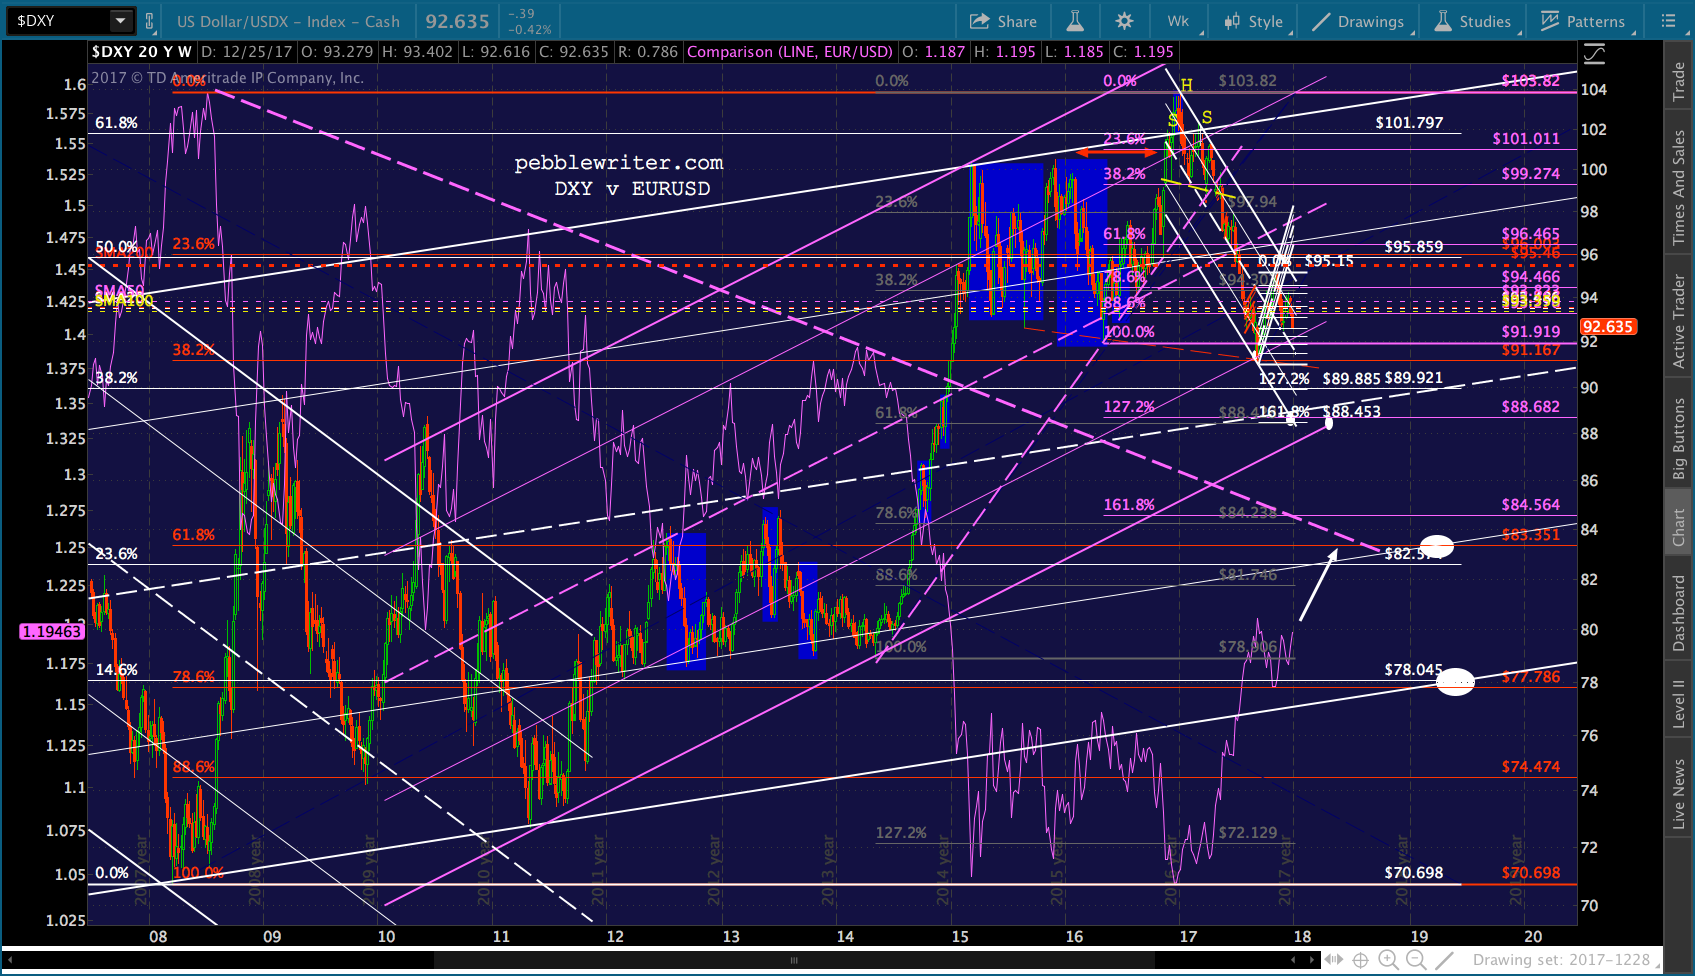 I’ll update the EURUSD forecast shortly. But, suffice it to say that it (1) hasn’t broken down as the charts suggested, and (2) it has room to run in terms of the TL connecting the tops of the past 10 years.
Last, a breakdown of the purple channel would probably require a significant move in bonds. The 10-yr yield (TNX) is currently bumping up against a TL dating back to June 2008. As the chart below shows, its biggest moves have been negatively correlated to the DXY.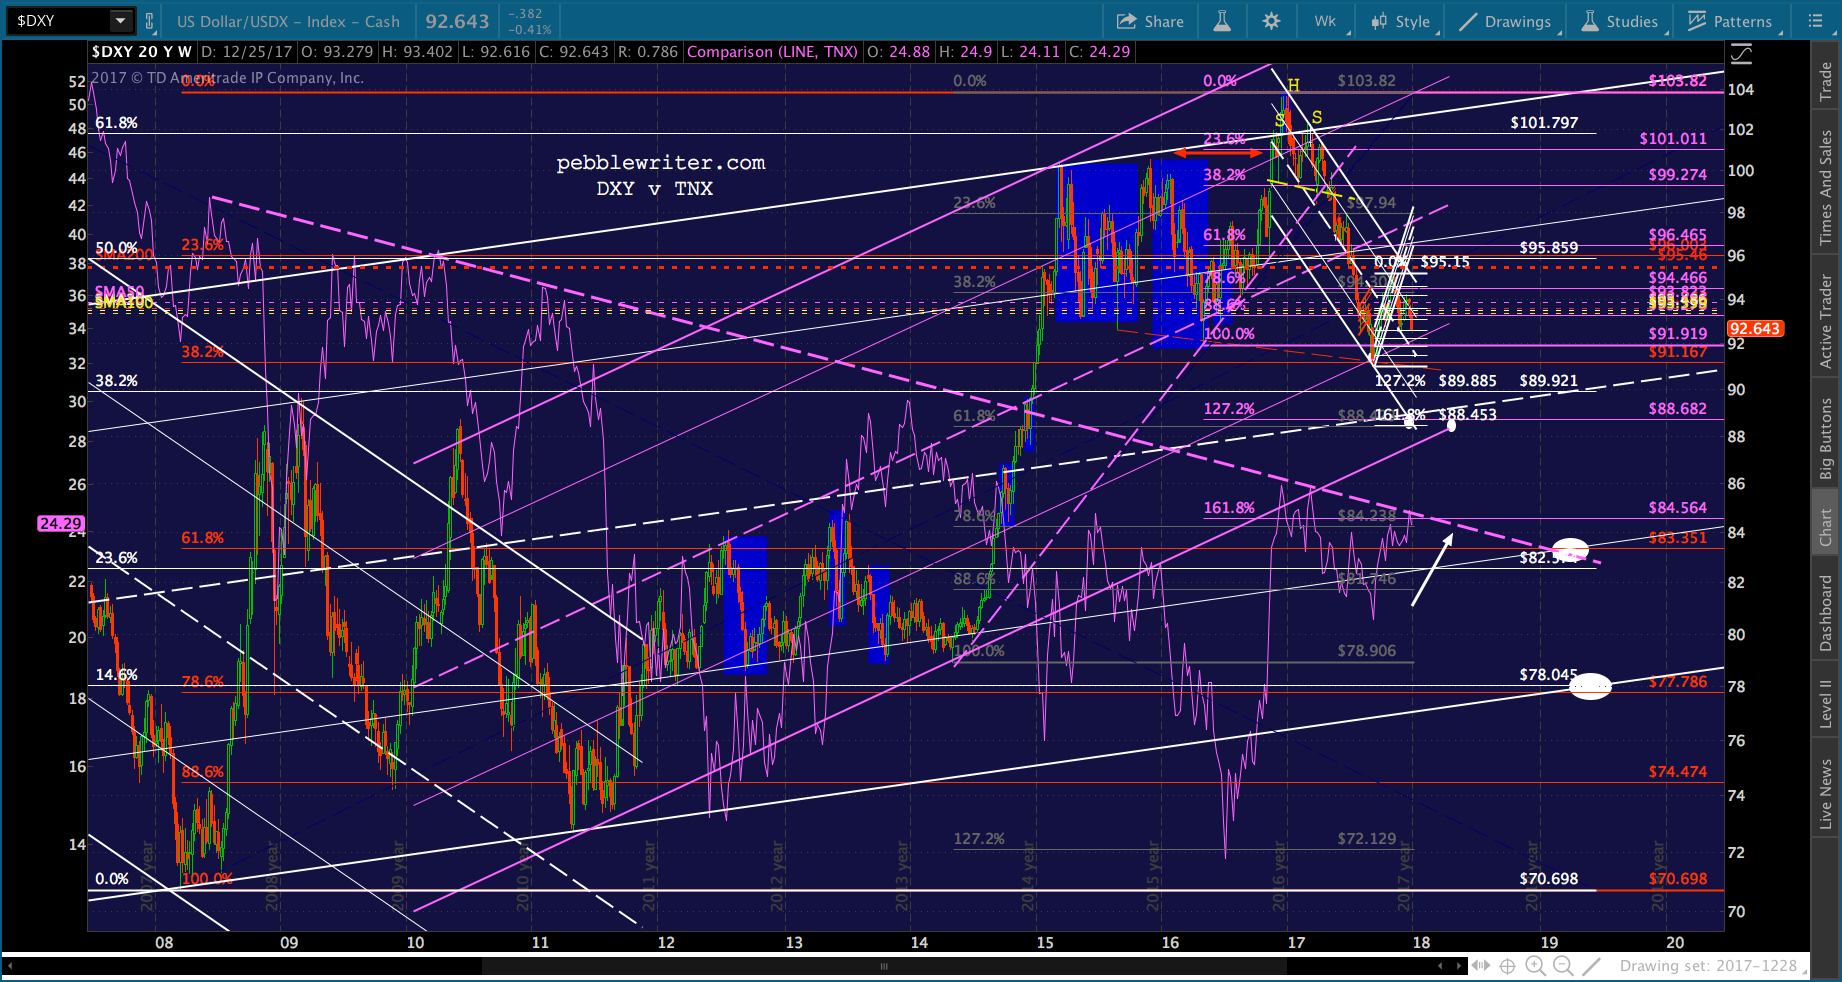 There are some notable exceptions, though. Since Nov 2015, they have moved largely in tandem. DXY peaked in Dec 2016 and zig zagged lower until Sep 2017, at which point it rallied until Oct 2017 before heading lower to its current levels.
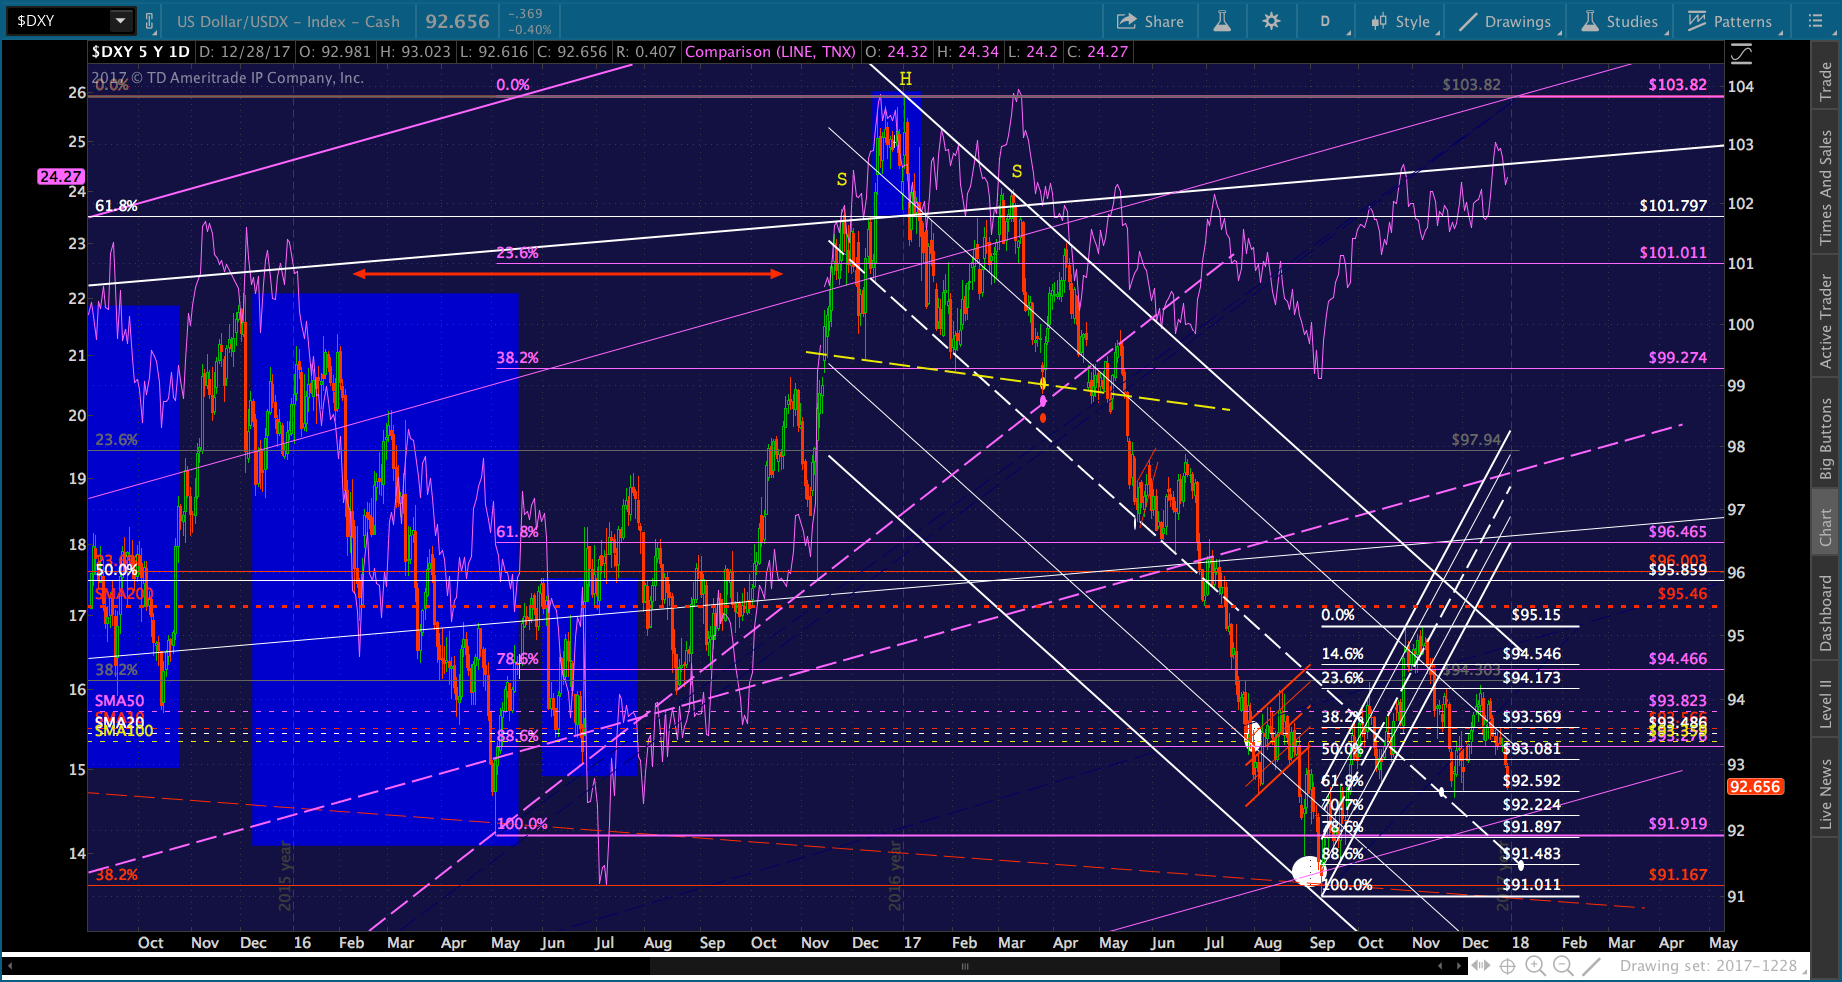 TNX did the same, but the rise from Sep 2017 hasn’t broken down as DXY did. So far, it’s all higher lows and occasional higher highs.
We’ll dig into this a bit more in an upcoming bond market post. I’ll be back this afternoon with the currency updates.