As S&P 500 futures approach our next downside target, it’s time to wade into the most humbling exercise we ever undertake: a look at what to expect for the coming year.
 continued for members…
First, a quick overview of where we are relative to our recent charts’ forecast. We’ll expand each section as we go.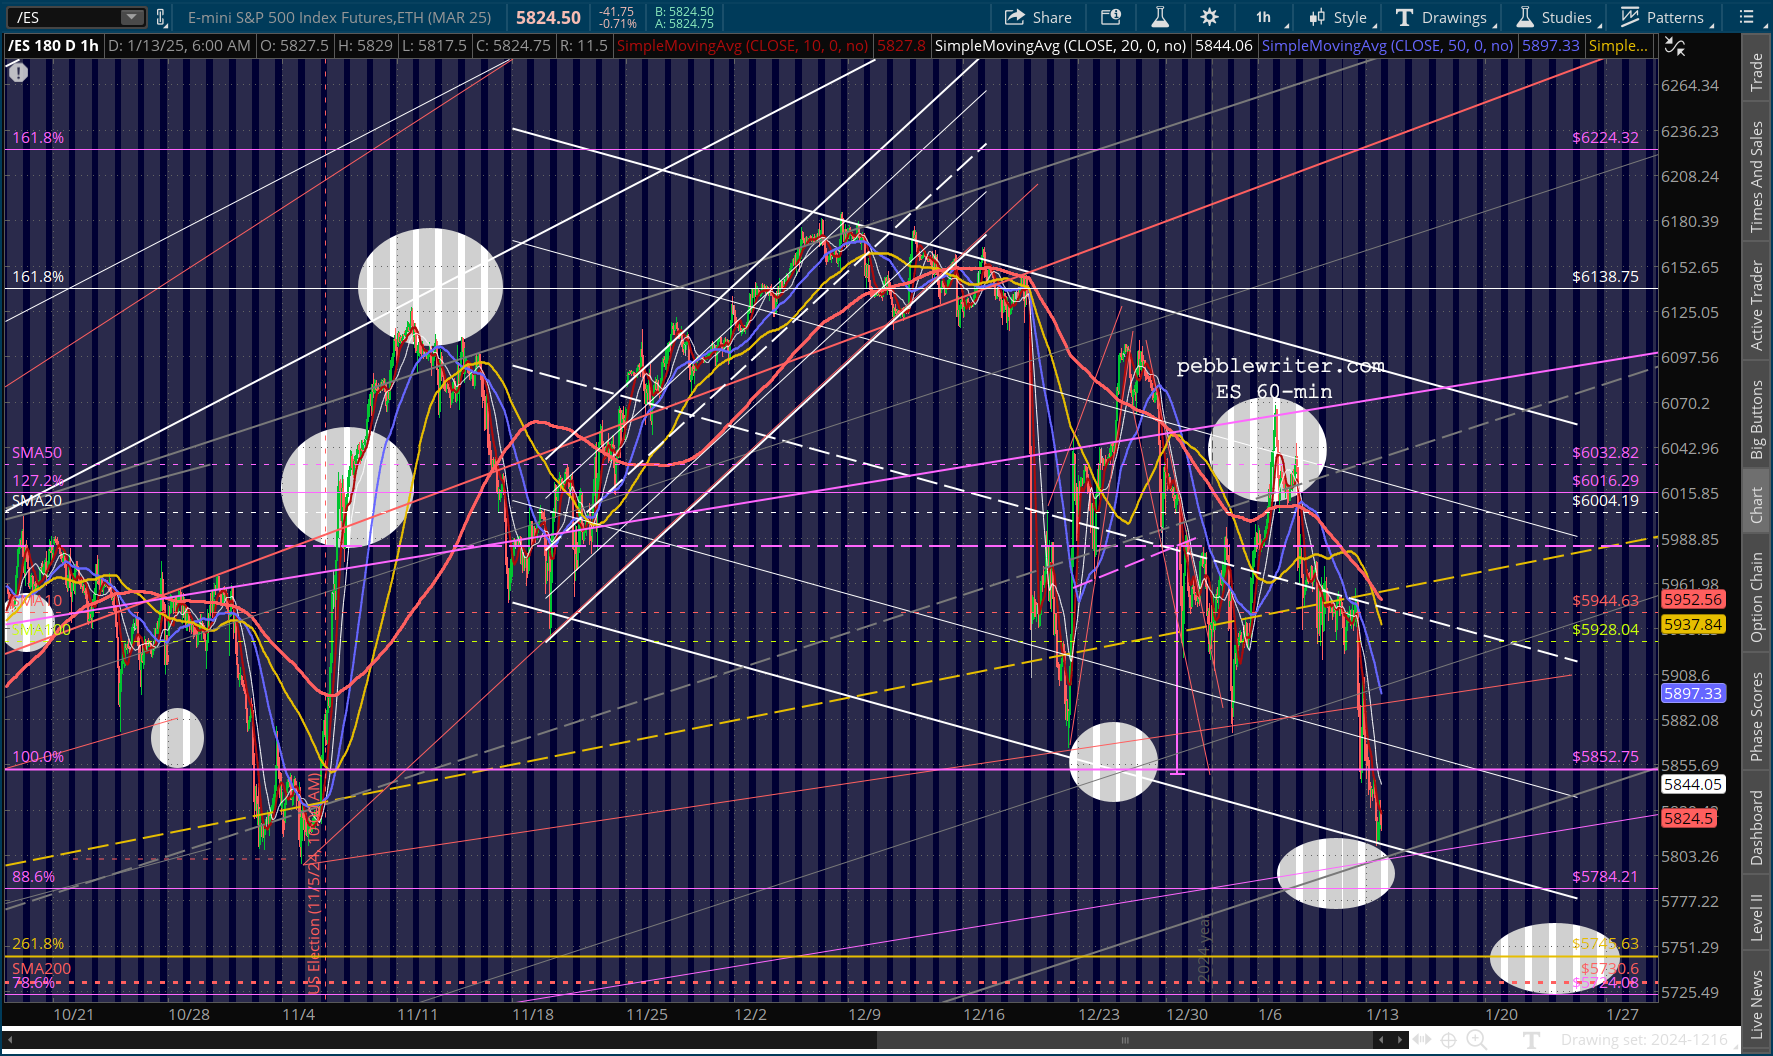
EQUITIES:
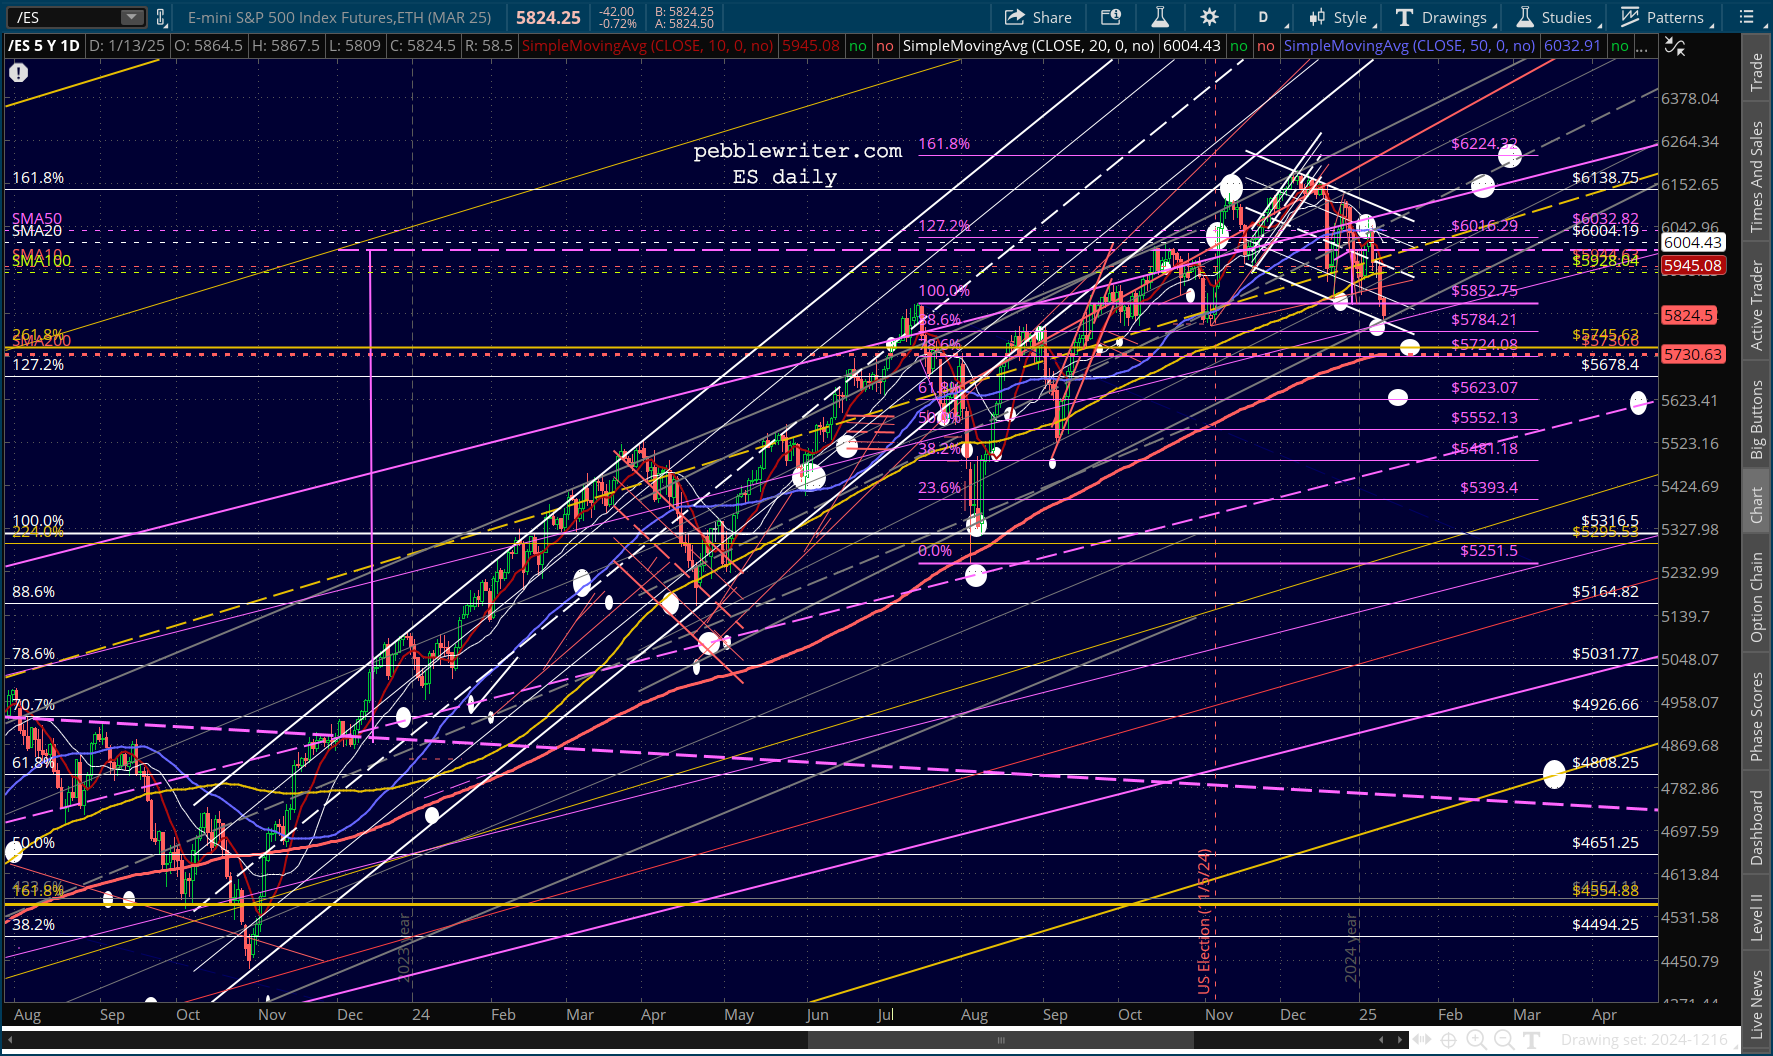
We have been looking for a backtest of several targets ever since SPX topped the Jan 2022 highs at 4818 – which was just shy of the purple 2.24 extension. We never backtested 4818, so we set our sights on a backtest of the white 1.272 at 5170 and white 1.618 at 5638 which was very close to SPX’s IH&S target at 5727.

 I generally operate under the assumption that TPTB would like to keep the bull market alive, but are willing to allow controlled declines from time to time to keep the market rational – not to mention to take advantage of bears.
Now and then, of course, the declines go beyond “controlled” and things get out of hand. At other times, the enthusiasm of rising prices gets out of hand and we get bubbles. I think we’ve been in a bubble for most of 2024 – with no backtests of much consequence except for the yellow channel (from 2009) lines – notably the midline which marked the Apr and Aug 2024 lows. Note that it also marked the July 2023 highs and Sep and Oct 2020 lows.
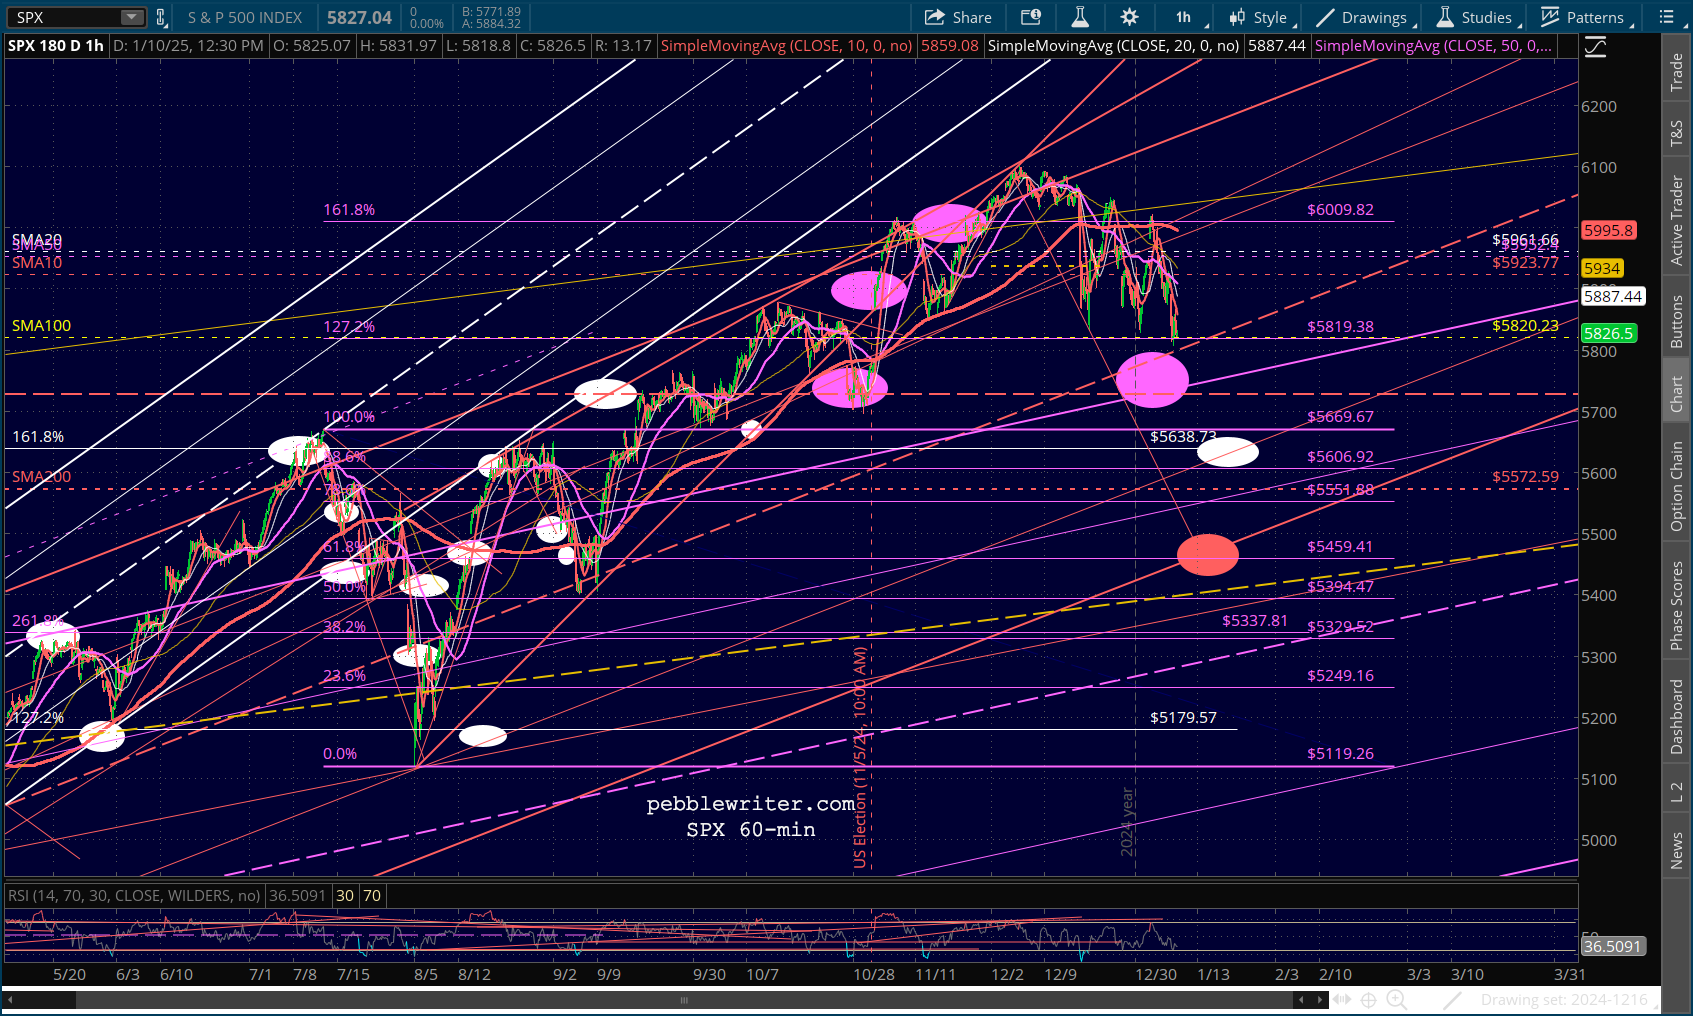
 The yellow midline is currently around 5384, which would be a 11.7% decline from recent highs. If a backtest were to take a while, say towards the end of February, then it would represent a more palatable 10.4% decline that would intersect with the purple .618 at 5459.
Of course, this would mean a dip below the SMA200 which is currently at 5575. Thus, we have to account for a potential rebound at the SMA200 which would likely take place at the white 1.618 at 5638 or the purple 1.000 at 5669.
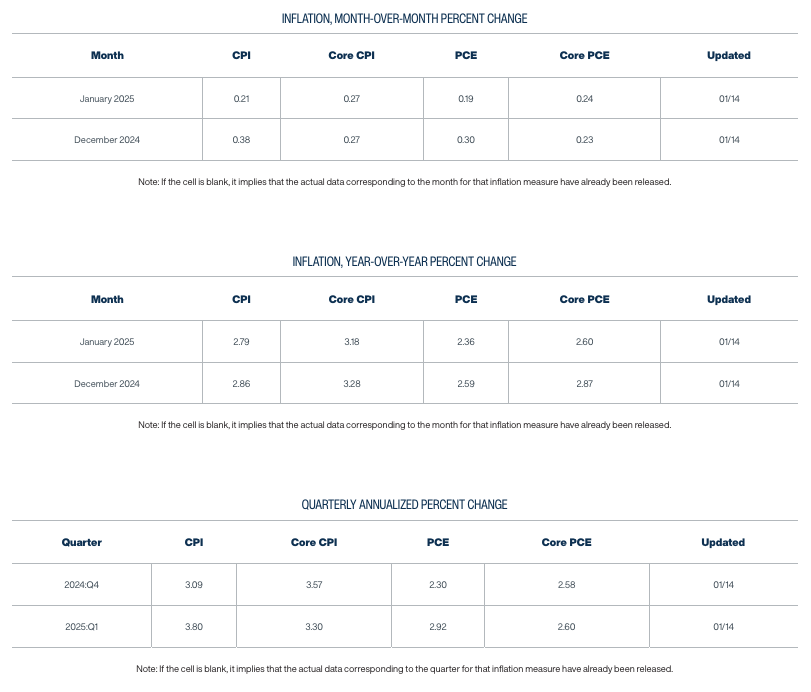
The timing on each of these is tricky. But, I think it will come down to the December and January CPI prints.
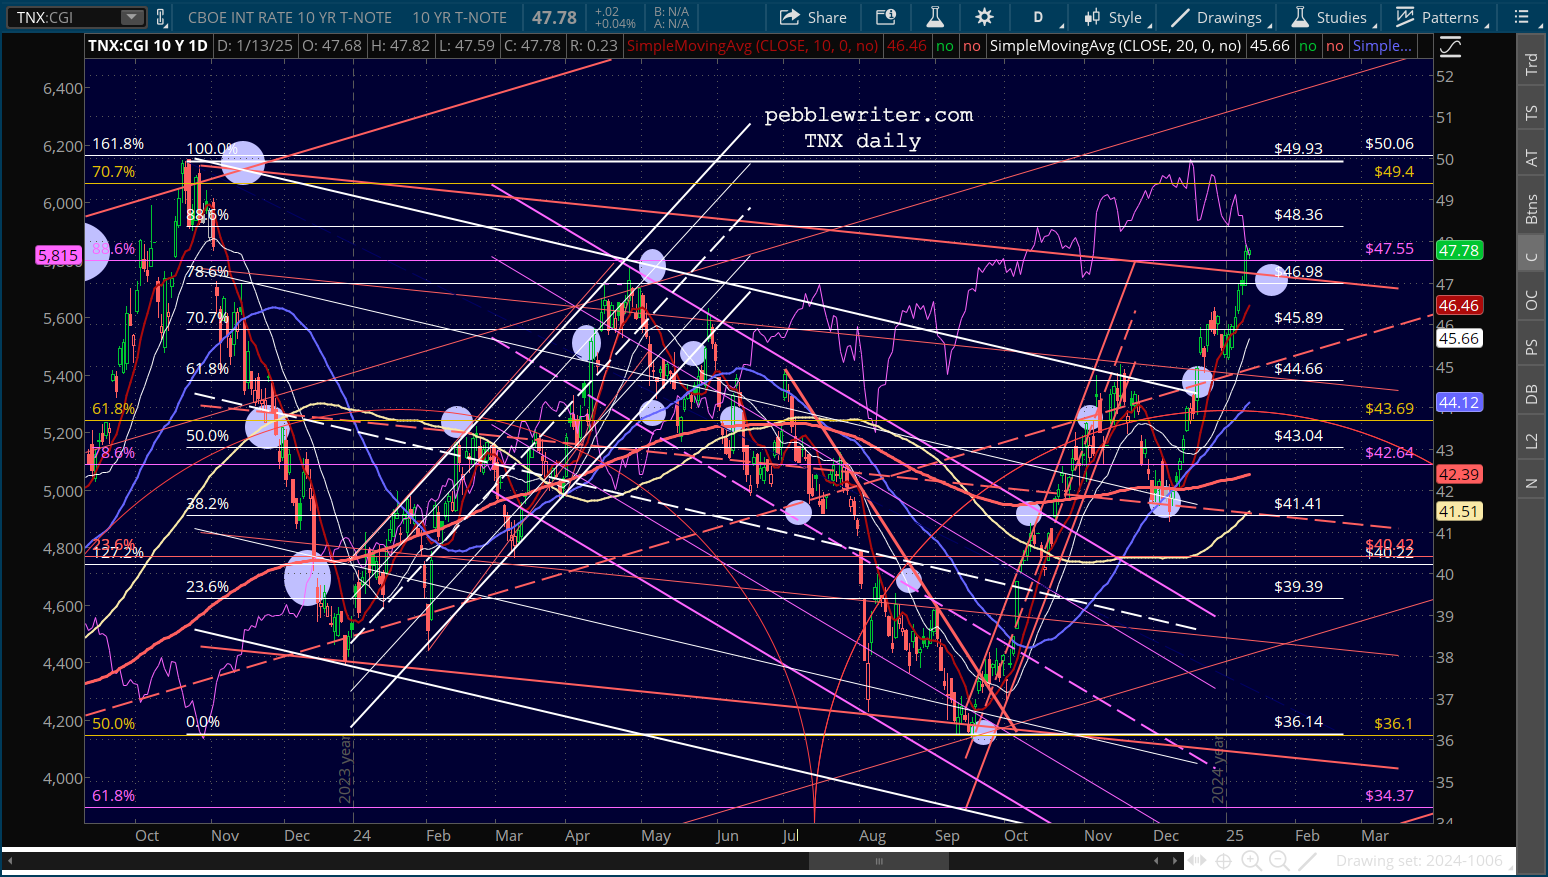
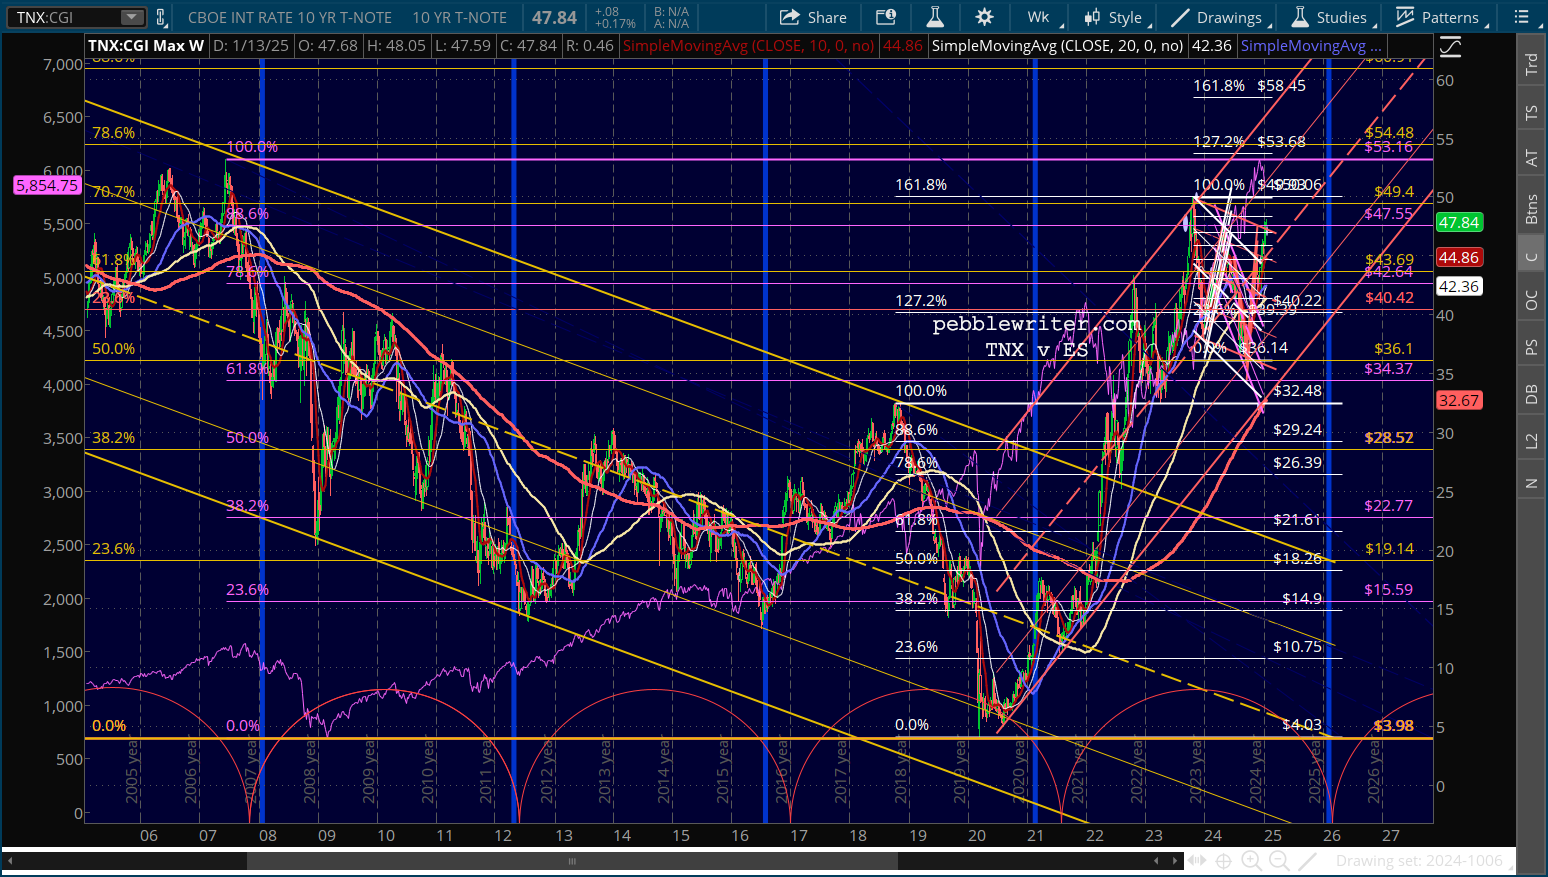
I’m looking for December CPI due out this Wednesday to top 3% and to go even higher for January (due out Feb 12.) Depending on how inflationary Trump’s tariff and deportation announcements are next week, we could easily see the 10Y reach 4.83-5.0% – testing the Nov 2023 highs.
We’ll get into the inflation forecast a little later in this post, but suffice it to say there are some potentially serious tripwires just ahead that could easily bring about a drop to 5659-5669.
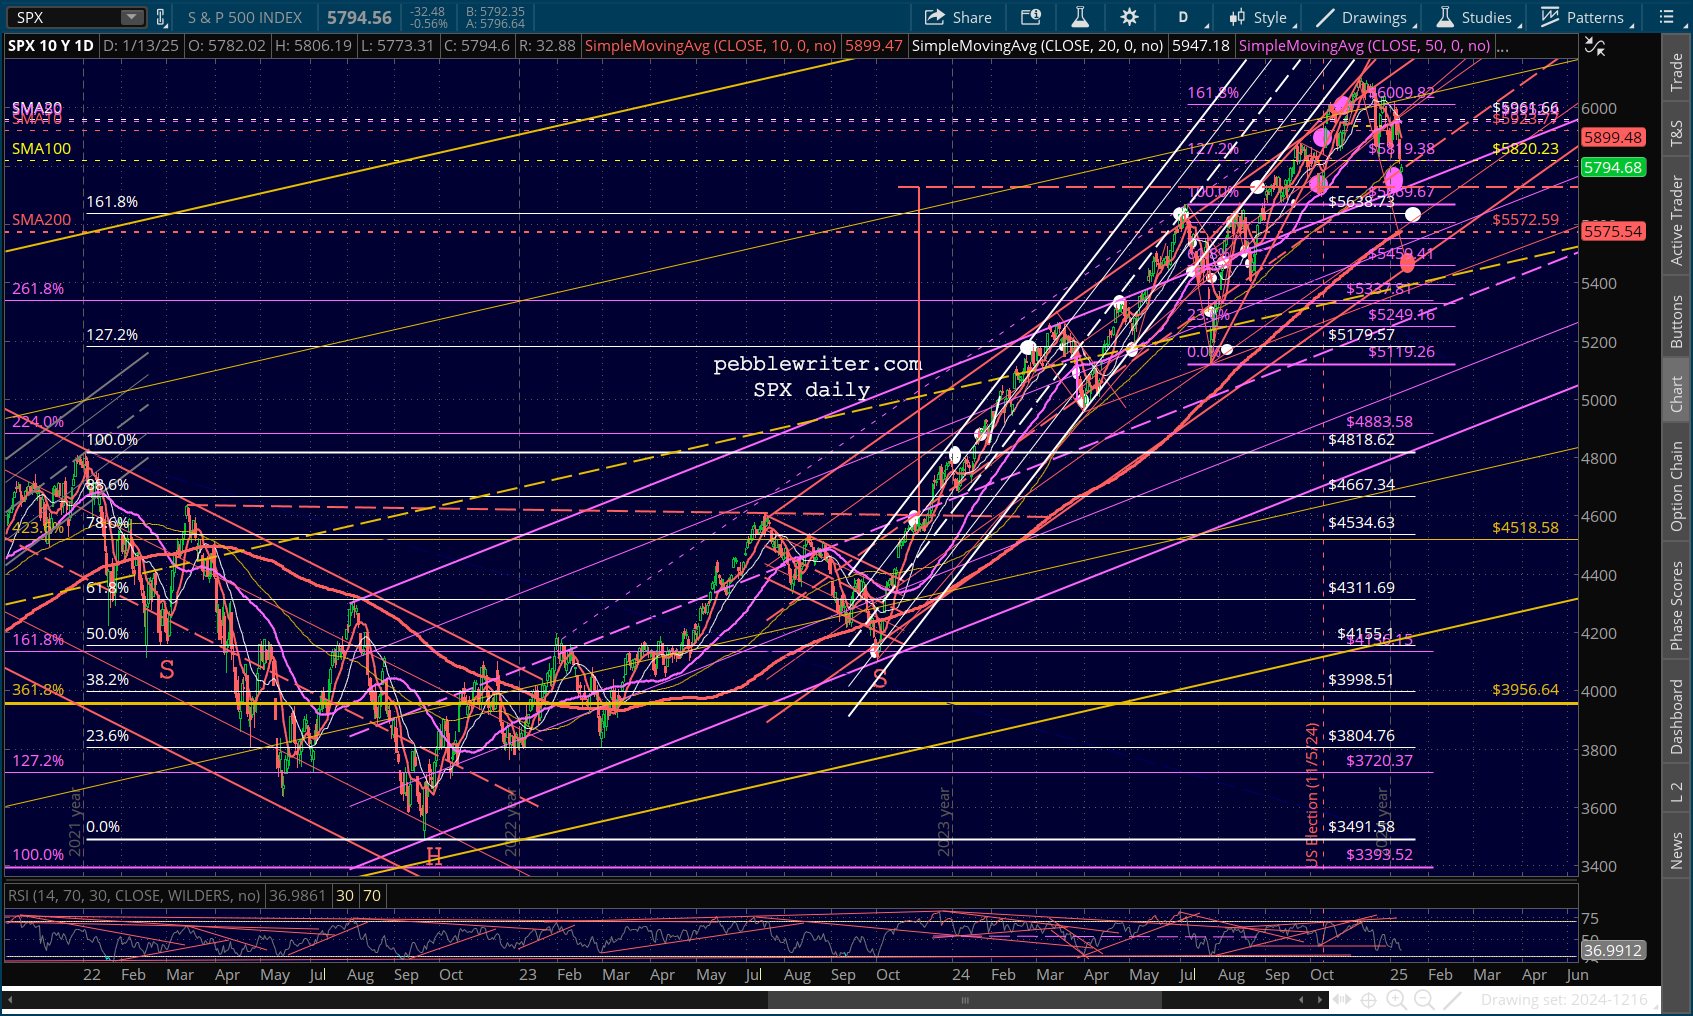
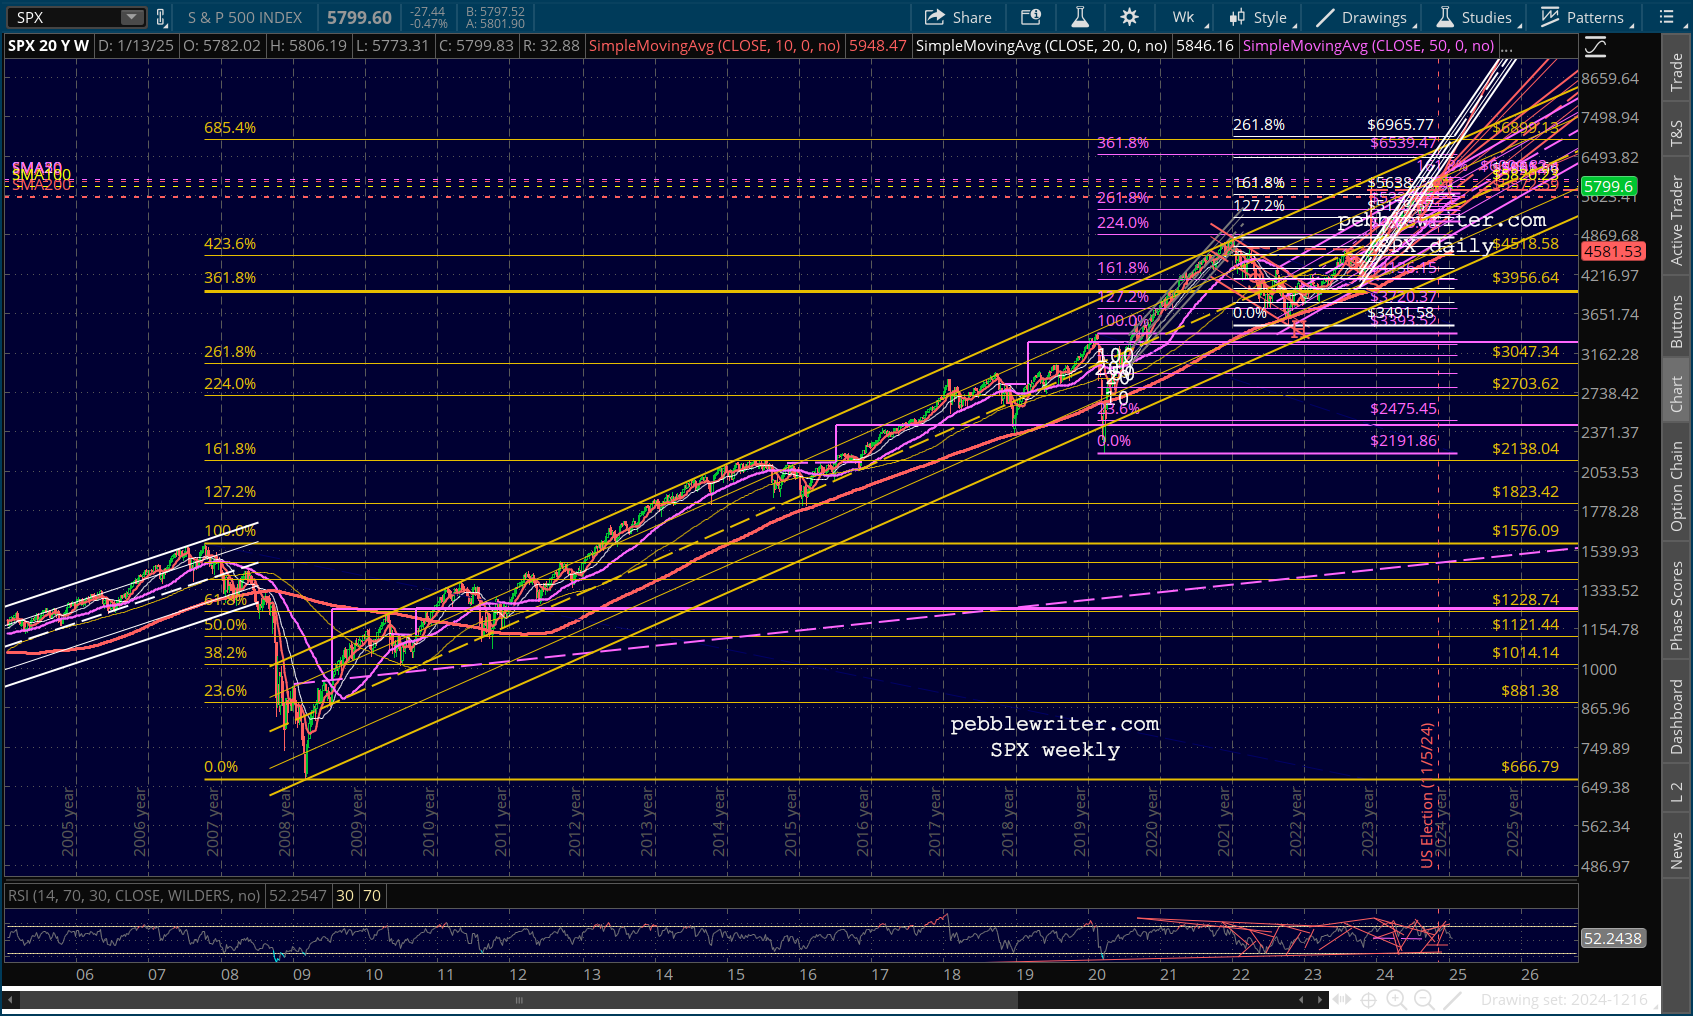
If the yellow channel midline doesn’t hold, then things would get very interesting. As mentioned above, the Jan 2022 highs of 4818 were never backtested. This price level would cross the yellow channel .236 line in April 2025 or the yellow channel bottom in Feb 2026.
The Feb 2026 time period is interesting, as it aligns with the lows forecast for the 10Y by our interest rate cycle model. Note that this rarely aligns with actual stock market lows. But, it’s usually fairly close. Furthermore, interest rate plunges can happen for very different reasons, e.g. dips in inflation versus a sharp equity selloff.
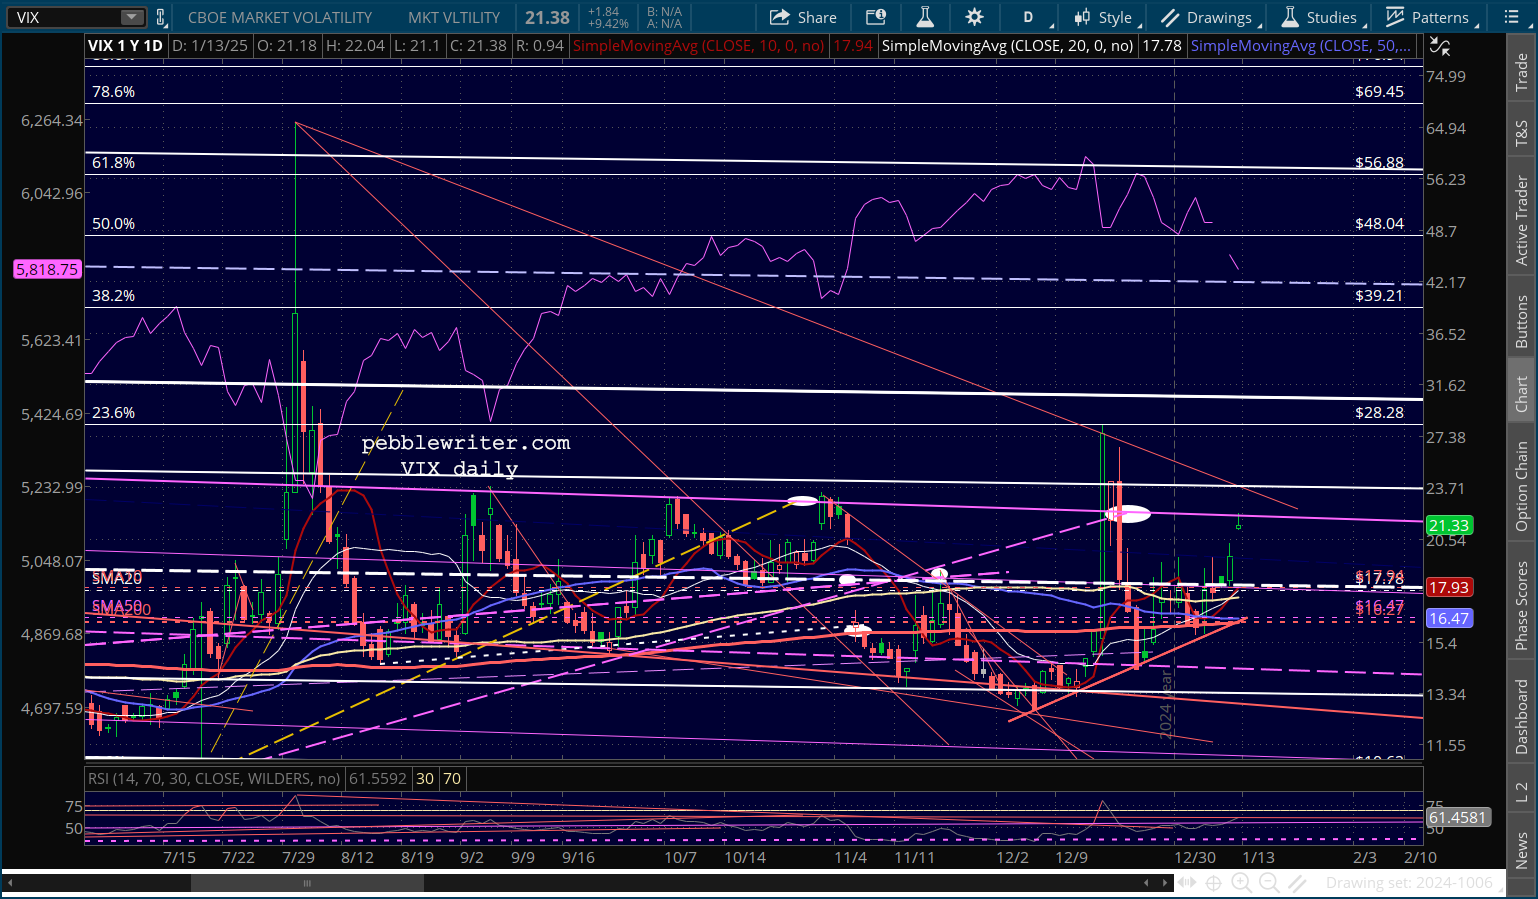
Taking all the above into account, I have a bearish bias going into 2025, even though Trump’s (and Musk’s) laser focus on positive stock performance renders any bearish forecast suspect. If I’m wrong, then we can expect a number of factors to come into play such as a weaker dollar, lower oil/gas prices and, of course, much lower values for VIX.
If I’m right, however, the following downside targets should be recognized.
-
-
-
-
- 5459 (-10.5%)
- 5329 (-12.6%)
- 4818-4883 (-21%)
- 4518 (-25.9%)
-
-
-
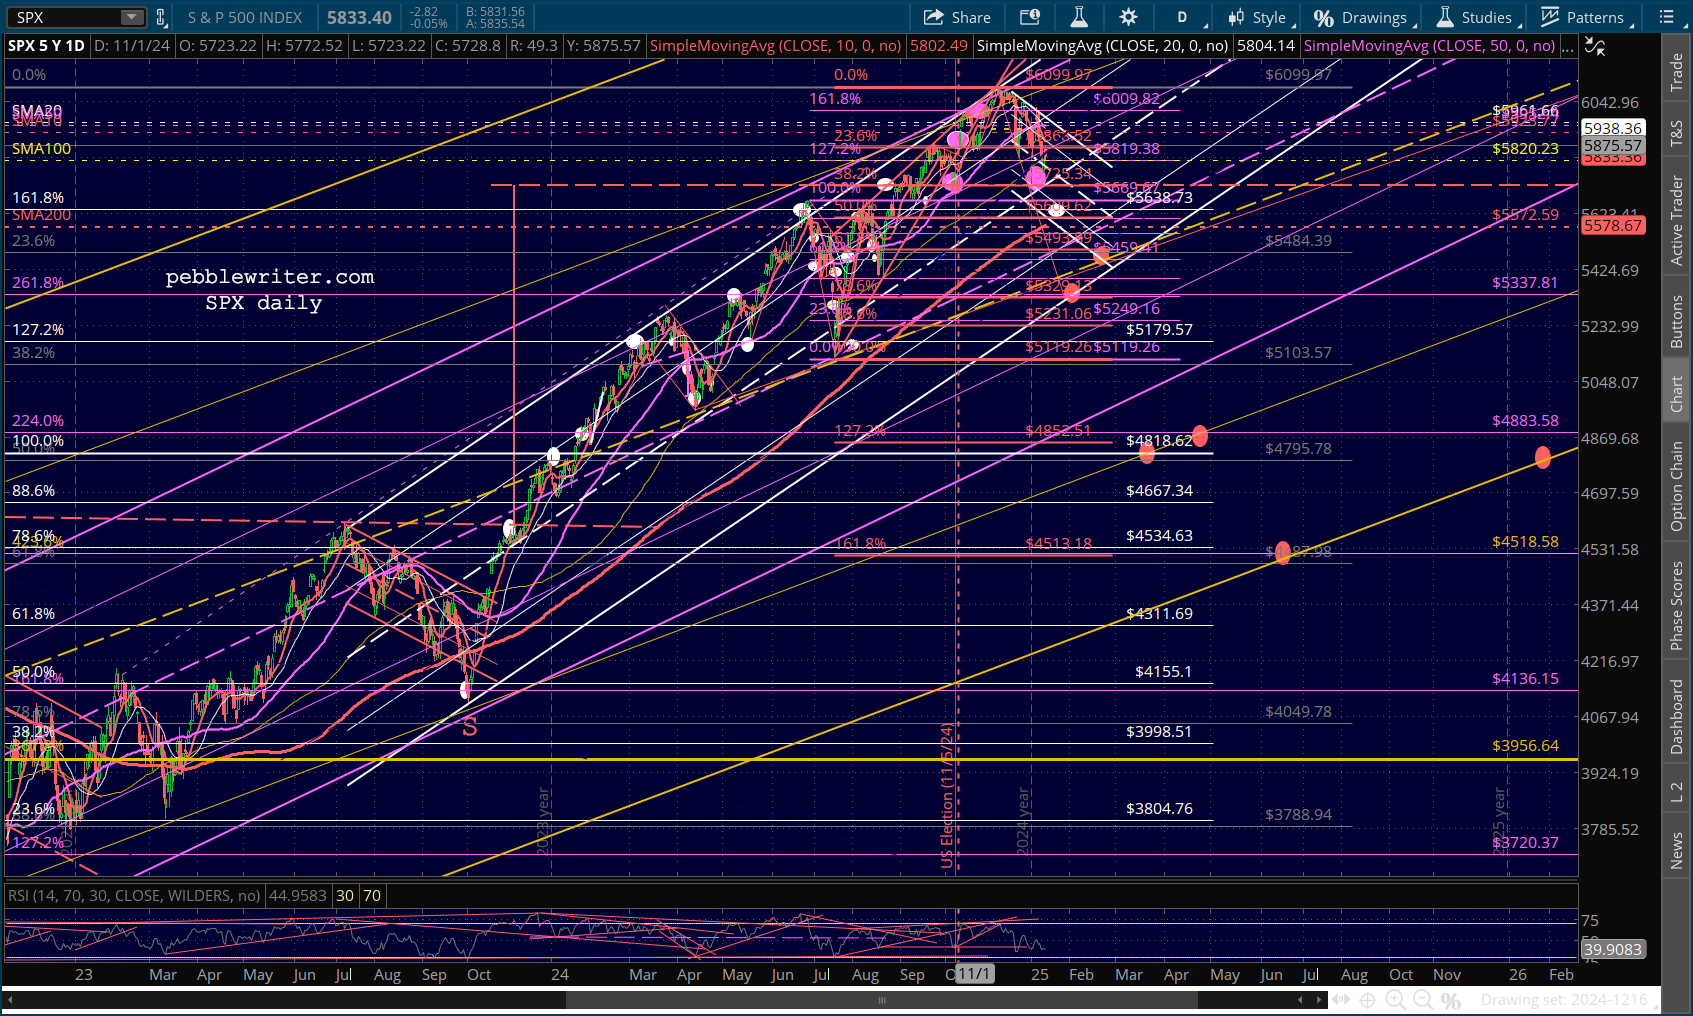 I want to be clear, however, that any drop below 5459 (-10.5%) would likely be met with an enormous effort to prop up stocks. It’s also safe to say that the bulls will definitely defend the SMA200 – currently at 5578.
The last time SPX dropped below it (by 2.9%) was in Oct 2023 and lasted only 8 sessions before a very strong rebound. And, this followed a year-long decline of 27.5%.
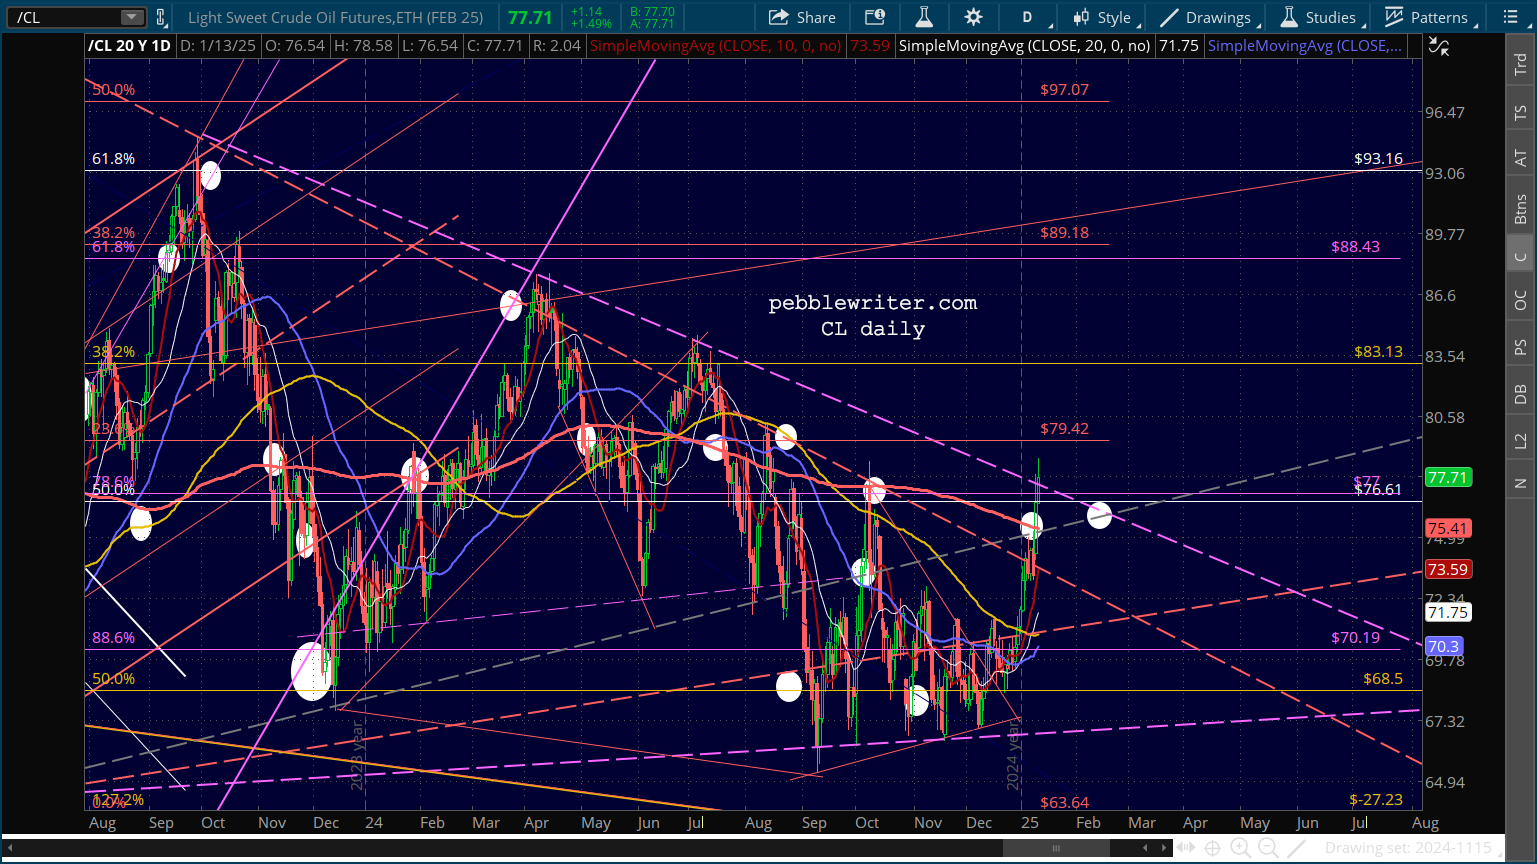
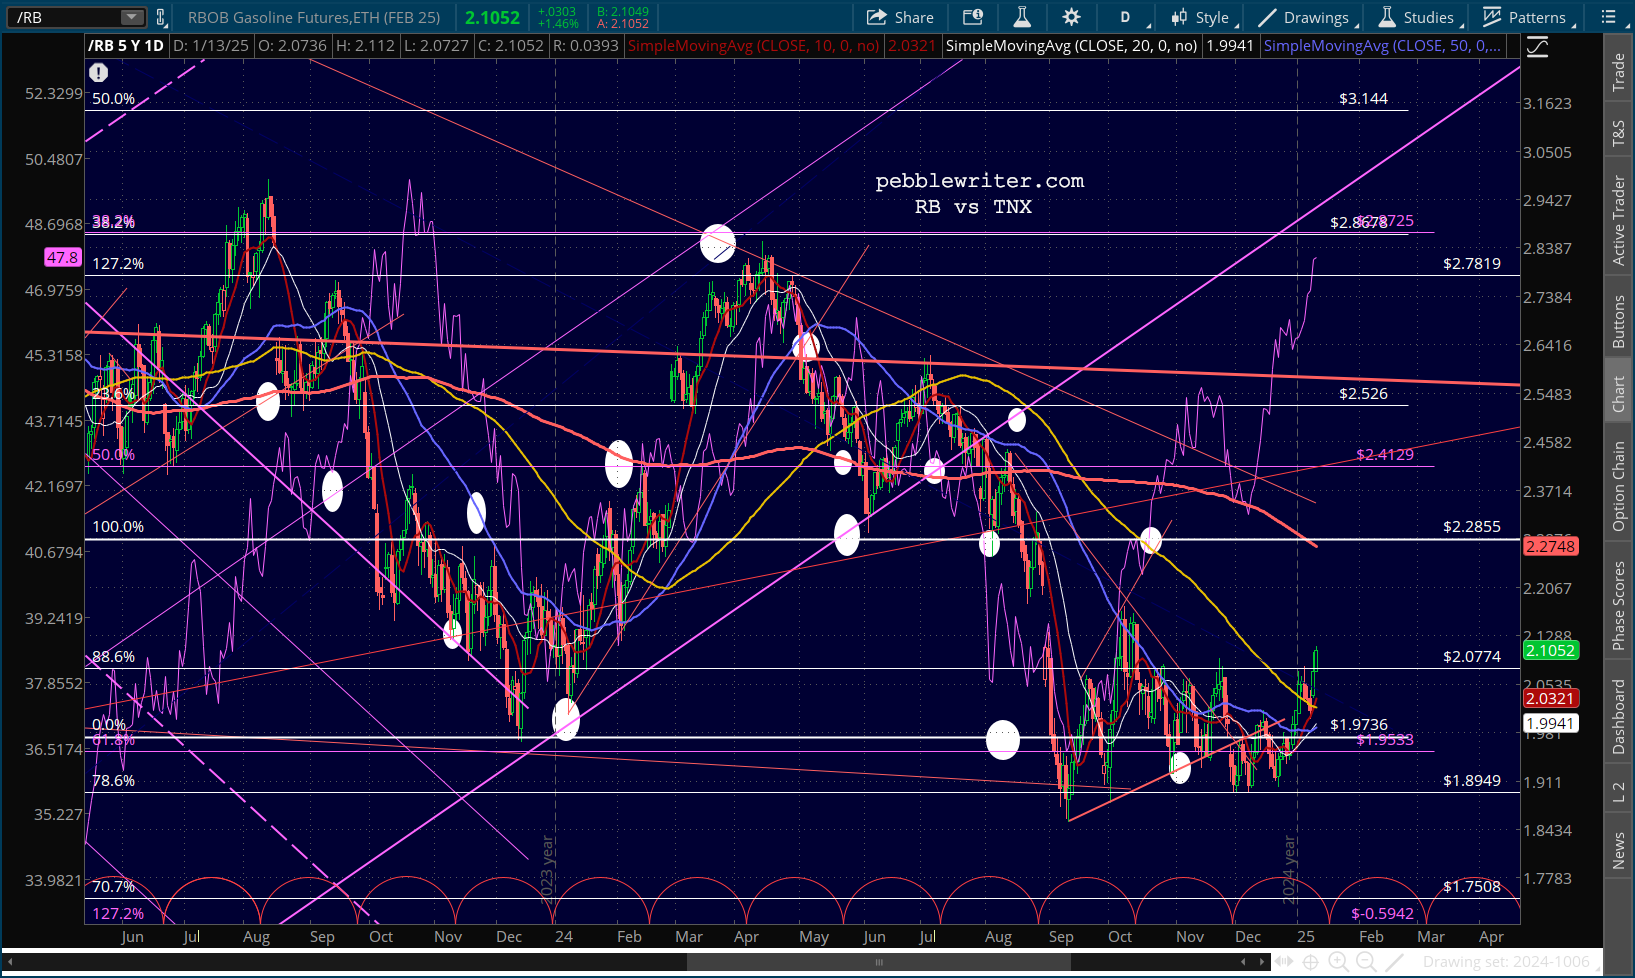
We’ll get into the factors to watch to get a handle on timing, etc over the next few days. For now, keep a very close eye on oil/gas prices and the impact on the 10Y. While PPI came in a little tamer than some expected, CPI could surprise to the upside.
The Cleveland Fed’s Nowcast is shown below:
 The rest of the charts…
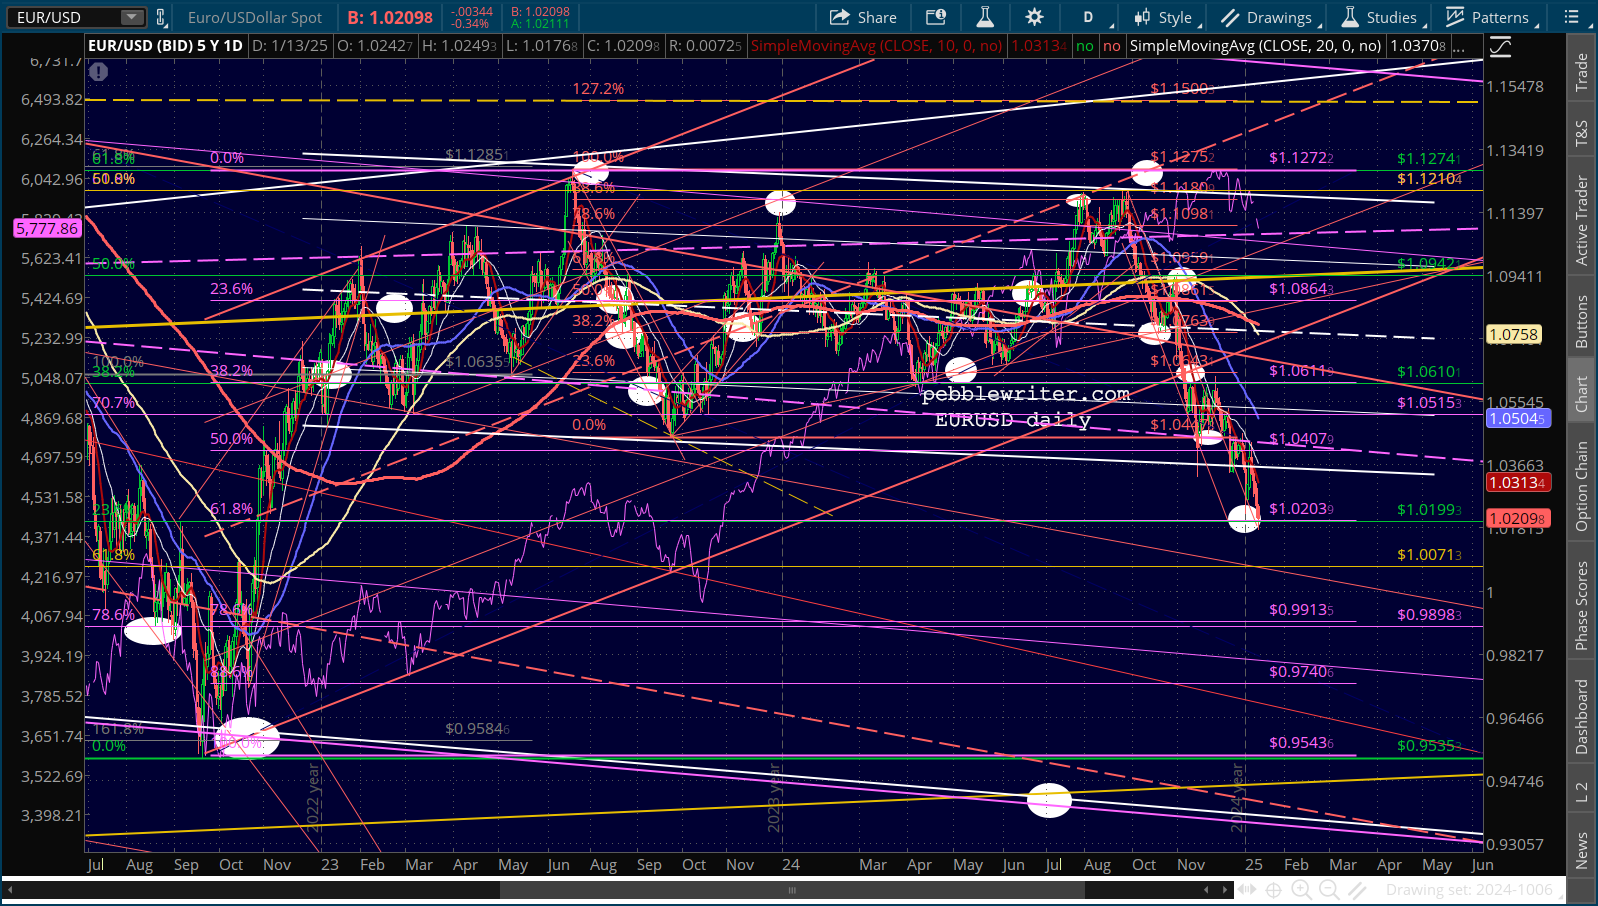
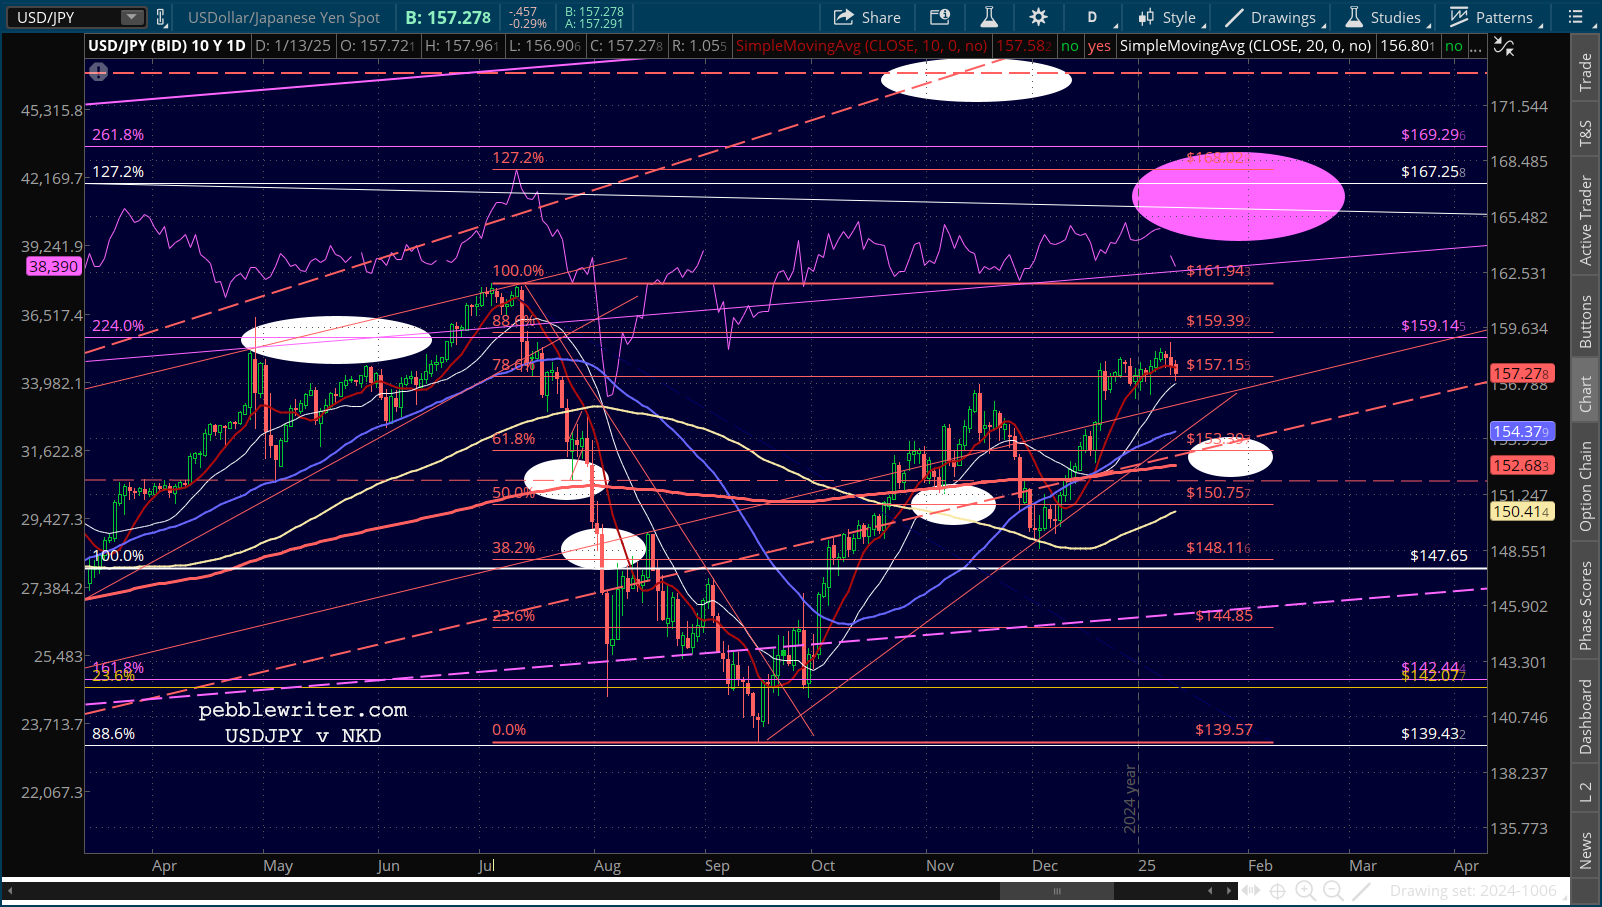
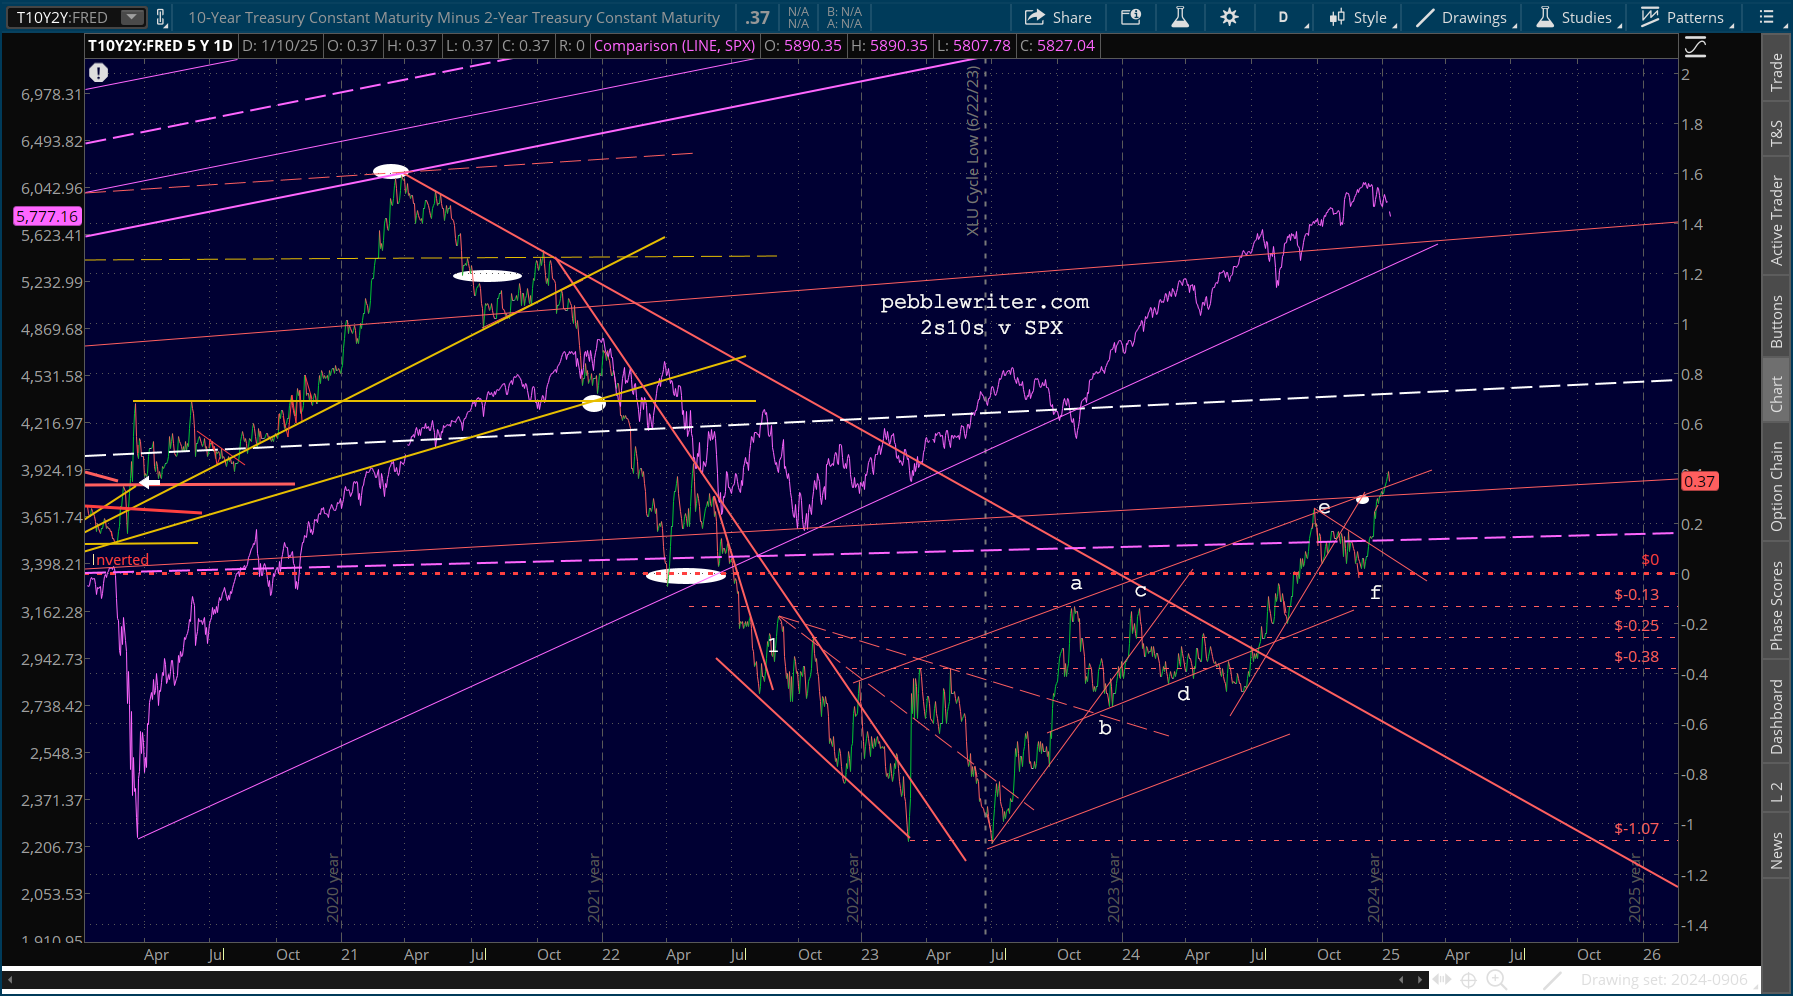
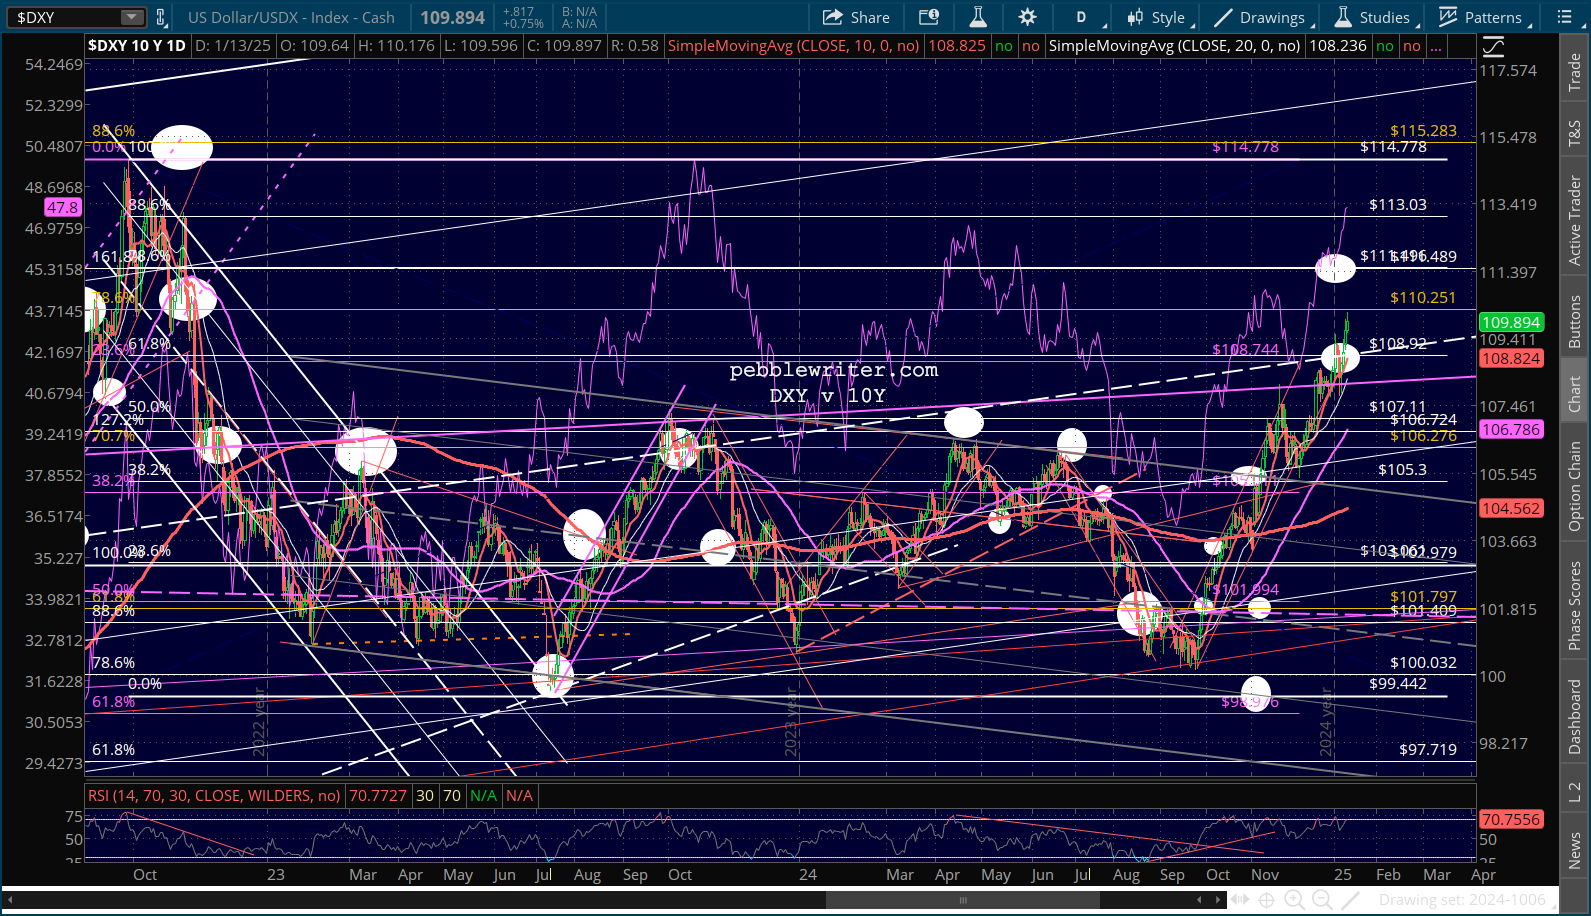 Note the breakout.