

It’s great sport to criticize the Fed for what seem like bone-headed moves. Yesterday wasn’t one of them. What Powell knew and rest of us had guessed was that June CPI was headed significantly lower and would continue to widen its divergence with core CPI. While the futures were ramping higher thanks to Powell’s dovish prepared remarks (which were conveniently released prior to the open)…
  …few stopped to question why the Fed should ease amidst the most accommodative monetary conditions since 2013.
 The fact is that Powell was boxed in. Everybody knows that the official inflation data woefully understates actual inflation. This comes in handy when trying to keep a lid on interest rates — a necessity when you’ve got $22 trillion in debt and a $1 trillion budget deficit.
But, even flawed CPI is an important signal. It goes a long way toward explaining why oil and gas prices magically decline every time inflation starts to get out of hand… …and inflation magically declines every time interest rates threaten to get out of hand.
 Put them together and RBOB’s 42% Oct-Dec 2018 plunge (which began only 2 days prior to the 10Y topping out) suddenly makes a whole lot of sense.
 Unfortunately, understating inflation is not convenient at all when investors start worrying about deflation — as the current interest rate environment suggests they do.
Trump & Co. say they want low interest rates and a cheap dollar. Plunging oil and gas prices are the best way to get there. The latest CPI print at 1.65% is testament to how well the mechanism worked. Score one for the White House.
Sure, the trade war, real estate bubble and rising health care costs are bumping Core CPI higher. But, the average voter couldn’t tell you what “CPI” stands for, let alone the difference between the various inflation measures. And, the average investor only cares about inflation if the Dow should happen to slide more than a few percent which, if it occurs, is easily negated by a breathless update on the excellent progress of the trade war negotiations.
Bottom line, the Fed would face heavy criticism if they stood pat with CPI at 1.6% and falling. The White House is no doubt well aware of this, and is also well aware that YoY comparisons will be pressured by oil and gas’s recent rallies — particularly when October arrives.
This is why oil and gas prices are very unlikely to continue to rise — as the charts confirm.
continued for members…At yesterday’s high of 3002.98, SPX came within 1.48% of the 2.618 extension at 3047.34. It took breakouts in CL, RB and USDJPY and a sharp decline in VIX to make it happen. But, at the end of the day, there will be no asterisk in the record books reflecting new, all-time highs.
RB is poking into the year-ago range as it did in April and May when CPI registered 2.0% and 1.79%. Like then, this push should fizzle out any minute. Look for it to back off by the next time the BLS plugs in a weekly value on Jul 15.
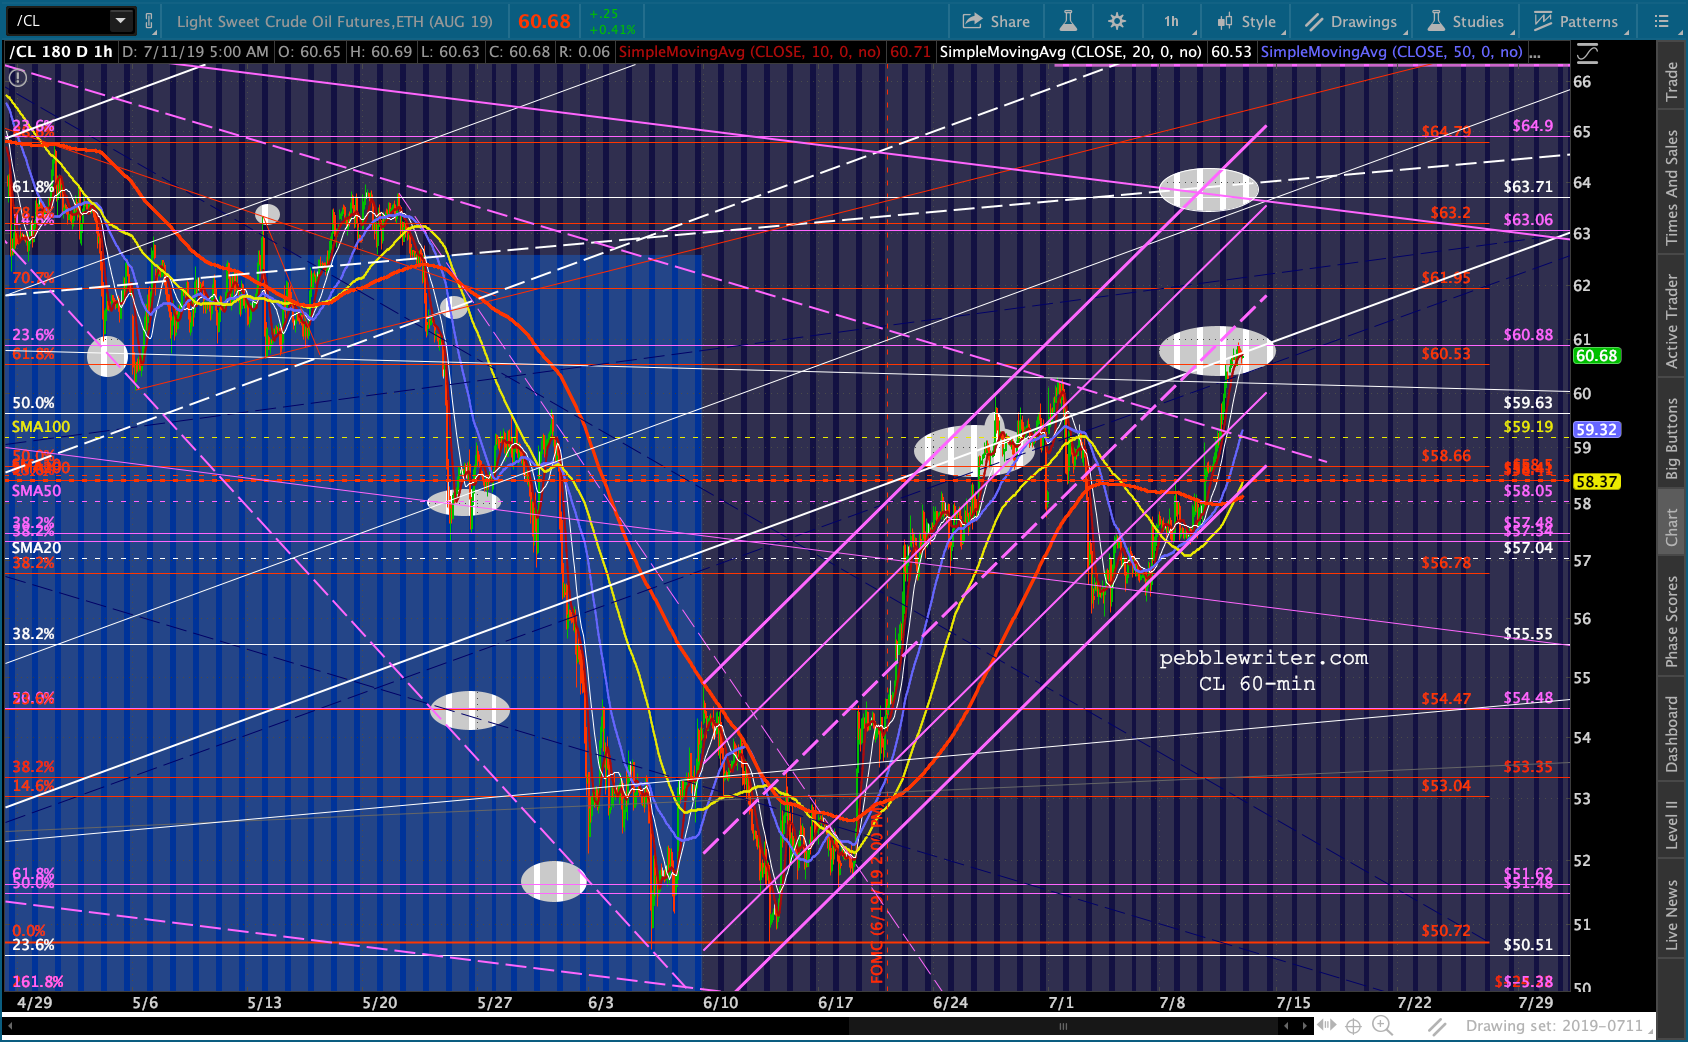
 CL broke above its purple TL, but is still only backtesting the white channel bottom — and, at the .618 to boot. Look for a reversal here to at least backtest the SMA200.
 The most interesting chart is USDJPY — which saw a reversal at the yellow TL we discussed yesterday, fell to backtest the broken white channel, then bounced to backtest the purple channel line. Ping pong, anyone?
 What this tells me is that while SPX might or might not have topped, it’s very, very close. I continue to see strong parallels between this market and the 2015 top. SPX first came within 1.48% of its ultimate May 20 top on Feb 20. And, it peaked again on July 20 before finally letting loose.
 It was a long five months with countless head fakes — many of which were driven by USDJPY’s ceaseless oscillations about its .618 at 120.11.
 I can’t say I’m happy at all about this prognosis. But, I’m more than a little fascinated by it. Consider that SPX made its last big (9.9%) decline before the 2134 peak on Oct 15, 2014. From then to 2134 (+17.3%) on May 20, 2015 was 150 days if you exclude weekends and holidays. It came to within 4 points of the 1.618 at 2138 and within 8 point of a 1.618 extension of the drop from 2019 to 1820.
The most recent big decline ended on Dec 24. It was a 20% decline, but I’ve always felt it was an overshoot. Anyways…if we add 150 days (excluding weekends and holidays) to Dec 24, we get July 30 — which just happens to be the first day of the next Fed meeting.
It would be a heck of a coincidence, no?
I’m going to take the rest of the day and probably tomorrow to work on this potential analog and see what I can come up with.
GLTA.