

As a chartist, you know something’s gone haywire when a major, long-term channel breaks down and it results in higher prices. Yet, as every chartist knows, this phenomenon has been a hallmark of the financial markets for the past several years. The S&P futures (ES) offer a very clear example. Like all channels, the rising purple channel above was formed by a series of rallies and setbacks. It ran into trouble in late October when ES dipped below the channel bottom (yellow arrow) but recovered only an hour later. It bumbled along until Nov 9, when it broke down again.
 This time, however, it formed a Head & Shoulders pattern that suggested an additional 32-pt drop to backtest a key Fibonacci level. In each case, VIX plunged (32% and 41% respectively), algos responded, and the damage was contained.
 Intraday dips that drop below a channel bottom are no big deal. They happen all the time and are promptly bought — the new normal.
But, when the dip results in a close below the channel bottom, it has (traditionally) mattered. It matters even more when there are a string of lower lows and closes below the channel bottom such as between Nov 8 and Nov 15.
Fortunately for the bulls, and no doubt quite by coincidence, USDJPY rallied sharply (the shaded area below) at precisely the same time that VIX’s 41% plunge (to new, all-time lows) ran out of steam. The yen carry trade rarely disappoints.
And (another coincidence?) as the initial spike took a breather, VIX took the opportunity to plunge again — this time by a mere 36%. Between the two influencers, and some help from a timely pop in oil and gas, ES had no trouble making new highs and actually rejoining the broken purple channel — at least between Nov 30 and Dec 5.
On Dec 5, it broke down again — but just enough to establish the bottom of a new, more steeply rising channel shown below in red. The red channel has provided support for no fewer than six bounces since Nov 15. And, it has guided ES high enough to rejoin the purple channel multiple times — only to end up dropping the ball. With ES currently up 15 points, it’s backtesting the purple channel bottom . This would traditionally be a potential bearish signal. But, clearly, the previous backtests resulted in higher prices. Is there any reason to believe this one won’t?
continued for members…
One factor that, I think, outweighs all others is the end of the year phenomenon. There’s a lot riding on higher prices around the end of the year: record books, M&A deals, underwritings and, most importantly, bonuses.
The bulk of equity players — whether human or machine based — are happier when prices are rising. Plunging equity prices scare investors. The amount of money that goes away scared far exceeds that which is positioned as shorts.
I believe this is why the purple channel has been tested over and over again, even though it’s not justified by the longer-term patterns. Note that the two major TLs of the 2009-2017 rally are parallel. 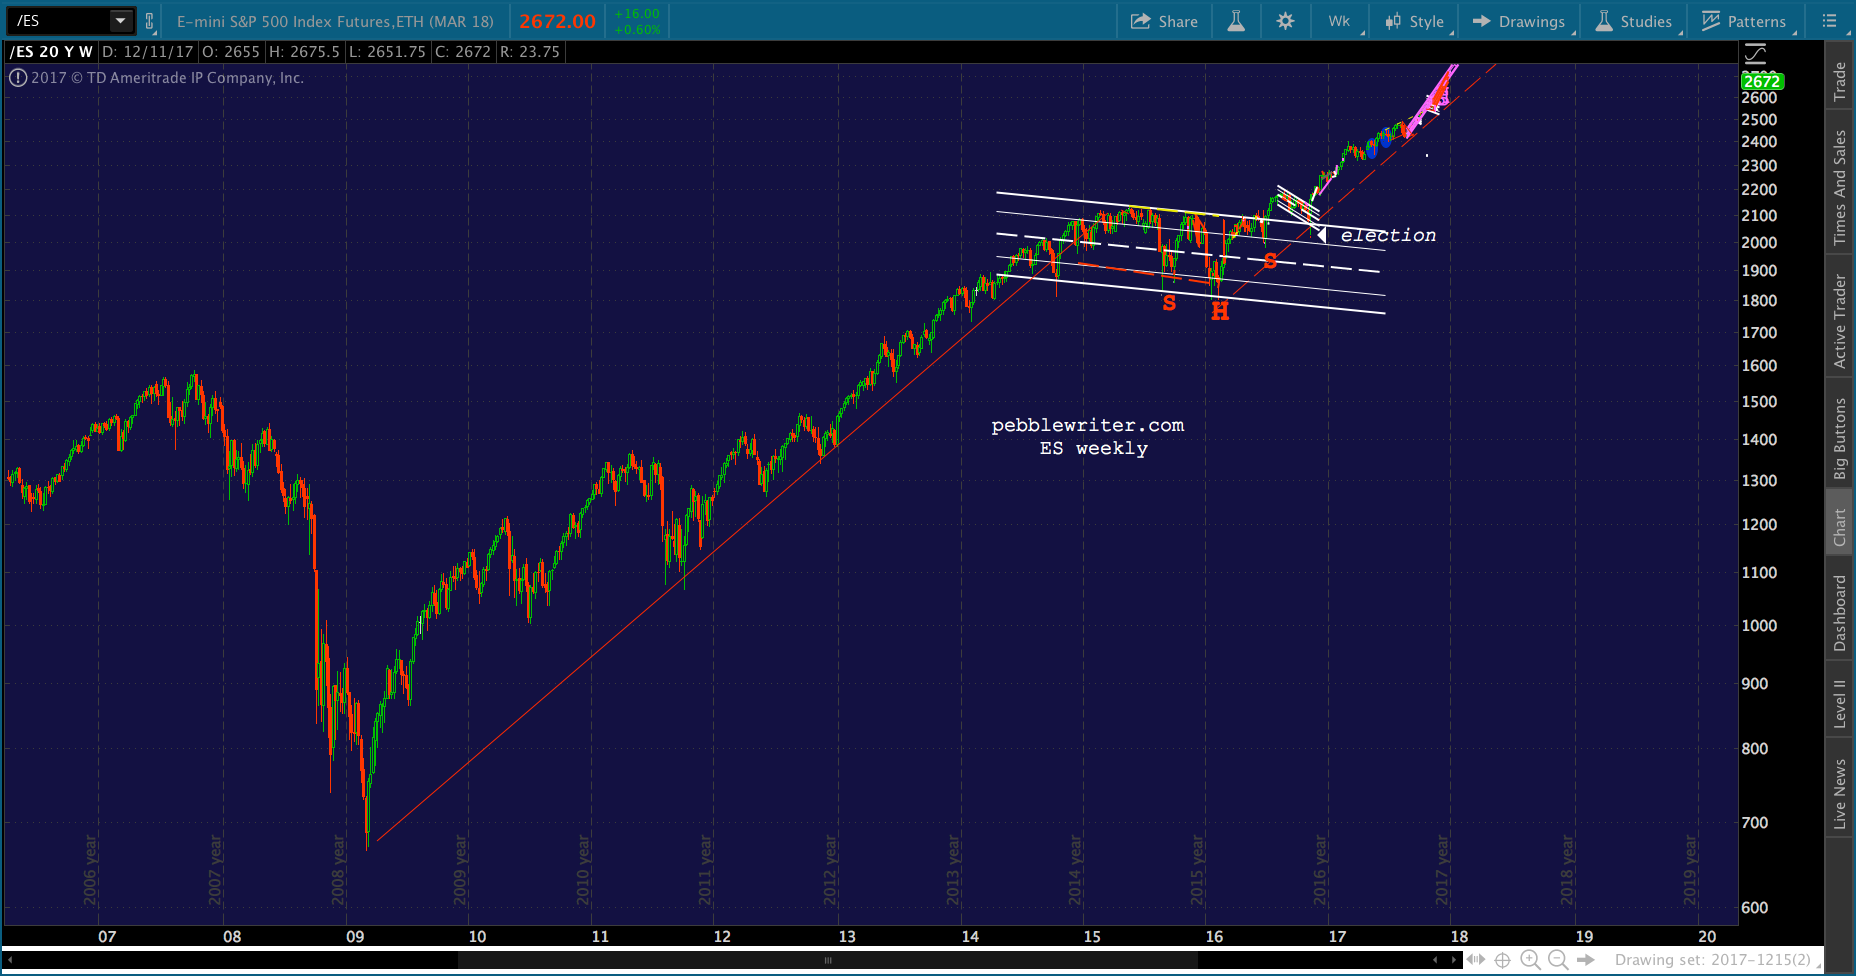 This suggests they’re part of a larger channel system which, as we can see below, is true. The large purple channel is parallel to the white one.
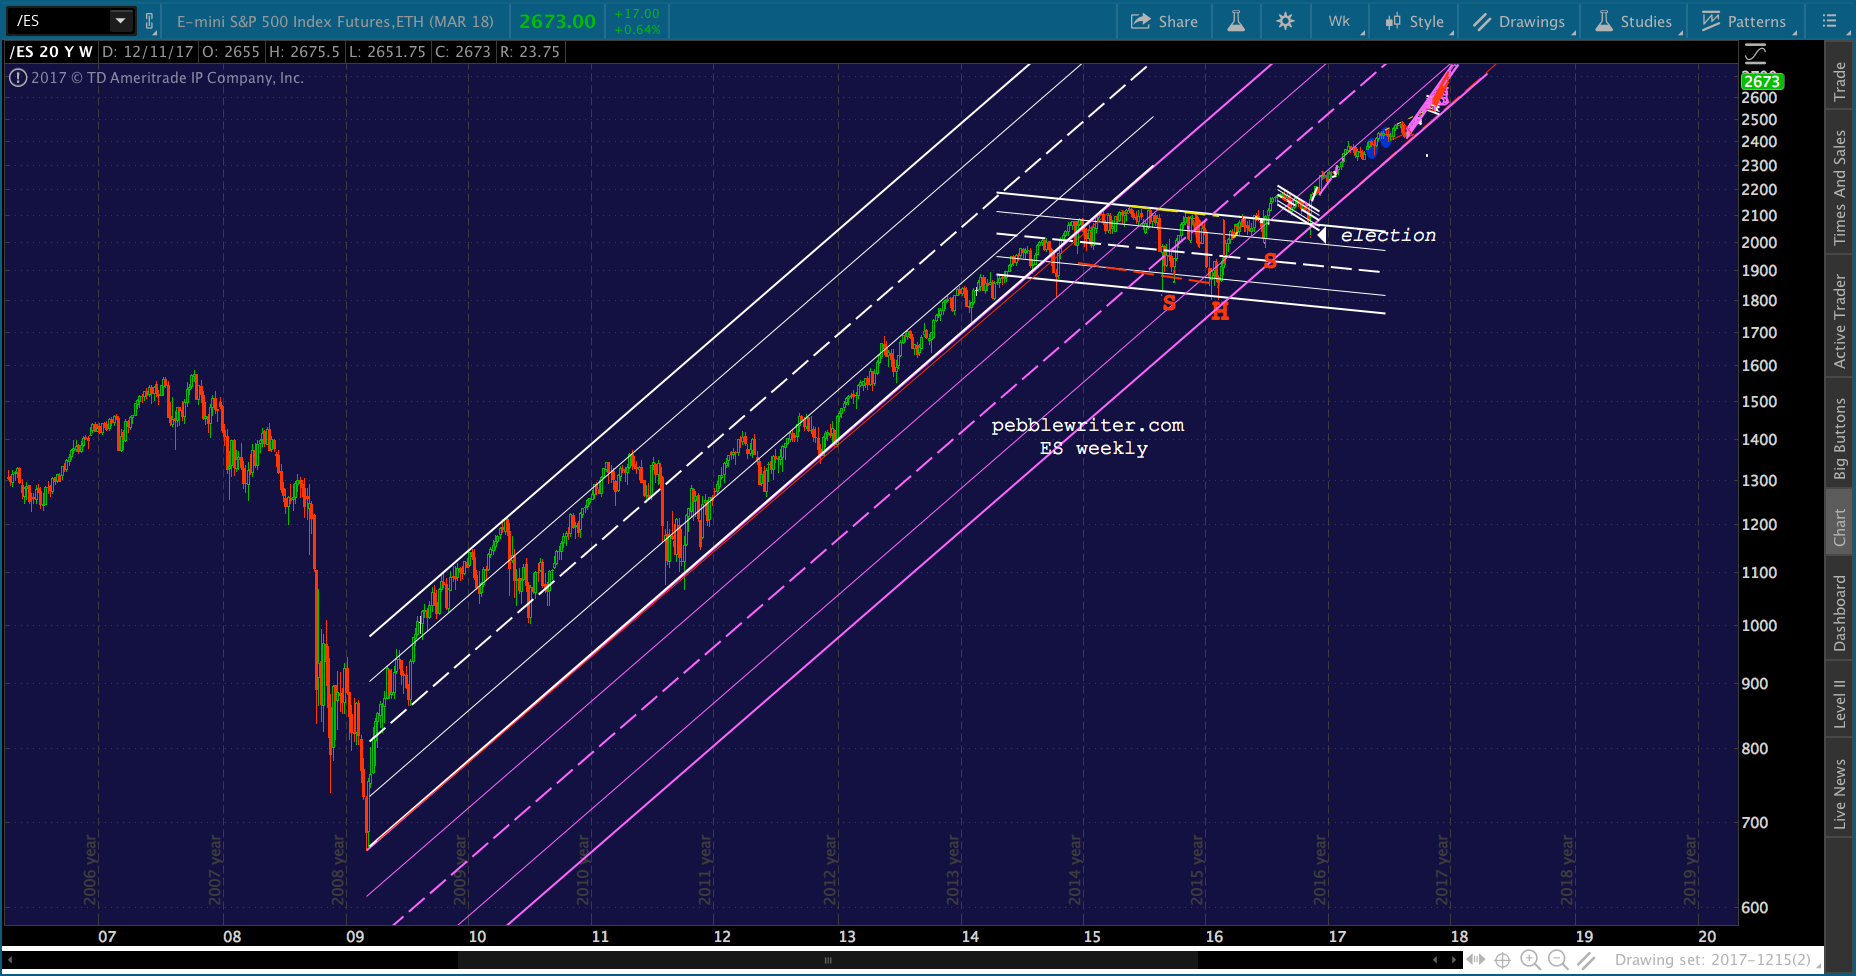 The problem with the parallel purple channel, of course, is there have been no tags on the top since Feb 2015 nor the midline since Dec 15. ES has operated solely in the bottom quadrant of the channel since Sep 2016. It’s hard to imagine it’ll spend another entire year in the same slot.
Hence, our dilemma. Will ES break out or break down?
The bullish case is that the lows we saw in Jan-Feb 2016 and again in Nov 2016 marked the bottom of a larger channel that has oodles and oodles of upside. The top of it right now, for instance, is way up at 3850. And, of course, it’s rising fast: about 15%/year. At YE 2018, it’ll be around 4500.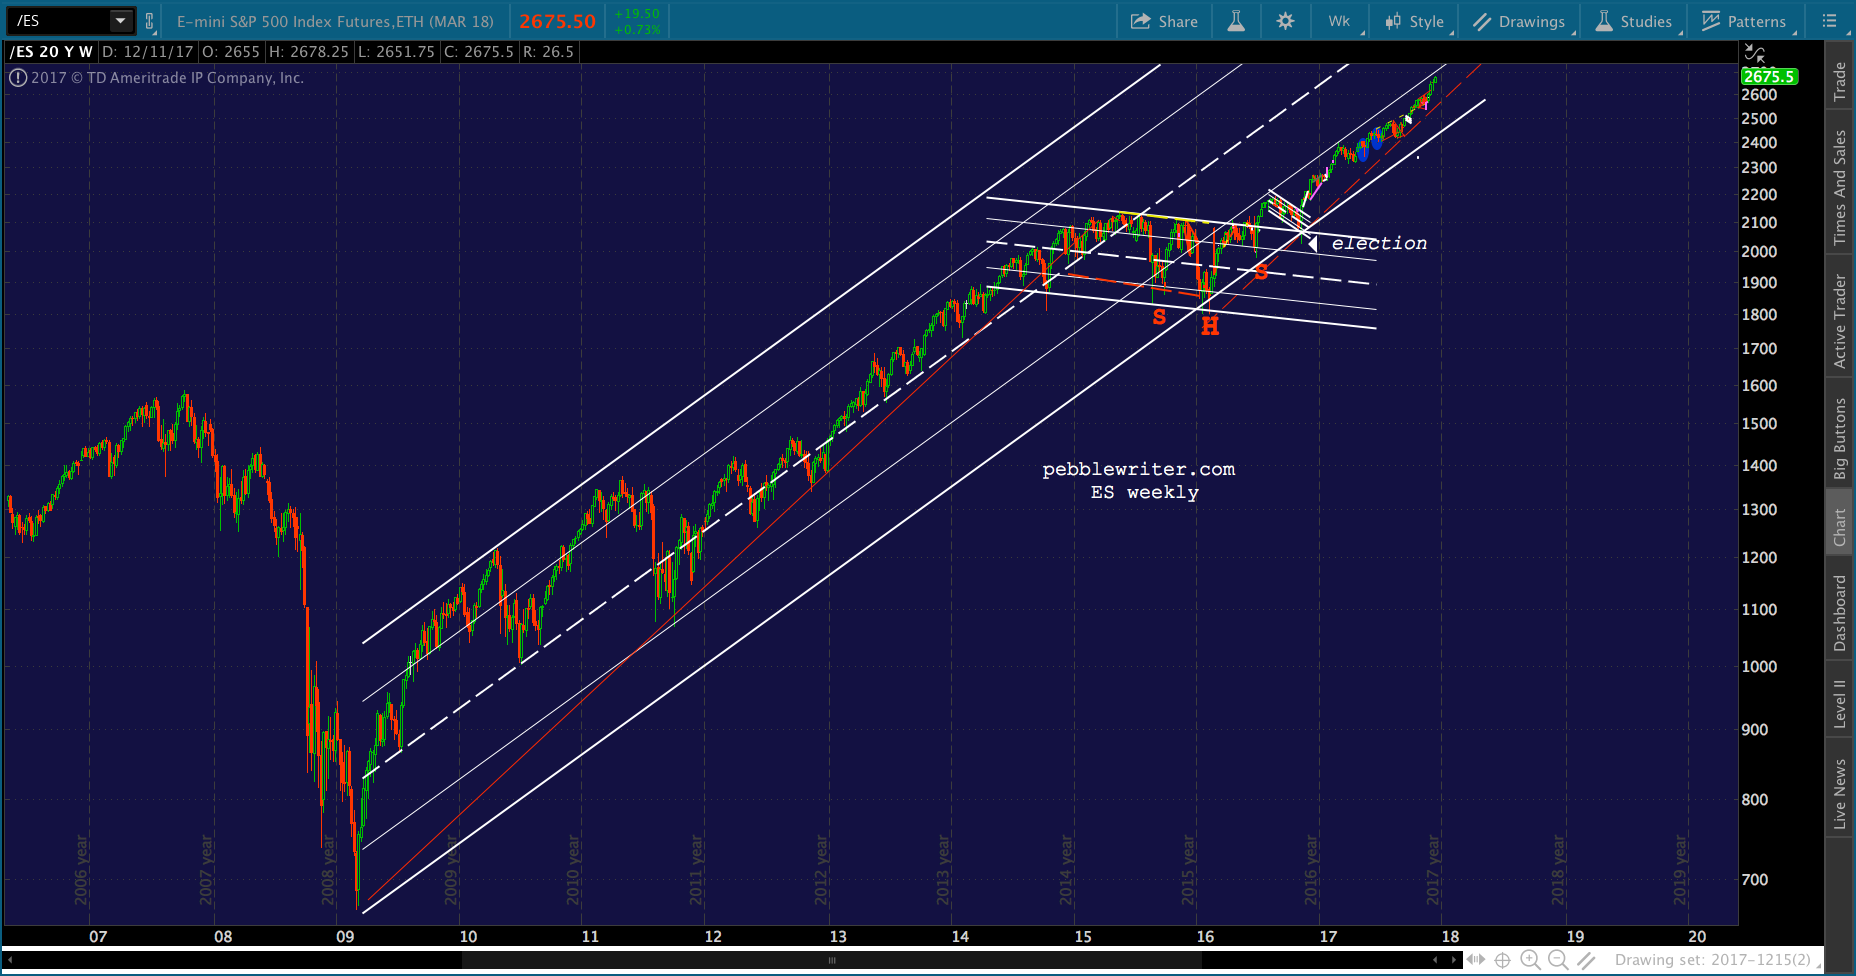 The bearish case is that the highs we saw in 2010, 2011 and 2014 marked the top of a less steeply rising channel. The most bearish interpretation of this chart would be that ES tagged the top of it, came back to the midline, rallied to the .786 line, and is slated to visit the channel bottom or at least the .236 line.
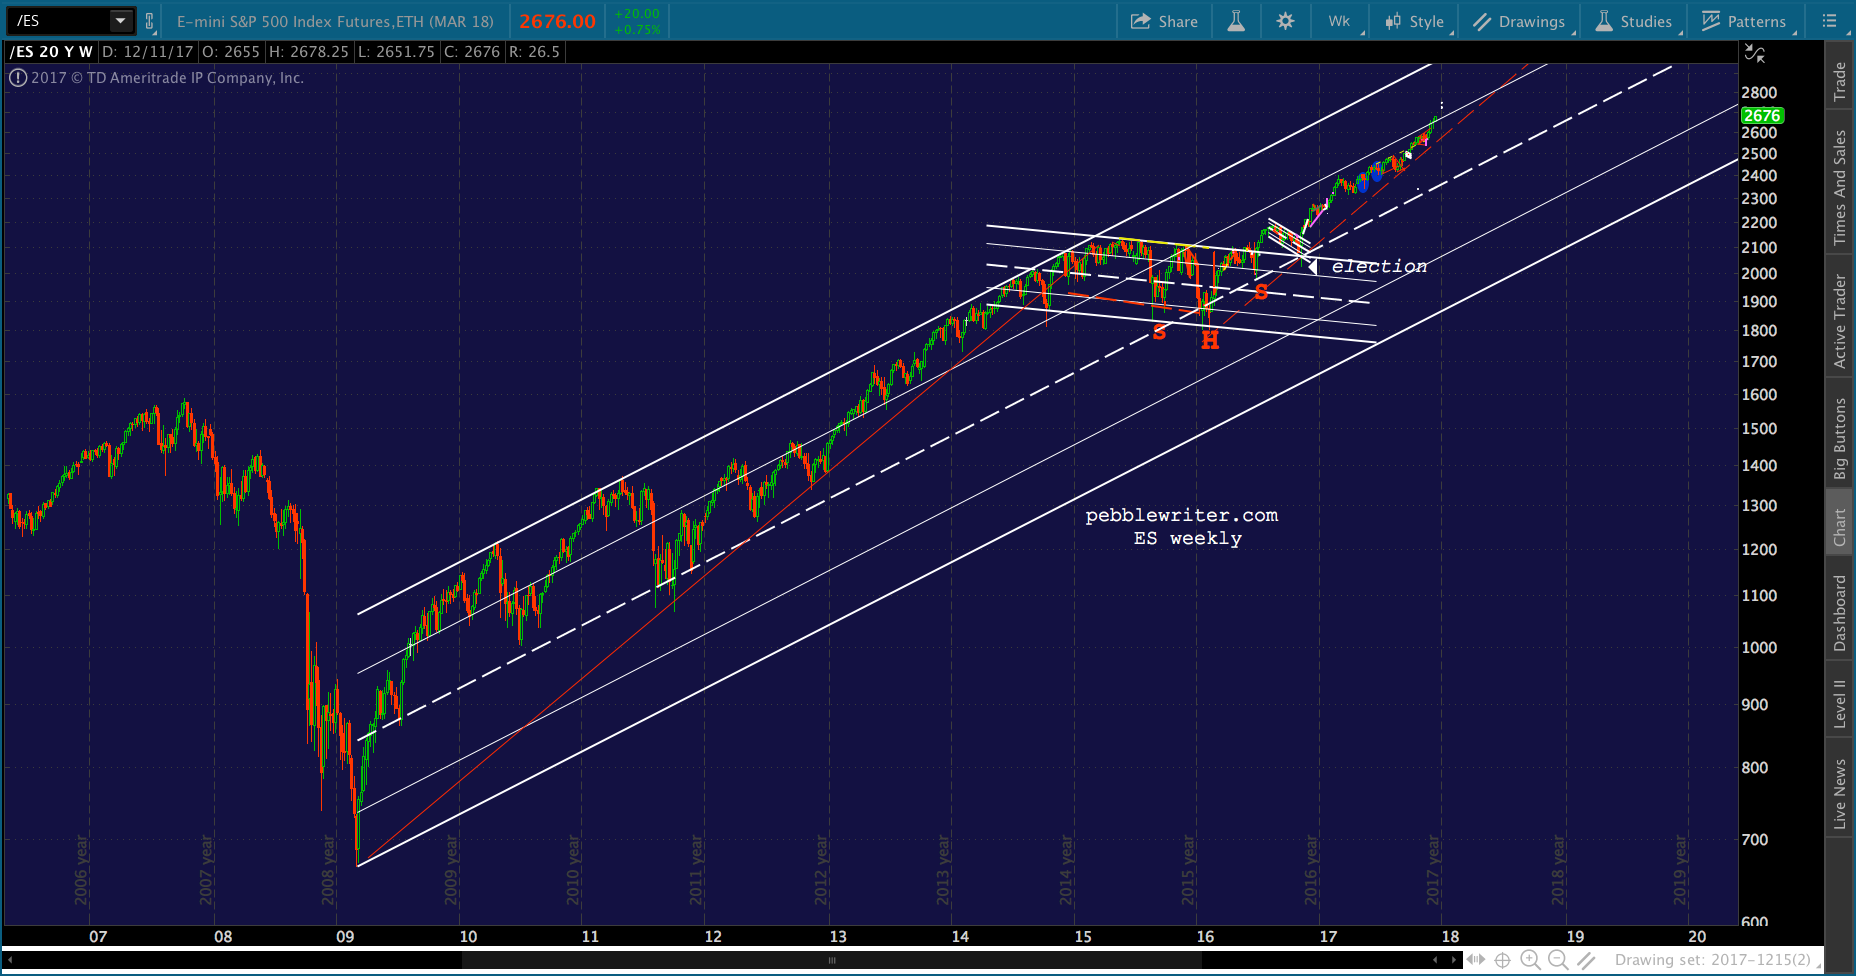 If we incorporate the 2007 highs into the picture, there’s another alternative that makes great sense — up to a point. Note how the 2011 high and low nestle perfectly in between the .236 line and midline. Again, after the .236 tag in Oct 2011, ES should have rallied up to the .786 line.
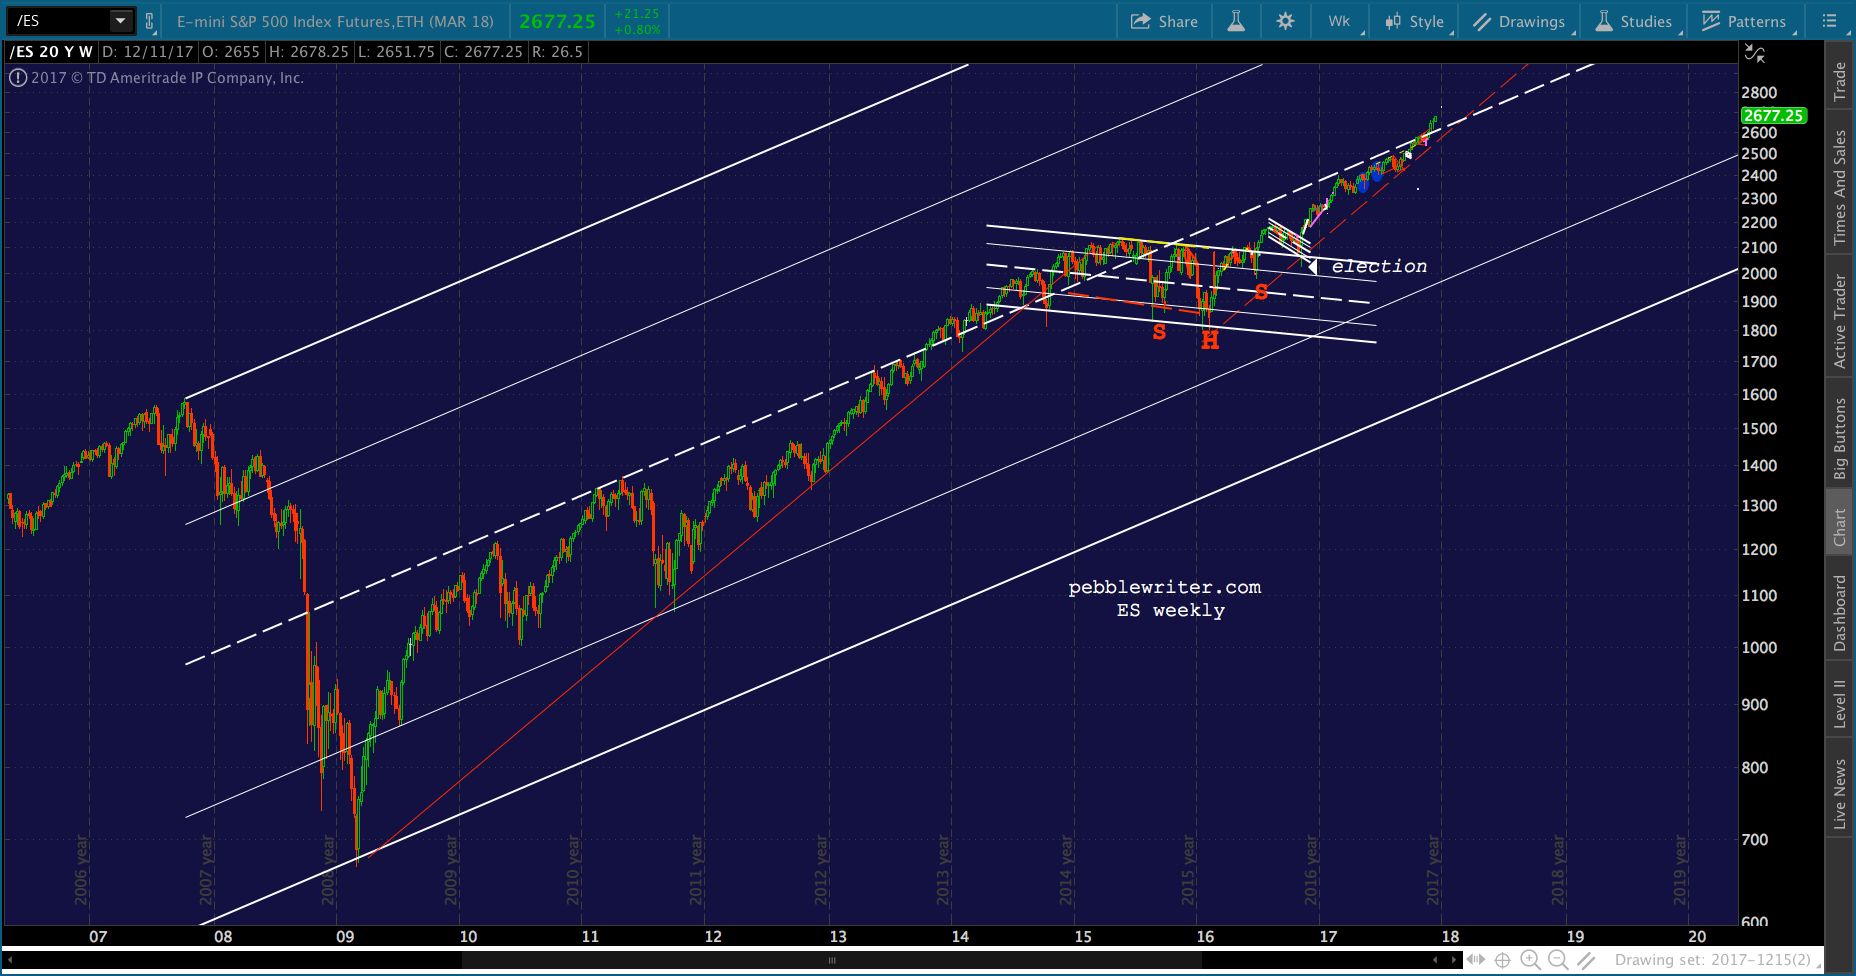 But, it didn’t even make it back to the midline until May 2013. It has struggled ever since just to get to and/or remain above the midline — with this week’s push maybe qualifying for a breakout if it isn’t reversed in short order.
About the most bearish channel I can find is the one shown in purple below. It connects today’s highs with those from 2000. And, it explains plenty of reversals at both support and resistance. 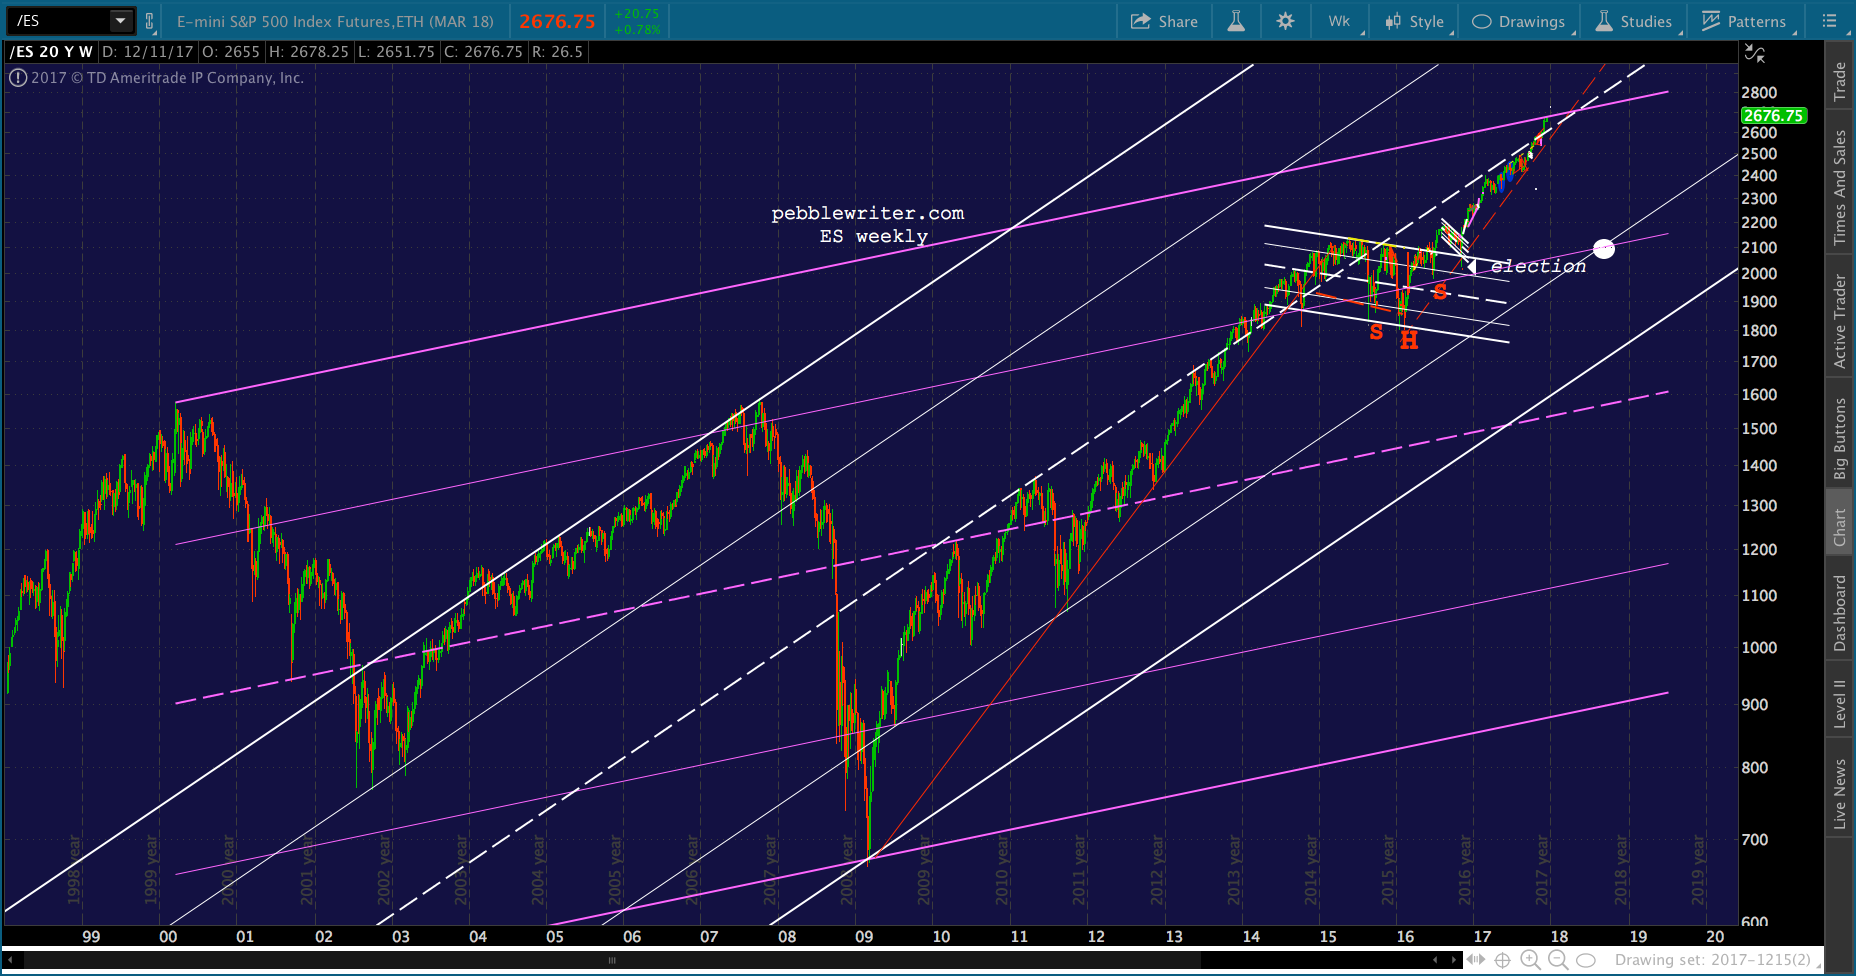 If ES were to turn tail and plunge from right here, it suggests the possibility of a test of the intersection at 2100ish in Aug or Sep 2018 (the white dot.) This would be a 21% drop, equivalent in scale to the one between May-Oct 2011. But, would you want to bet on that?
All things considered, what posture should an equity investor take? The environment remains very difficult for day trading or even swing trading. Dips, whether big or small, seem to get bought pretty consistently — meaning that shorting is really tough.
Yesterday, when SPX fell through a channel line and the SMA5 200, we had a clear signal. Check. It dropped through and closed below the bottom of the channel. Check — a bearish signal. The SMA10 was just below — an obvious target.
This morning, however, it gapped open, rallied 20 points off the close within the first hour, then continued to melt up — to new all-time highs. 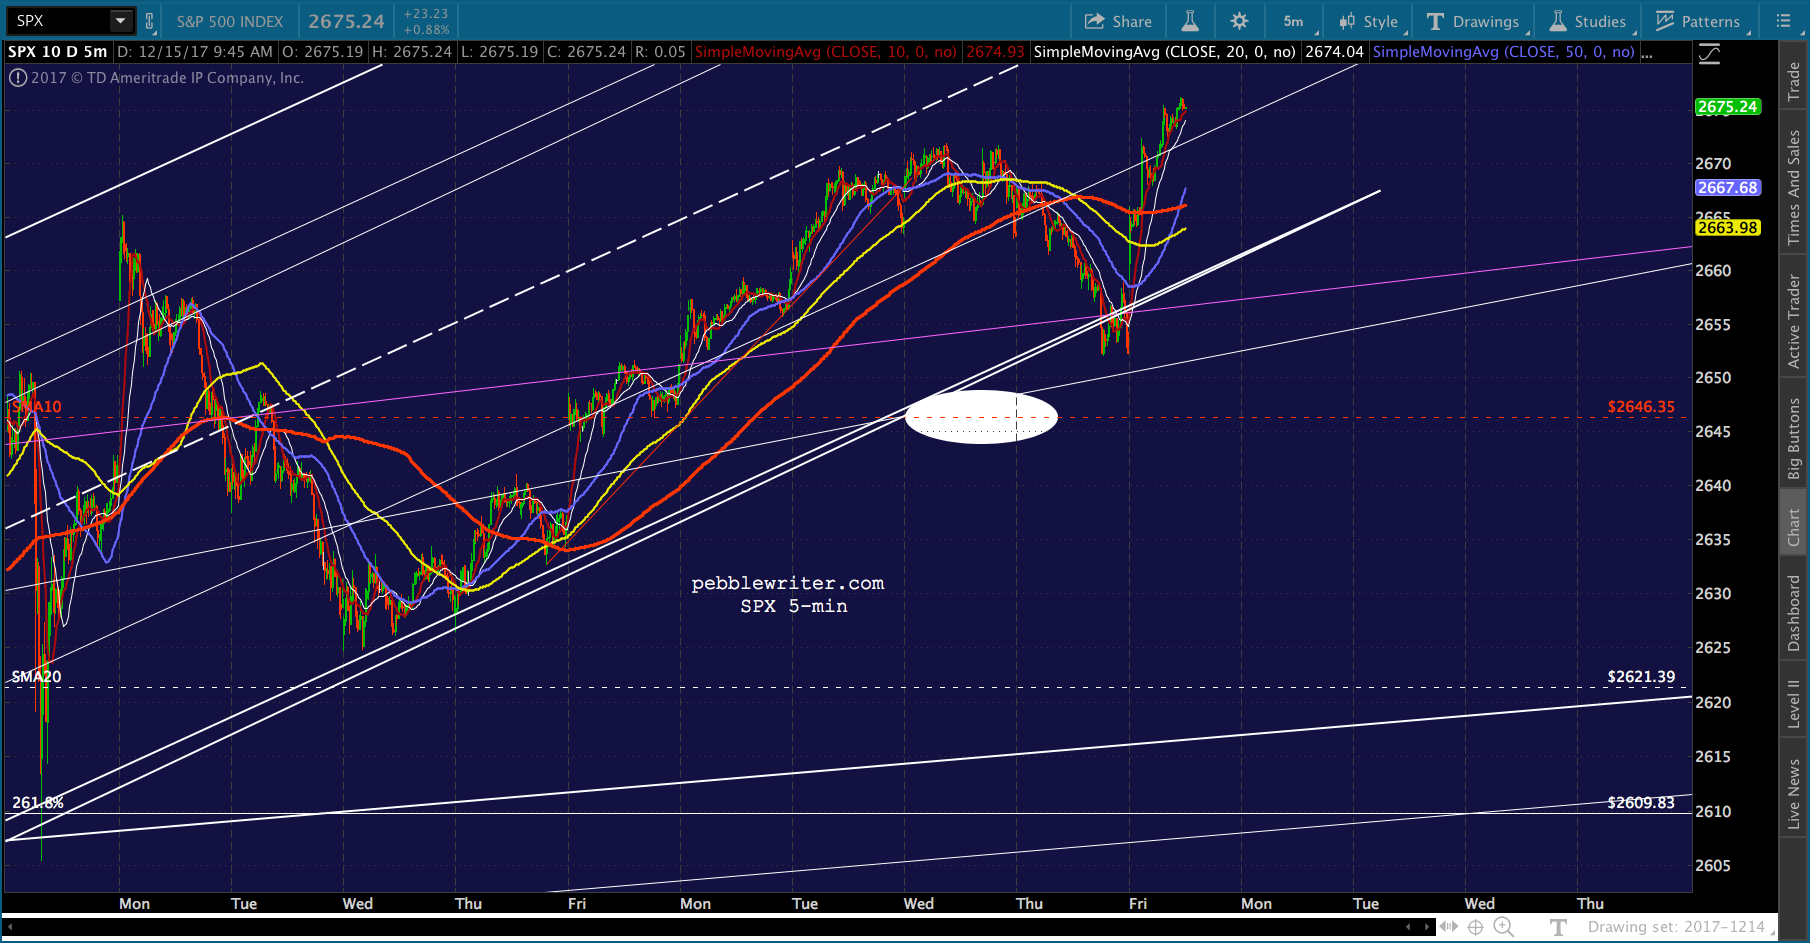 It was all courtesy of a 12% intraday plunge in VIX and a pop in USDJPY.
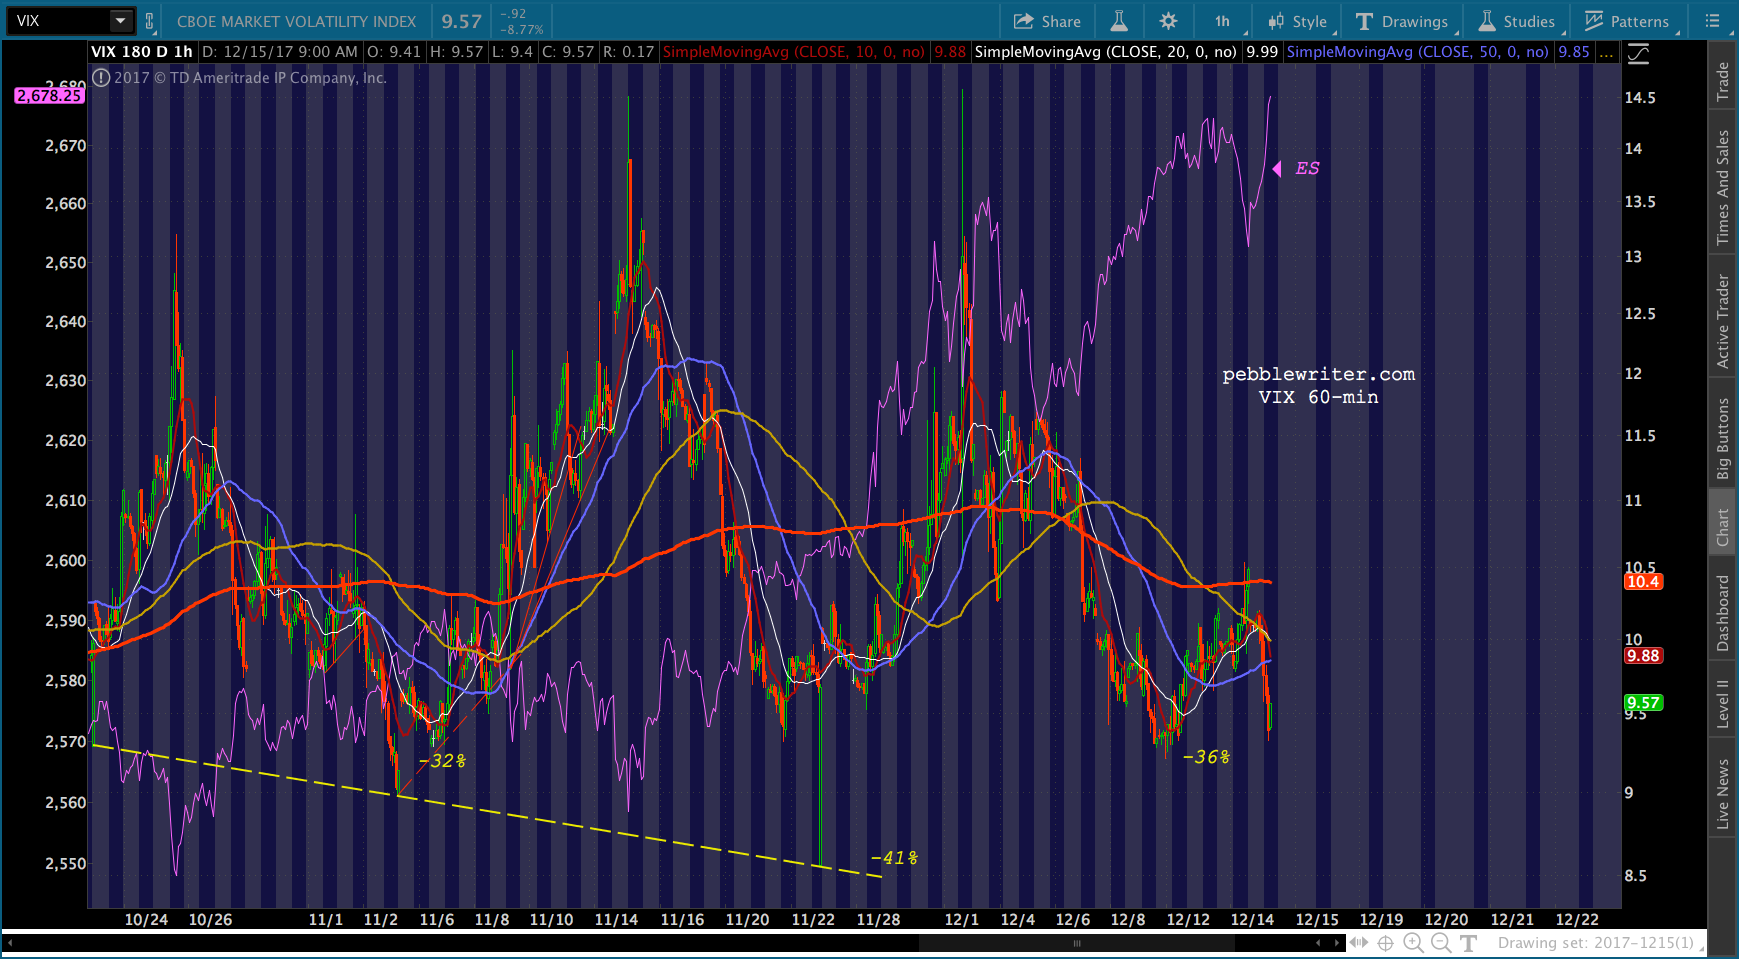
Bottom line, equities will remain safe and continue rising until they don’t. I’ll occasionally try shorting on some channel breakdowns, but will continue to be very careful about overnight risk and will use tight stops.
One of these days, the dip won’t be bought — a failure of the tax bill, a major escalation in MENA or Korea, etc. But, until then, there’s more upside in playing the drivers of the algos rather than trying to guess when the algos will grant permission for stocks to sell.
Today’s action is all about VIX, as shown above, and USDJPY, which got a nice bounce off our midline.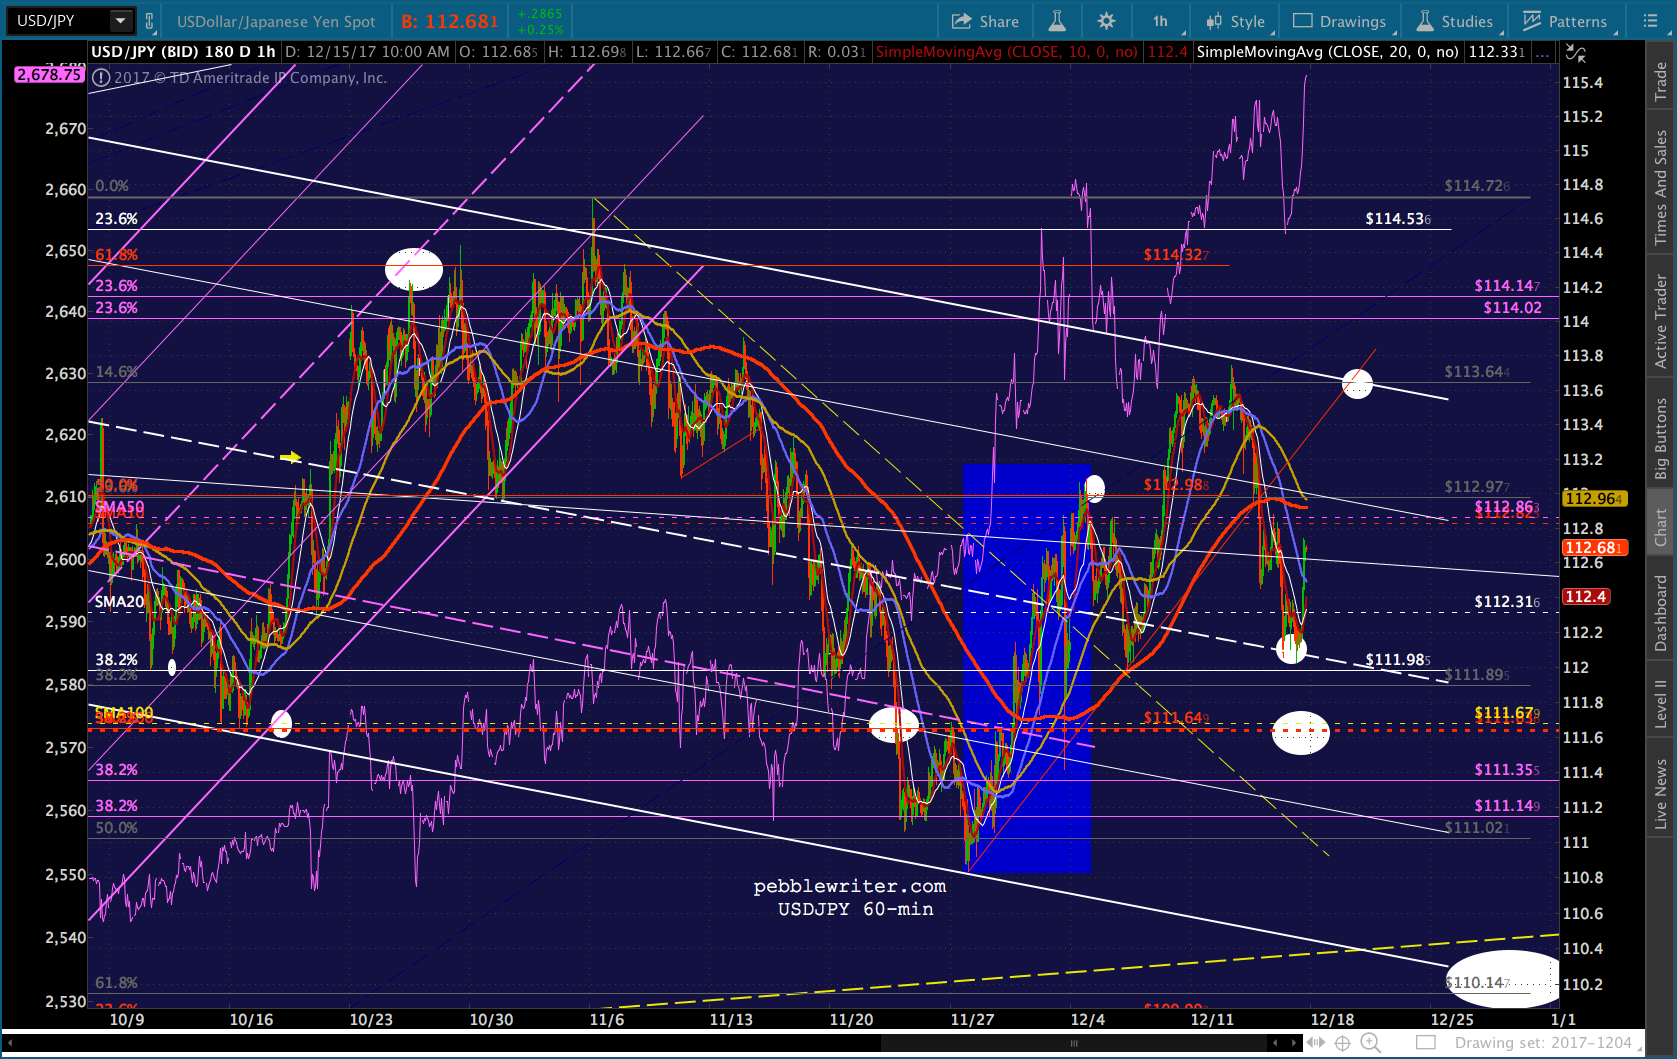 In the tug of war over the tax bill, DXY is making out like a bandit today. The upside and downside targets were both placed on today, Dec 15. And, so far, the dollar bulls are winning. As long as DXY can remain above the SMA10, I’d maintain a bullish stance. If it drops back below it, I’d quickly switch to short.
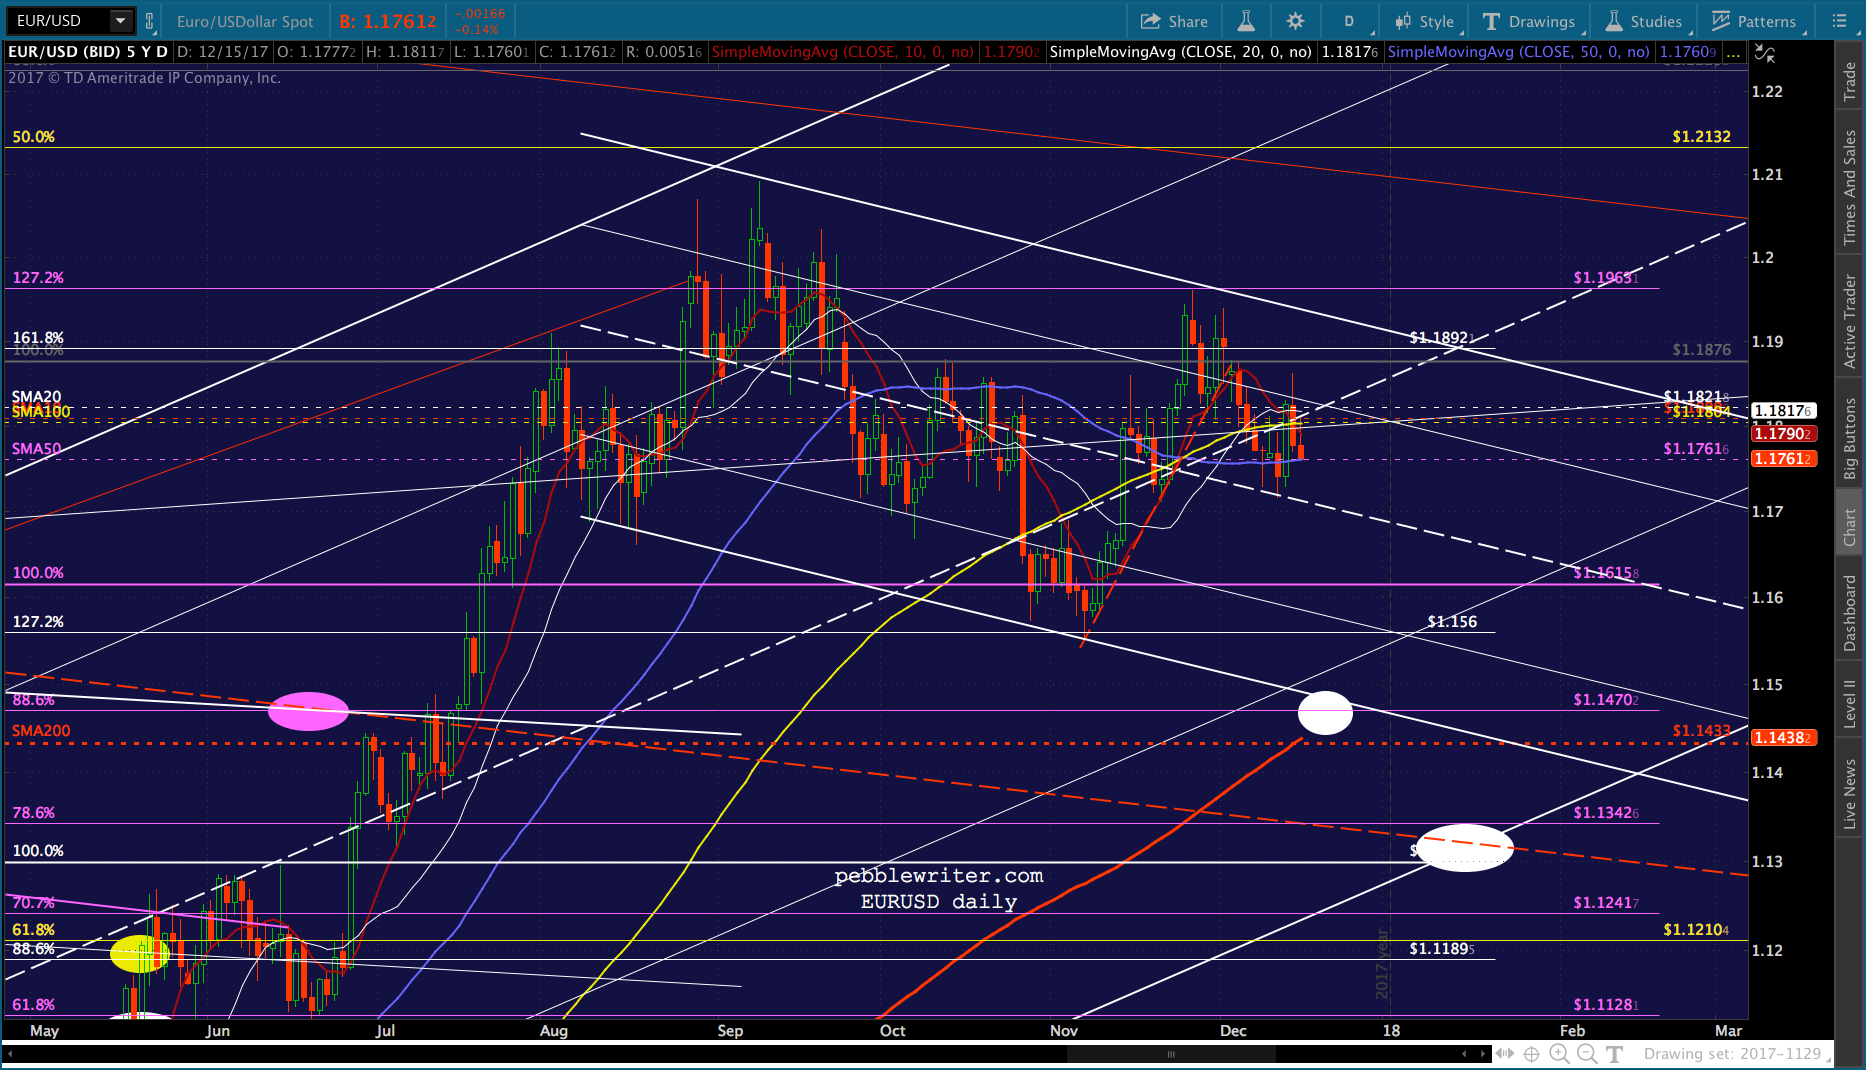
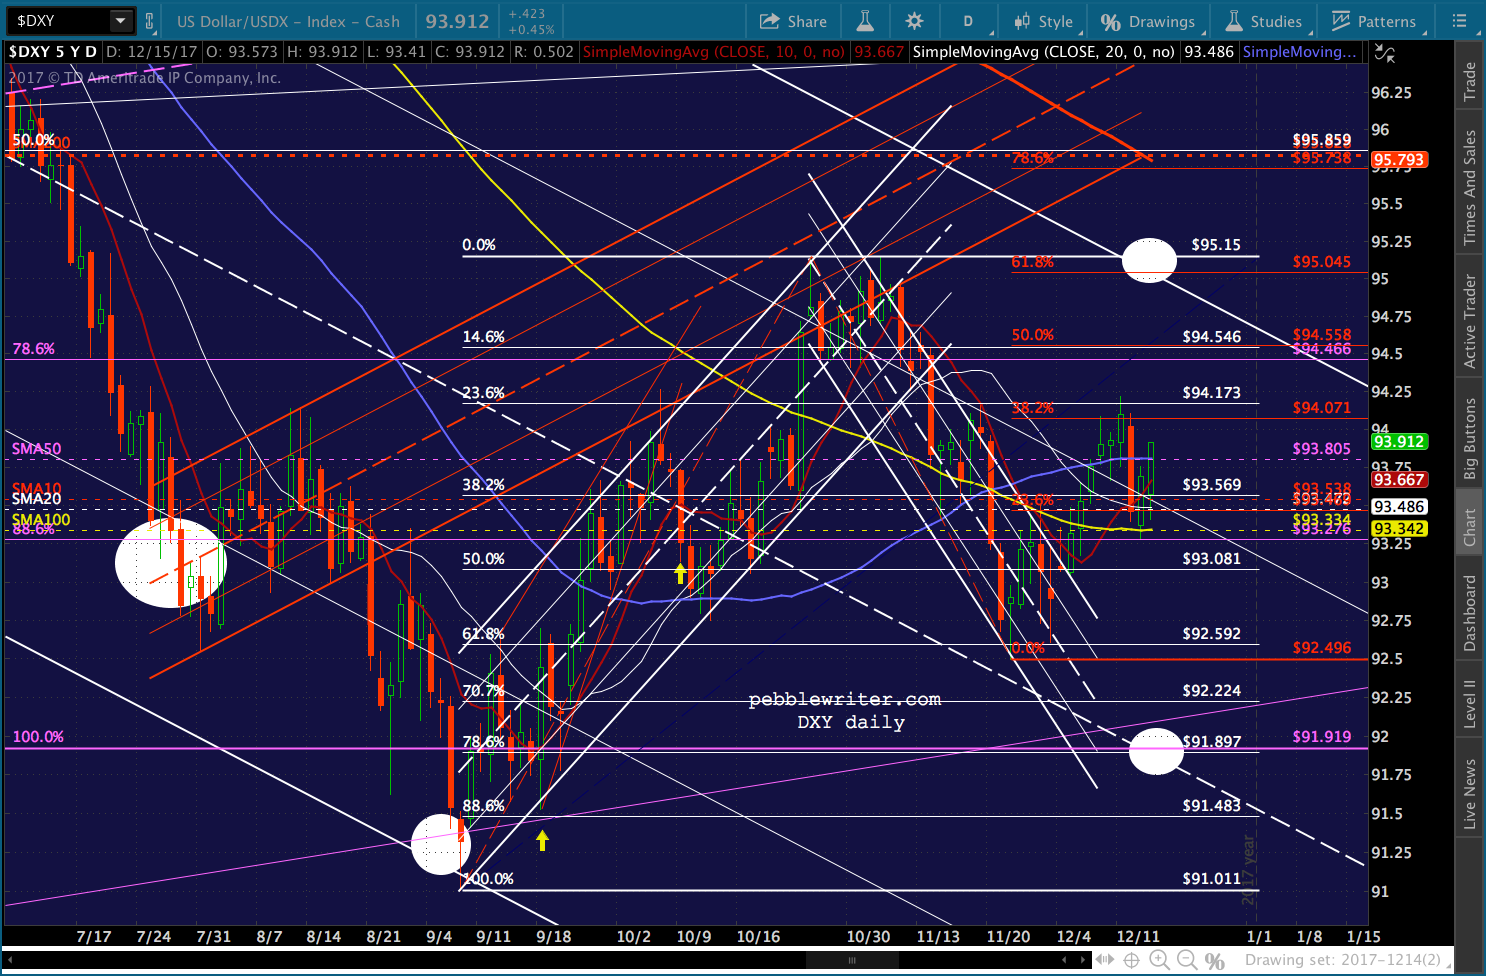 From all appearances, EURUSD has plenty more downside to come. But, if Congress can’t get its act together, all bets are off.
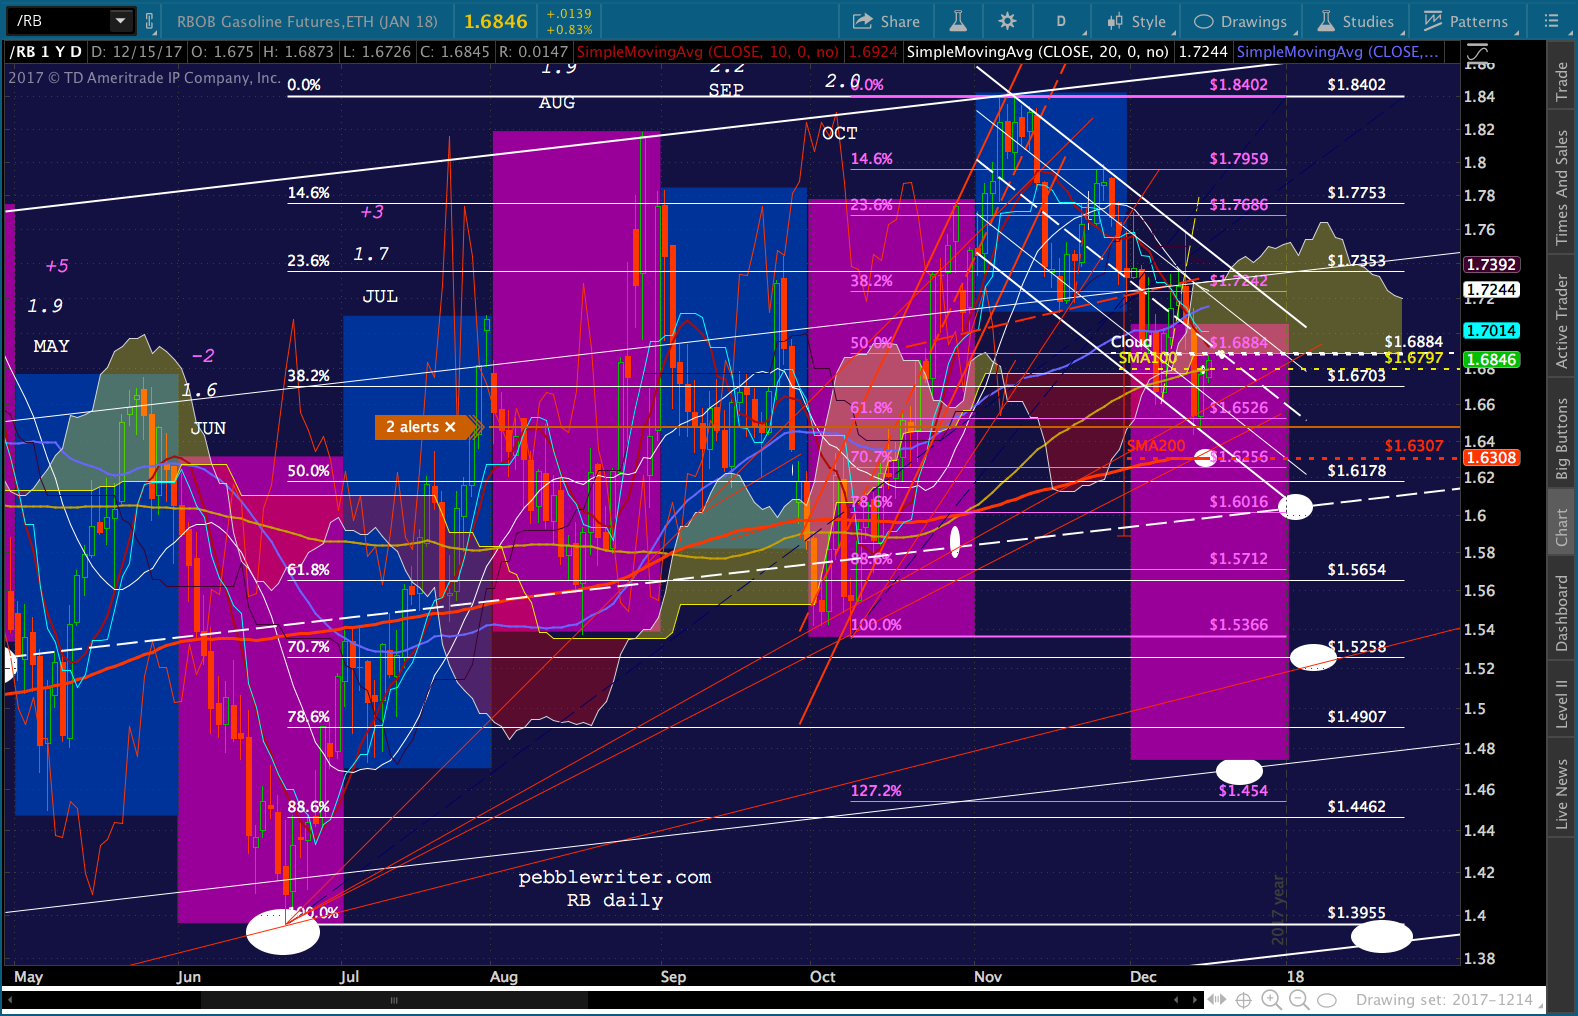
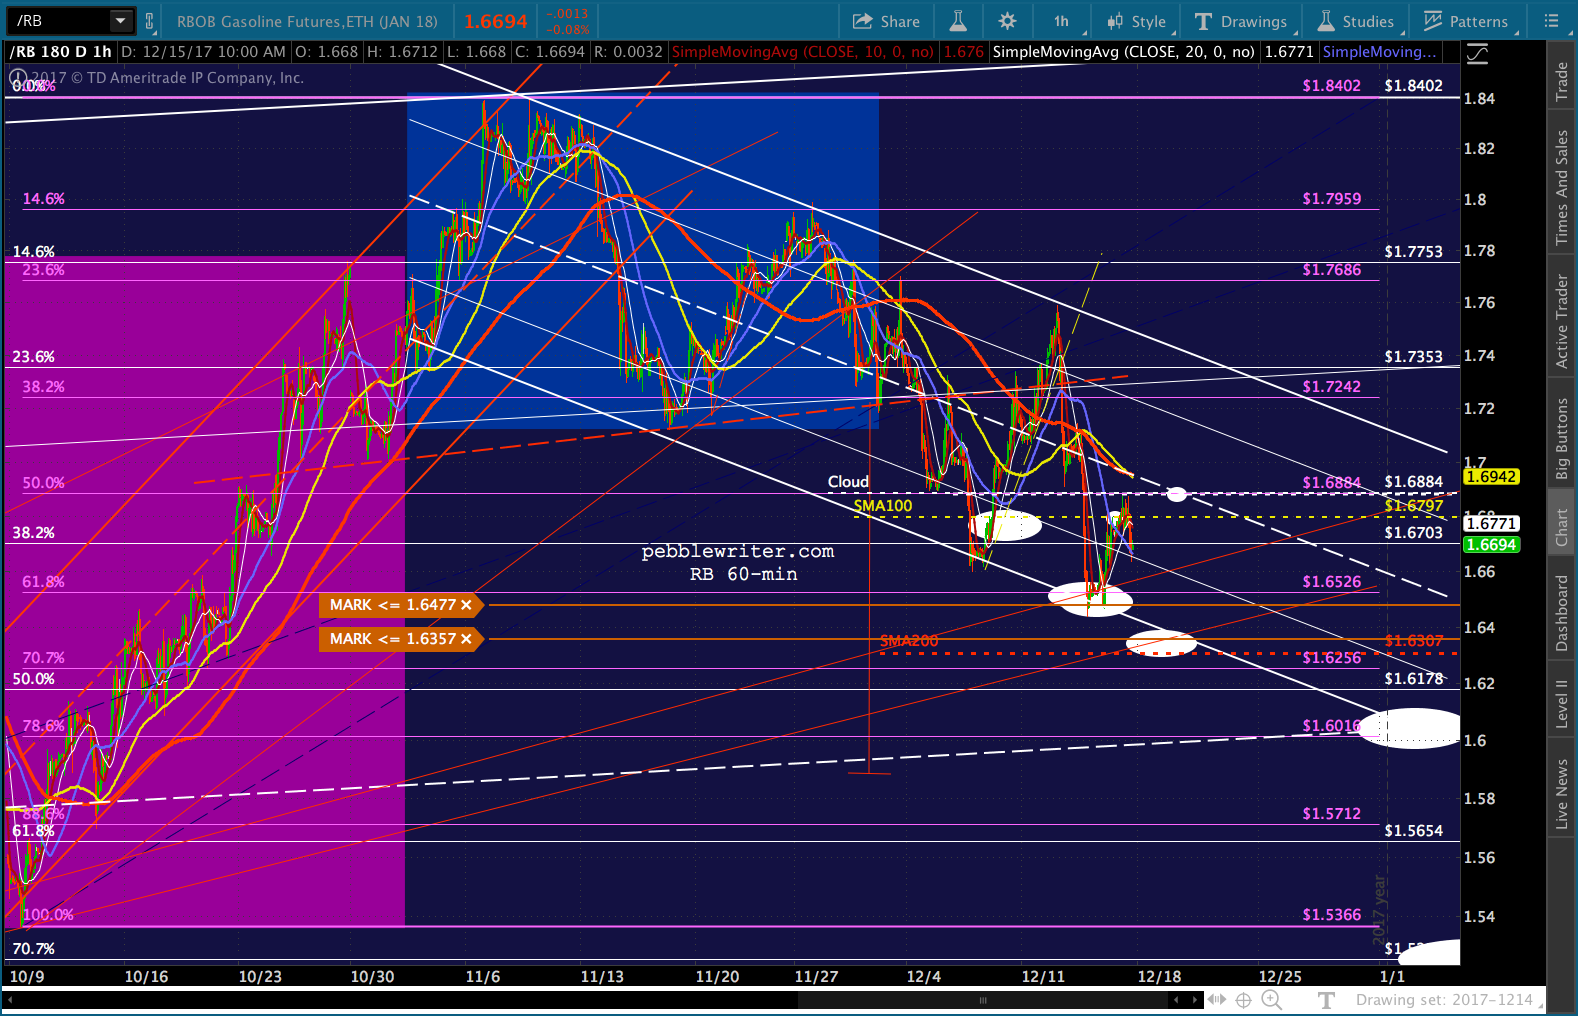
 RB ran up and tagged our upside target – the bottom of the cloud (1.6873 vs 1.6884) and is slipping back down. I still favor the SMA200 at 1.6307, followed by the purple .786 at 1.60; but, I’d remain long if RB rises above the cloud bottom.
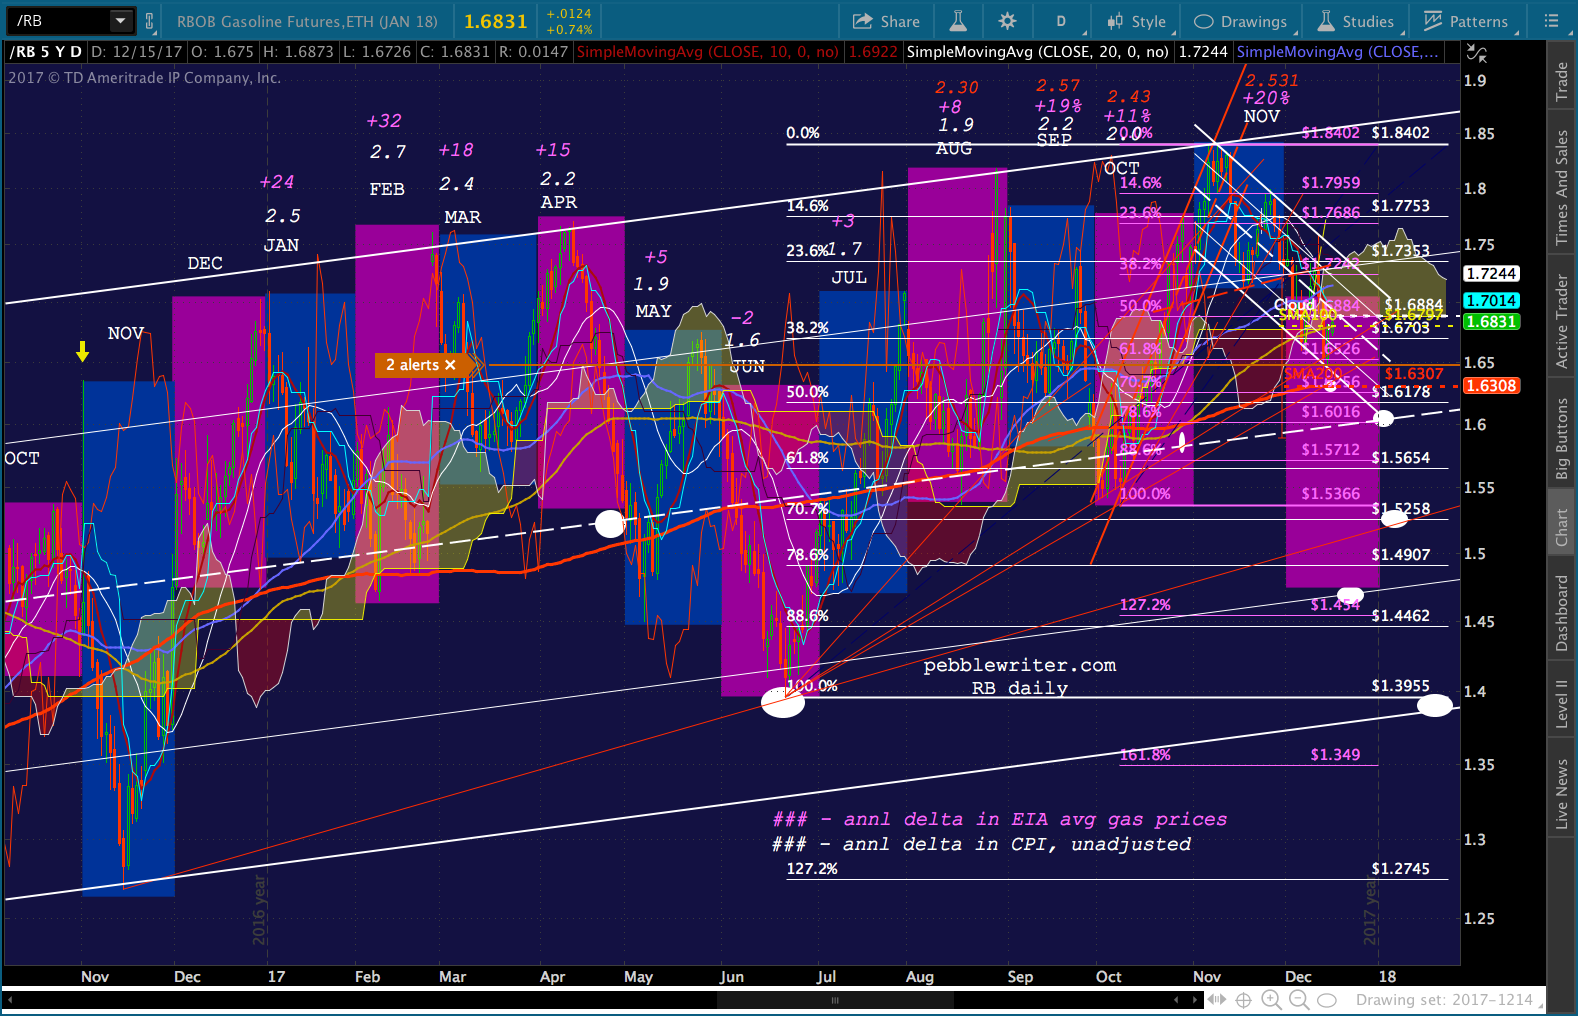
 CL continues toward another test of the yellow TL at 58.25ish.
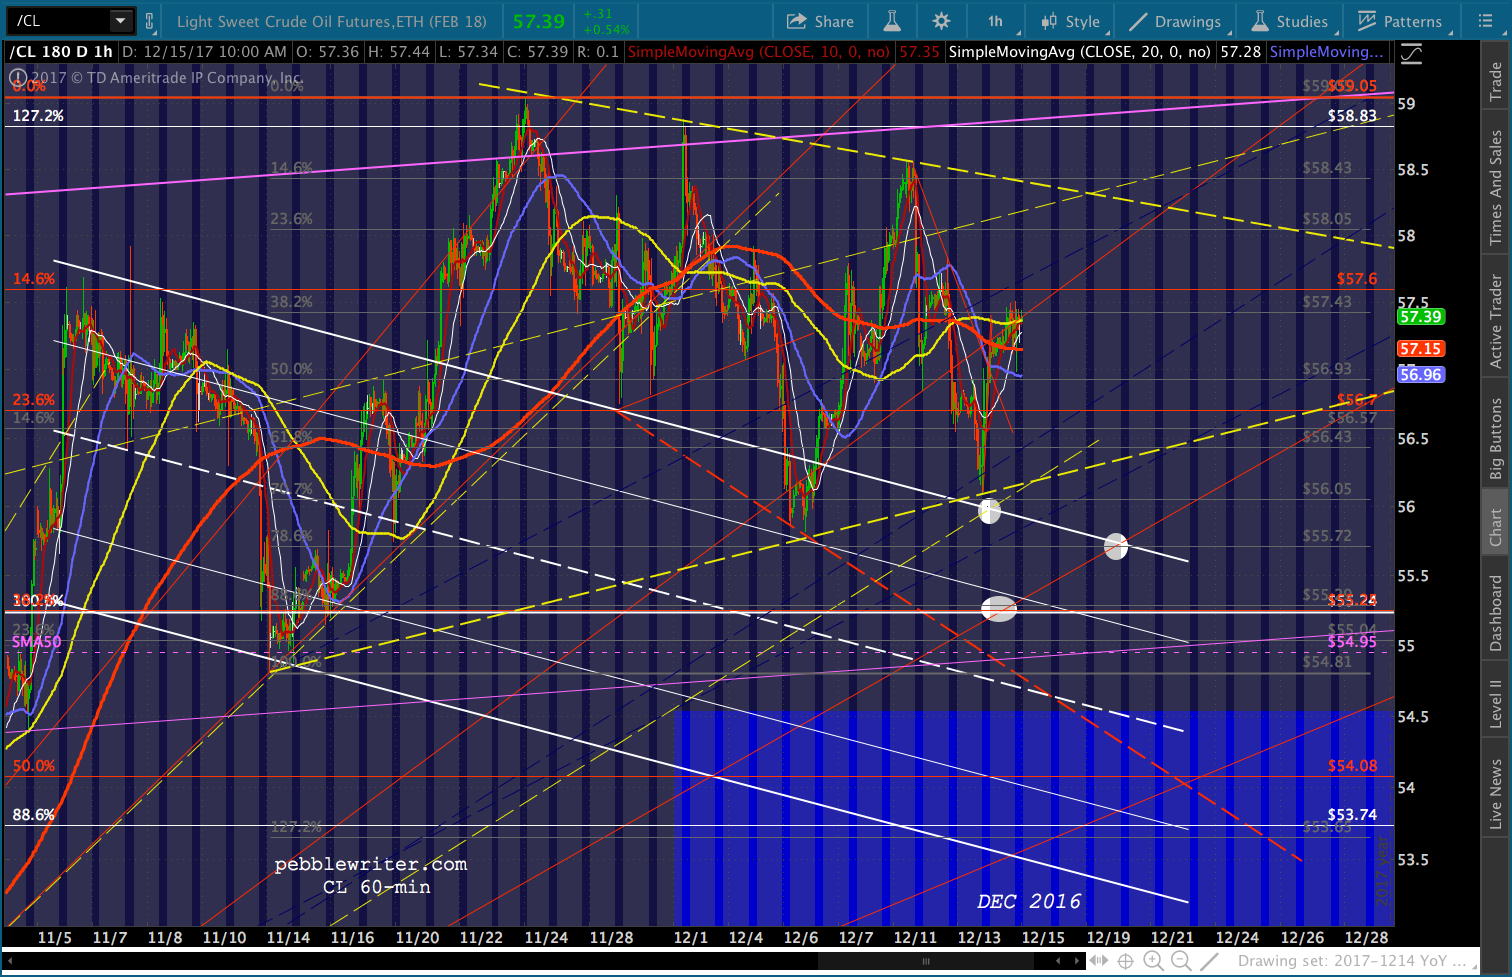 I’ll check back in later if anything exciting happens.
GLTA.