

Since markets are essentially frozen as we enter the most consequential week of the year, we thought this would be an opportune time to review the big picture.
As always, we began the year [see: A Look Ahead at 2024] with specific targets.
SPX: “The most important chart pattern for SPX is the large Inverted H&S Pattern which completed on Dec 11 [and] points to 5727.” Though we identified a path to completion by June 2024, we noted that “there is definitely a possibility that October works just as well as June.”
 SPX came close to our 5727 target in June, but was rebuffed by the Fibonacci 1.618 extension and reached it instead on Sep 24.
 continued for members…
SPX went on to top the IH&S 5727 target, reaching 5878 on Oct 17 before slumping back to its SMA50 on Oct 31.
The logic that supported our bullish scenario remains in place: the powers that be – even many hard right Republicans – wish to avoid a return to the turbulence and uncertainty of the previous Trump presidency. This was certainly true then of central bankers – both here and abroad. And, I believe it remains true today.
A market meltdown would provide political ammunition against Biden/Harris. A market which outperformed Trump’s would at least be immune from weaponization and might just convince a few folks in the middle that Harris could be trusted not to diminish their portfolios.
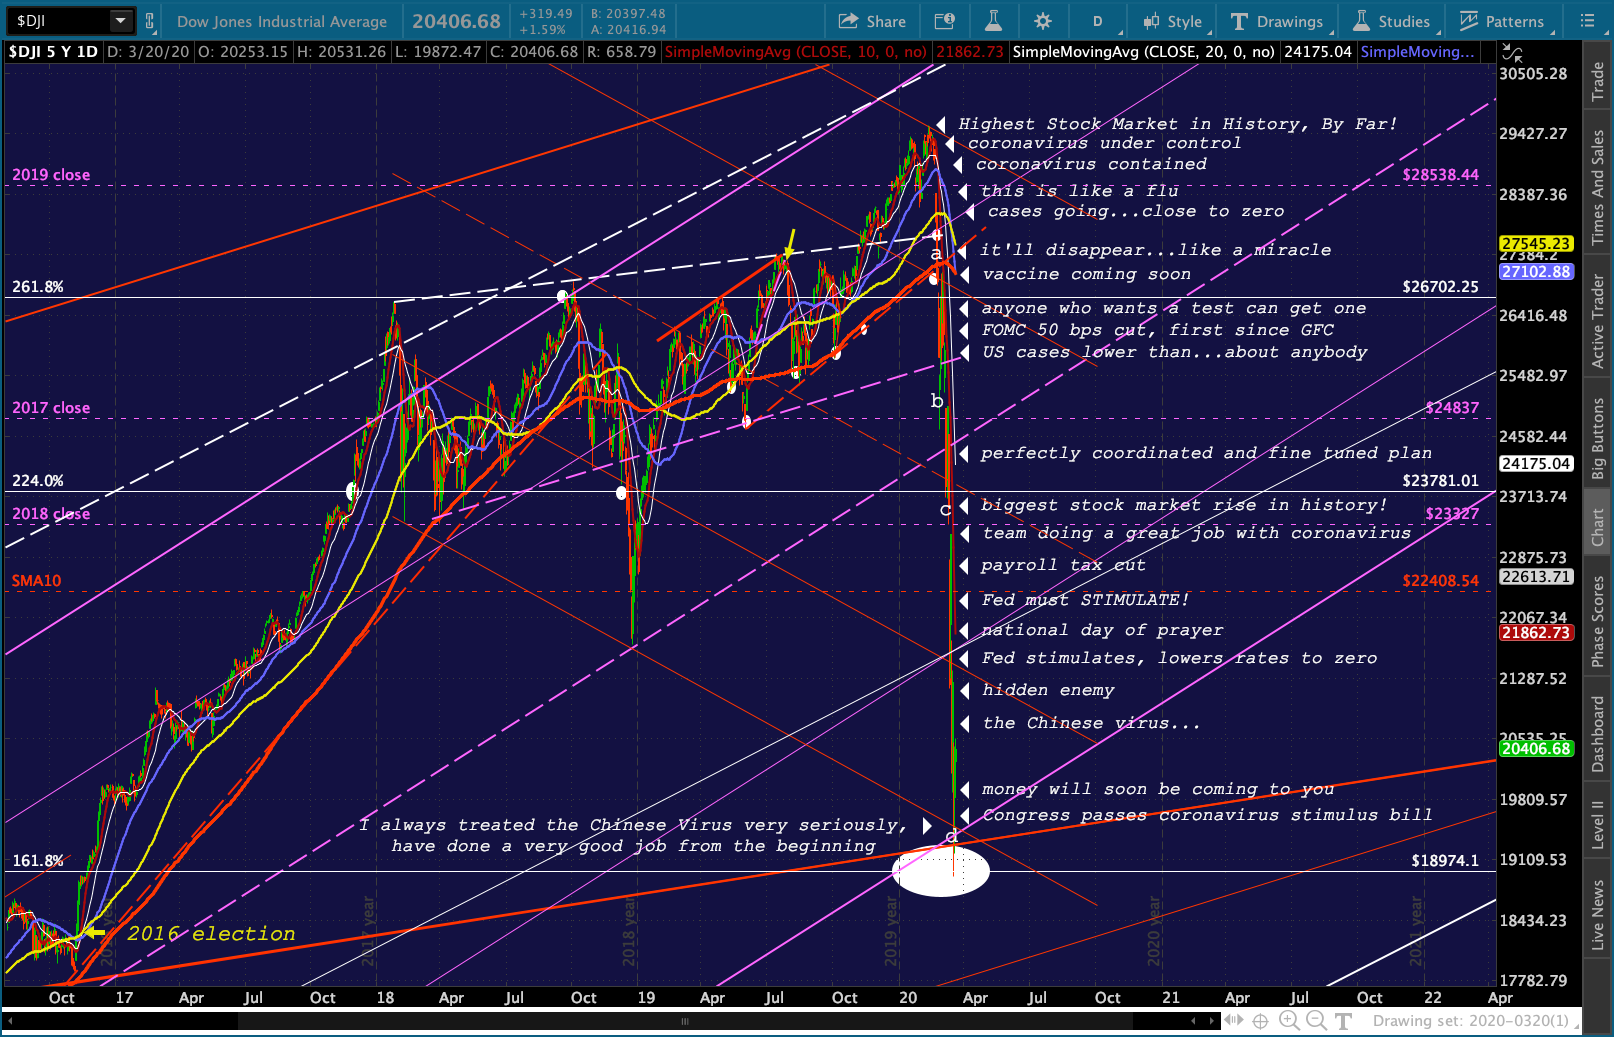
By the way, this observation is in no way meant to denigrate the Dems. IMO, every party in power has used various political and economic levers at their disposal to bolster their odds of being reelected. In fact, Trump’s stick save in 2020 is a much starker example of blatant manipulation.
As we discussed in FOMC Embraces MMT, Trump, Congress and the Fed all agreed to rescue the markets only when the DJIA had reached the level at which it had traded when Trump was elected.
 It would therefore make sense, then, that the current market is relatively crash-proof until the election results are final. If Harris wins and, for whatever reason, a Trump challenge is either not in the cards or is very obviously unlikely to be successful, then the rationale to prop up stocks will at least be diminished.
If current support (the SMA50 at 5700 or the 1.618 at 5638) doesn’t hold, overpriced equities would likely tumble to the next lower level of support: the SMA200 currently at 5363 and, if that doesn’t hold, the bottom of the purple channel at 5000ish and rising to 5150 by the end of the year.
If Trump wins, then the tariff nonsense will also likely put a crimp in stock prices. The same support levels would apply.
With all that being said, we know from past experience that it’s unusual for stocks not to rally into year end. So, I would hesitate to place any bearish bets unless the SMA50 gives way. And, even then, I would be quite cautious.
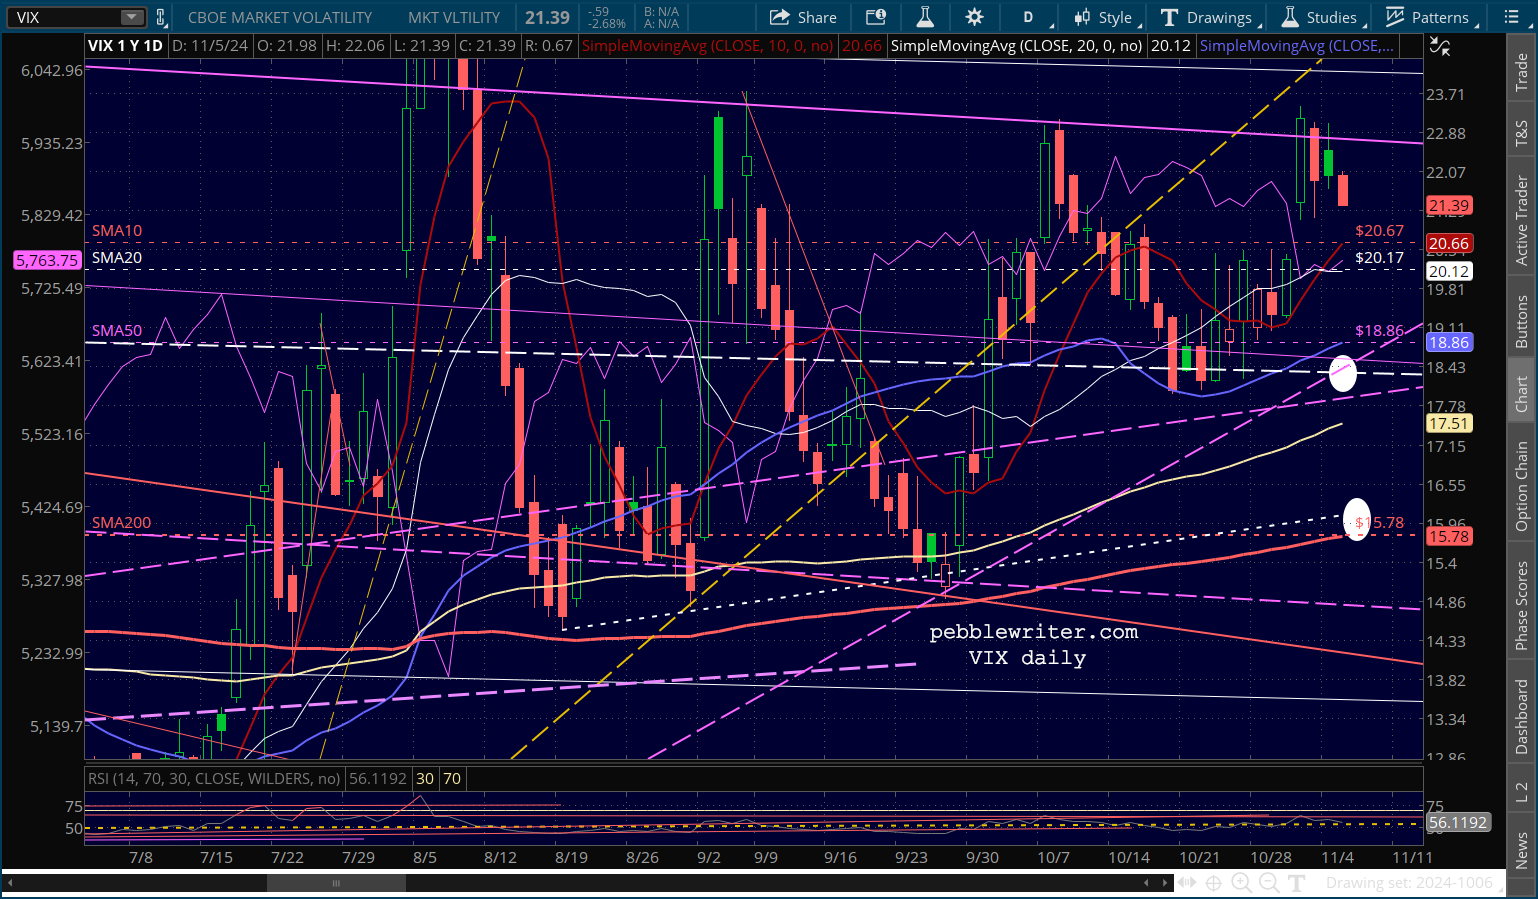
All the usual mechanisms for propping up stocks are still in force. VIX has likely topped again and is in a position to break down as it often does in such situations.
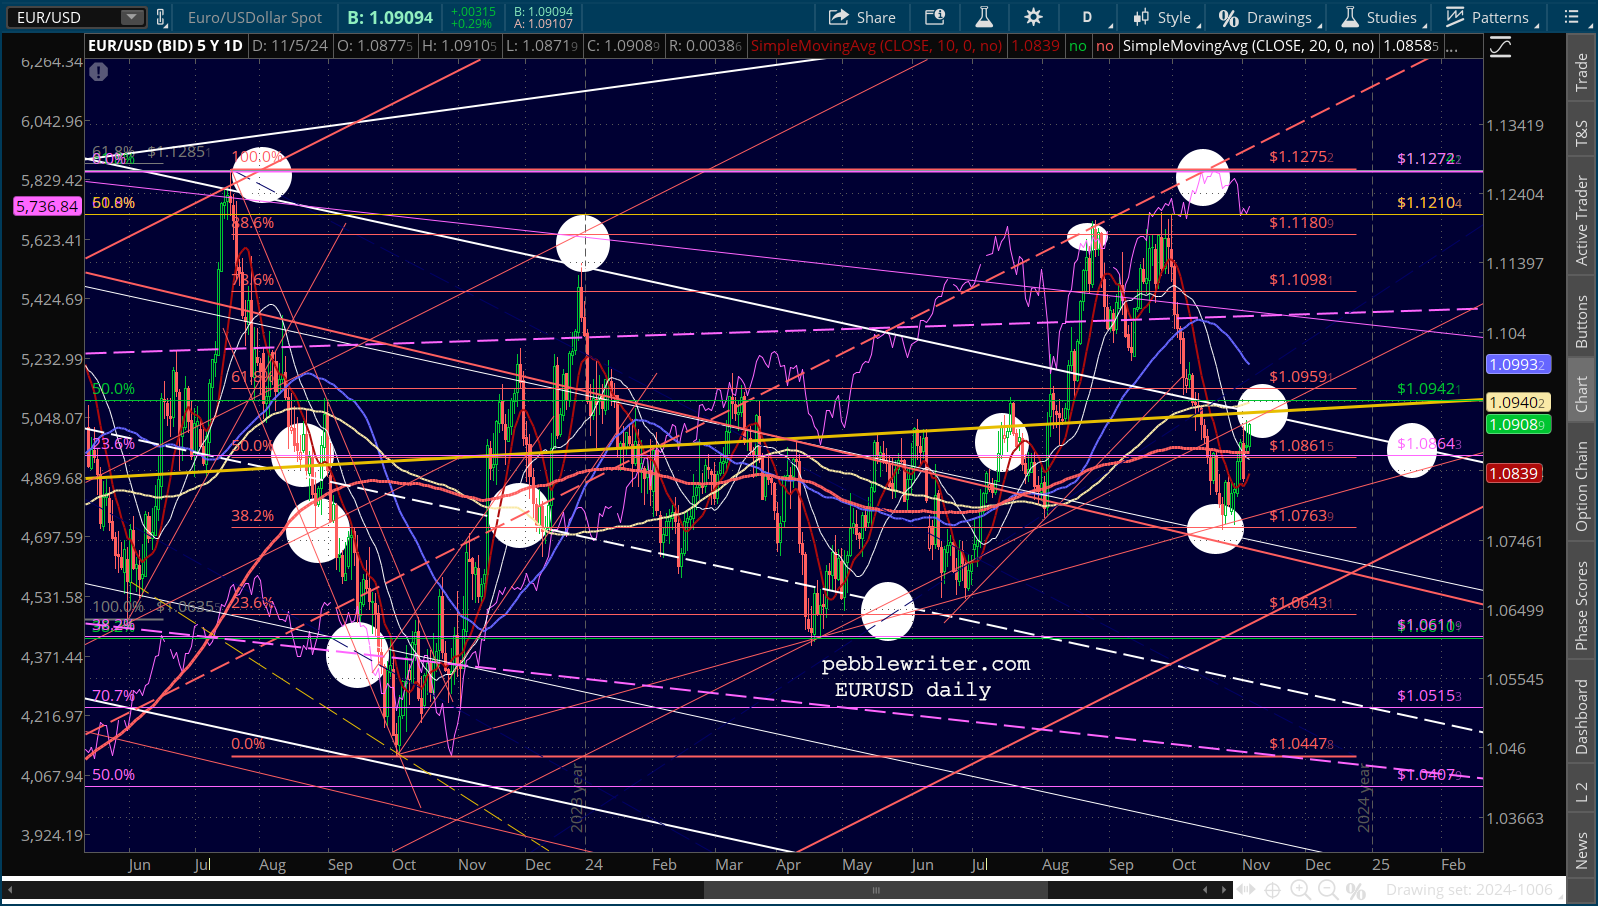
 EURUSD, which just bounced at a very predictable spot and is hovering above its SMA200, could in fact break out again instead of reversing at the white channel top.
 And, note that USDJPY has backtested its SMA200 after a sharp rally over the past 6 weeks.
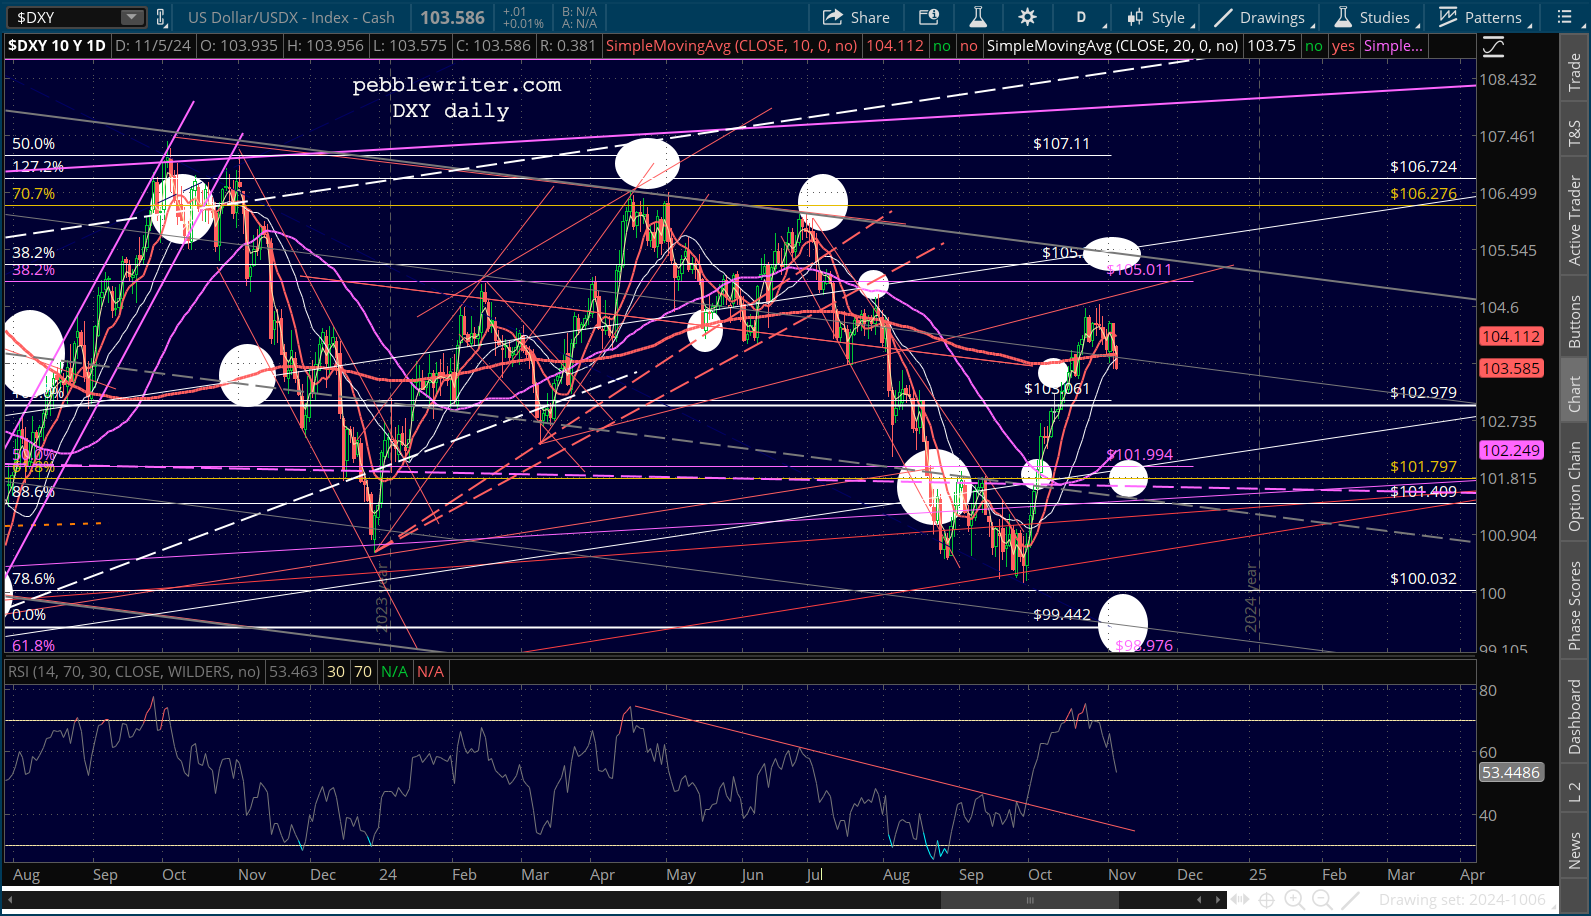
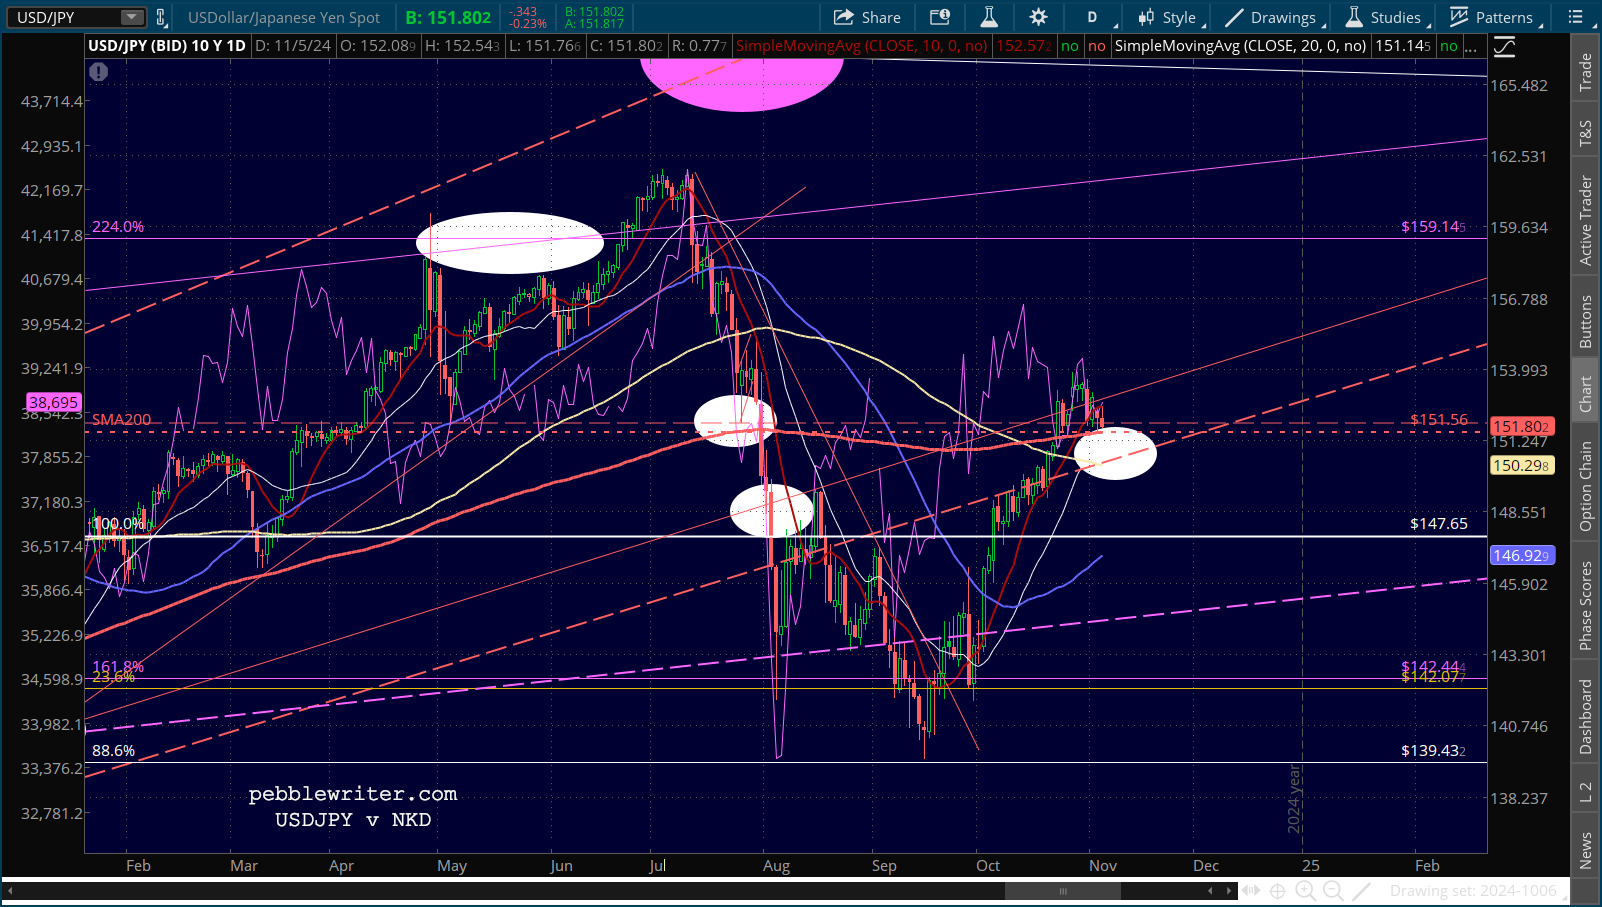 DXY just fell below its SMA10, SMA20 and SMA200 from very overbought levels. If the breakdowns hold, it could easily fall as low as 99.40 again.
 But, “what about fundamentals?” you ask. That’s where things get interesting. The economy seems increasingly likely to experience a soft landing – not because Americans are so flush, but because inflation appears likely to become problematic again with a time series that favors the bulls. Here are the key dates to keep in mind as we look ahead:
Nov 5: US election
Nov 7: FOMC rate decision
Nov 13: October CPI
Nov 27: October PCE
Dec 10: November CPI
Dec 18: FOMC rate decision
Remember, CPI involves a lag. That is, the October CPI due out next Wednesday Nov 13 reflects the price change from Oct 2023 to Oct 2024. We don’t know exactly what the YoY delta will be, but we do know that it is highly correlated with the YoY change in gas prices.
 The YoY gas price change reached -15.83% in September and, if prices remain steady, has already bottomed. It should come in at around -11.72% in October and climb rapidly to +0.61% by January.
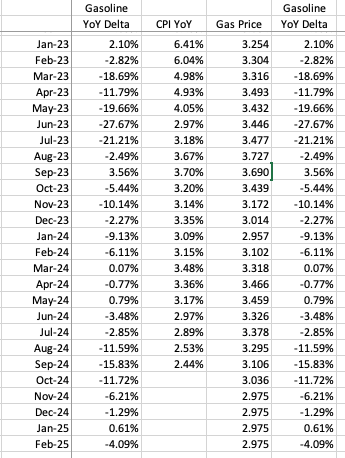 This suggests that CPI probably bottomed out at 2.44% (Sep) and will climb back over 3% by the end of the year. This further means that the CPI reported next week (for October) could be slightly higher, but that a substantial increase won’t occur until November and be reported until December 10.
The market will have a week or so to gnash its teeth until the Fed announces on Dec 18 that it will pause its rate cuts or actually increase rates. By then, the market stands a good chance of being caught up in the usual window dressing that tends to happen in December, ramping up prices due to FOMO.
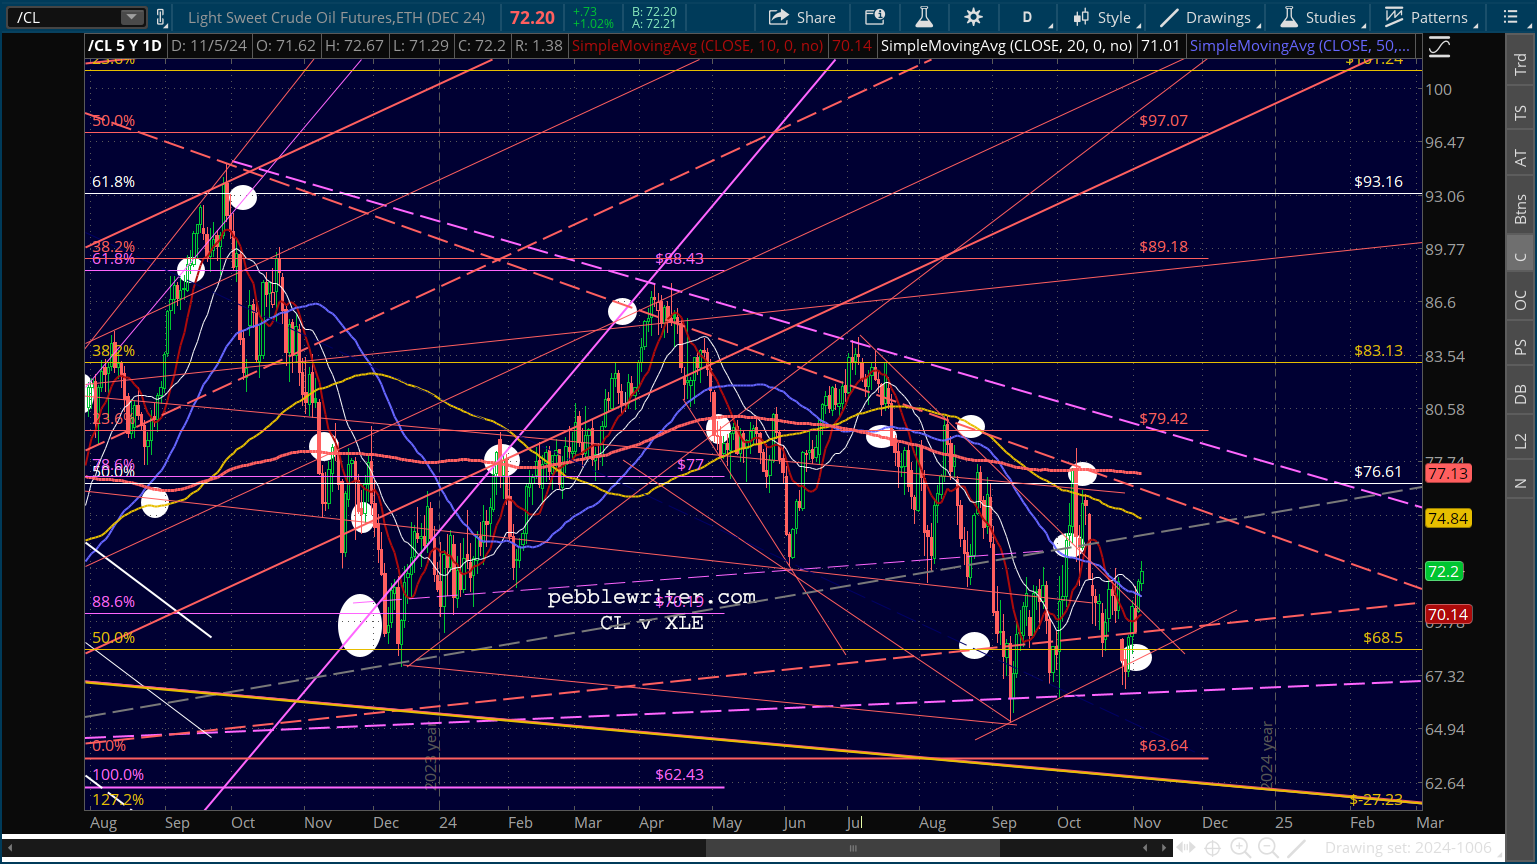
With what’s happening in the Middle East right now, it’s hard to imagine oil and gas prices cratering any time soon. But, it’ll be pretty easy to spot it if it does happen. Both CL and RB have clearly defined TLs of support.
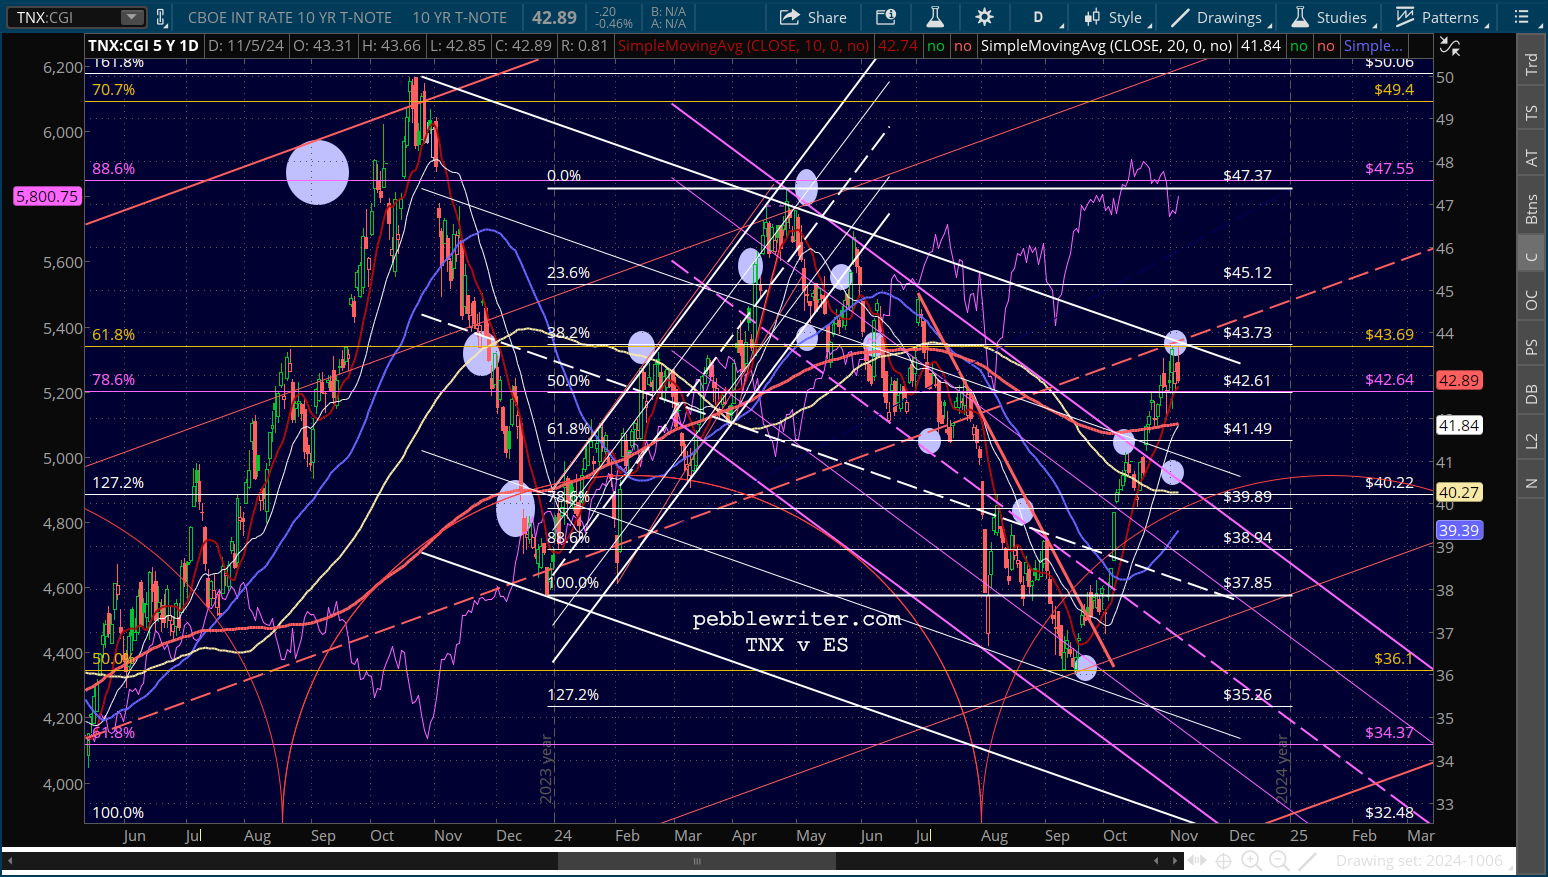
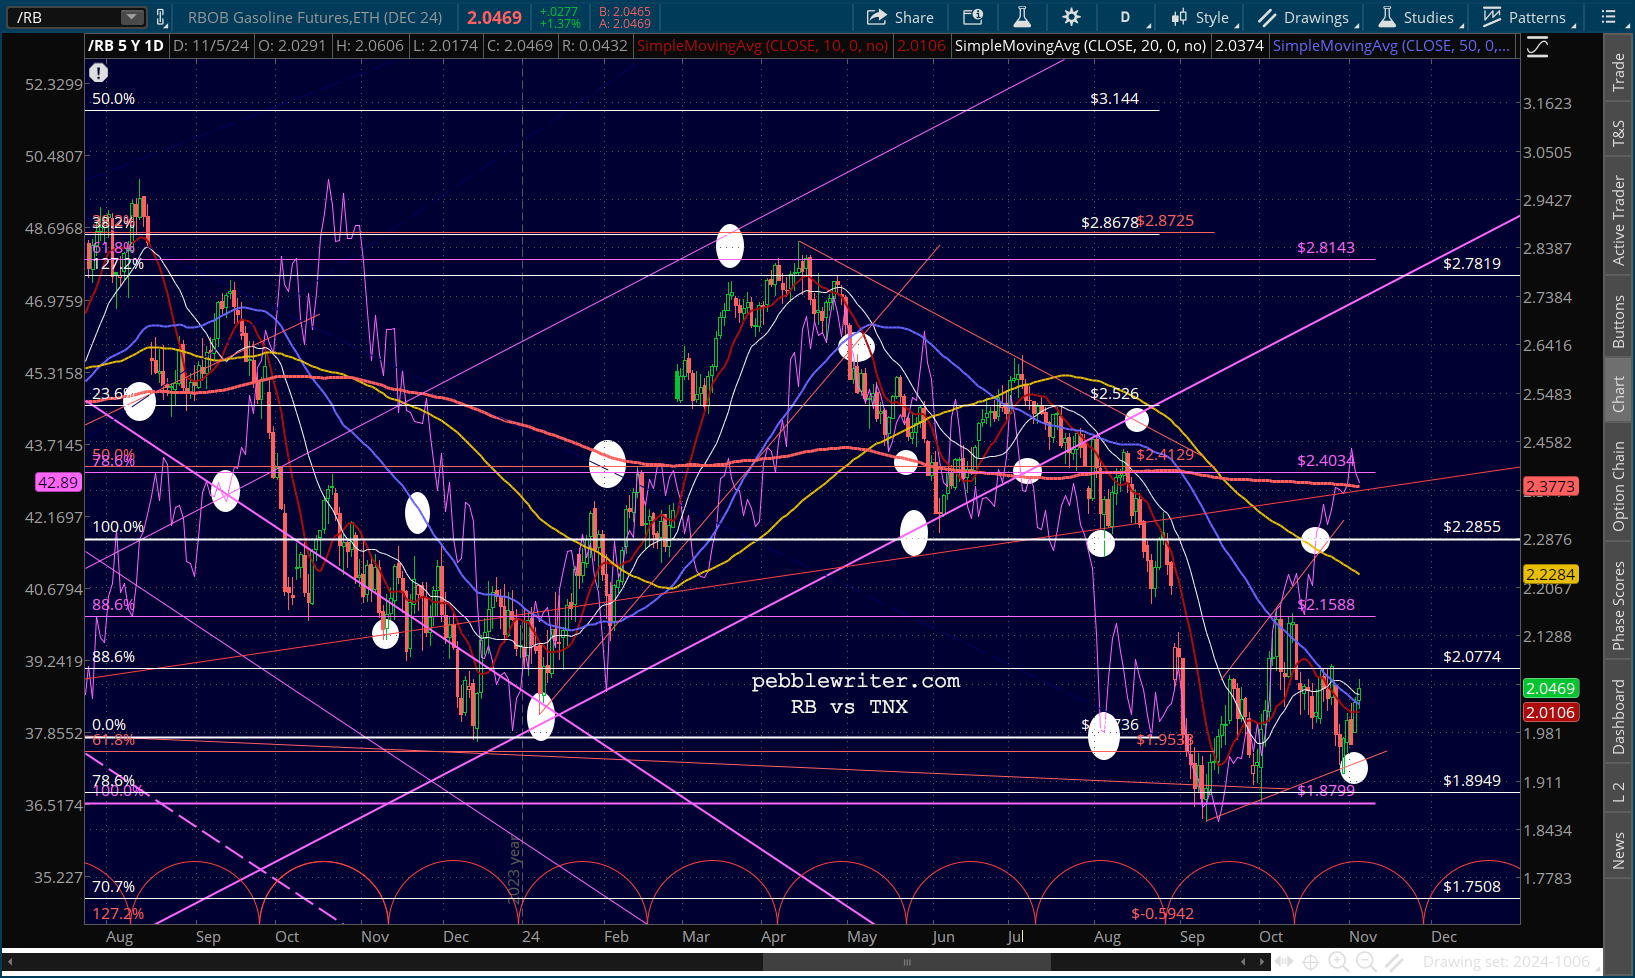 And, if the 10Y reacts by breaking out of a year old falling channel, you’d better believe that folks will notice. Algos will not be amused. In other words, TPTB have quite the challenge ahead of them, keeping the plates spinning long enough to finish the year on a high note.
 Stay tuned…