

The one constant about VIX is the series of lower lows and lower highs since 2022, forming the purple channel below. The channel was obviously broken out of several times, mostly notably by the brief August 2024 and April 2025 spikes to 65.73 and 60.13 which served as the top of a sharply rising white channel dating back to July 2024.
VIX sits today at the intersection of the two channels, meaning the next move will be very important.
 continued for members…
Note that VIX’s RSI has, at the same time, been making a series of higher lows dating back to Nov 2022. If we zoom out, we can see the same pattern has been taking place since 2020, shown as the large white falling channel.
 VX has also been in a falling channel since 2022 (in purple), with a rising red channel taking over lately.

 The difficulty faced by traders is that the occasional spikes, which obviously accompany large downdrafts, are seemingly random – especially when Trump has been in office, since many major events such as tariff policy announcements and military conflicts are very difficult to anticipate.
VIX has long served as a very effective means by which to goose the market. Bearish economic news at 8:30? No problem. Just hammer VIX for the next hour to cancel out the correction. The process is surprisingly easy and is described in this Bloomberg article which summarizes a white paper published by UT professor Dr. John Griffin.
I bring up VIX manipulation with respect to the big picture because, in my opinion, we have seen an unprecedented level of market manipulation since Trump’s second term began. There was an initial pop in equities, driven by the assumption that Trump would be good for investments in general. The first two breakdowns in VIX corresponded with his election and inauguration.
 Unfortunately for the markets, he almost immediately started taking about tariffs – initially because Mexico and Canada allegedly weren’t doing enough to limit fentanyl flooding into the US. The announcements surrounding those tariffs were a sign of the chaos to come. For an indication, just look back at the timeline of tariff announcements.
Even after the narrative shifted from fentanyl to domestic investment, the chaos continued. What large corporation could responsibly relocate manufacturing from China to the US in the face of ever-changing policies? Those which refused and called Trump out on the obvious price increases that would result were publicly shamed and punished. So, many made perfunctory announcements, maybe even buying a patch of land and announcing plans to build on it. Others just kept their mouths shut.
In any case, so called “liberation day” saw the most recent spike out of the falling purple channel. VIX soared from a close of 21.51 to a high of 60.13 between Apr 2 and Apr 7. And it fell back into the channel almost as quickly, Since dropped back in on May 8, it has also repeatedly dropped below its SMA200 (23 out of the past 30 sessions.)
Continued on Jun 23…
OIL & GAS
Things heated up a bit over the weekend, with the US bombing Iran’s nuclear production facilities. The repercussions are still being assessed, but Iran will likely respond in some way, with oil and LNG transportation through the Strait of Hormuz a potential target. Analysts are all taking their best guesses as to the price of oil should that occur, with estimates ranging from $90-110/barrel.
This would clearly affect the inflation picture. As we have discussed often, the relationship between oil/gas prices and inflation is quite strong. As depicted below, even a 10% increase in the price of gas would send CPI to 3% or higher.
 Oil broke out of its triangular pattern on Jun 13 and has remained above it, testing a TL connecting the two previous highs.
 The bottom of this pattern has been pretty consistent except for the breakdown which occurred between Apr 7 – Jun 11. The bottom of the pattern could also be interpreted as the neckline of a huge H&S pattern that targets about zero, so it’s quite important to folks like OPEC to ensure that CL remains above it.
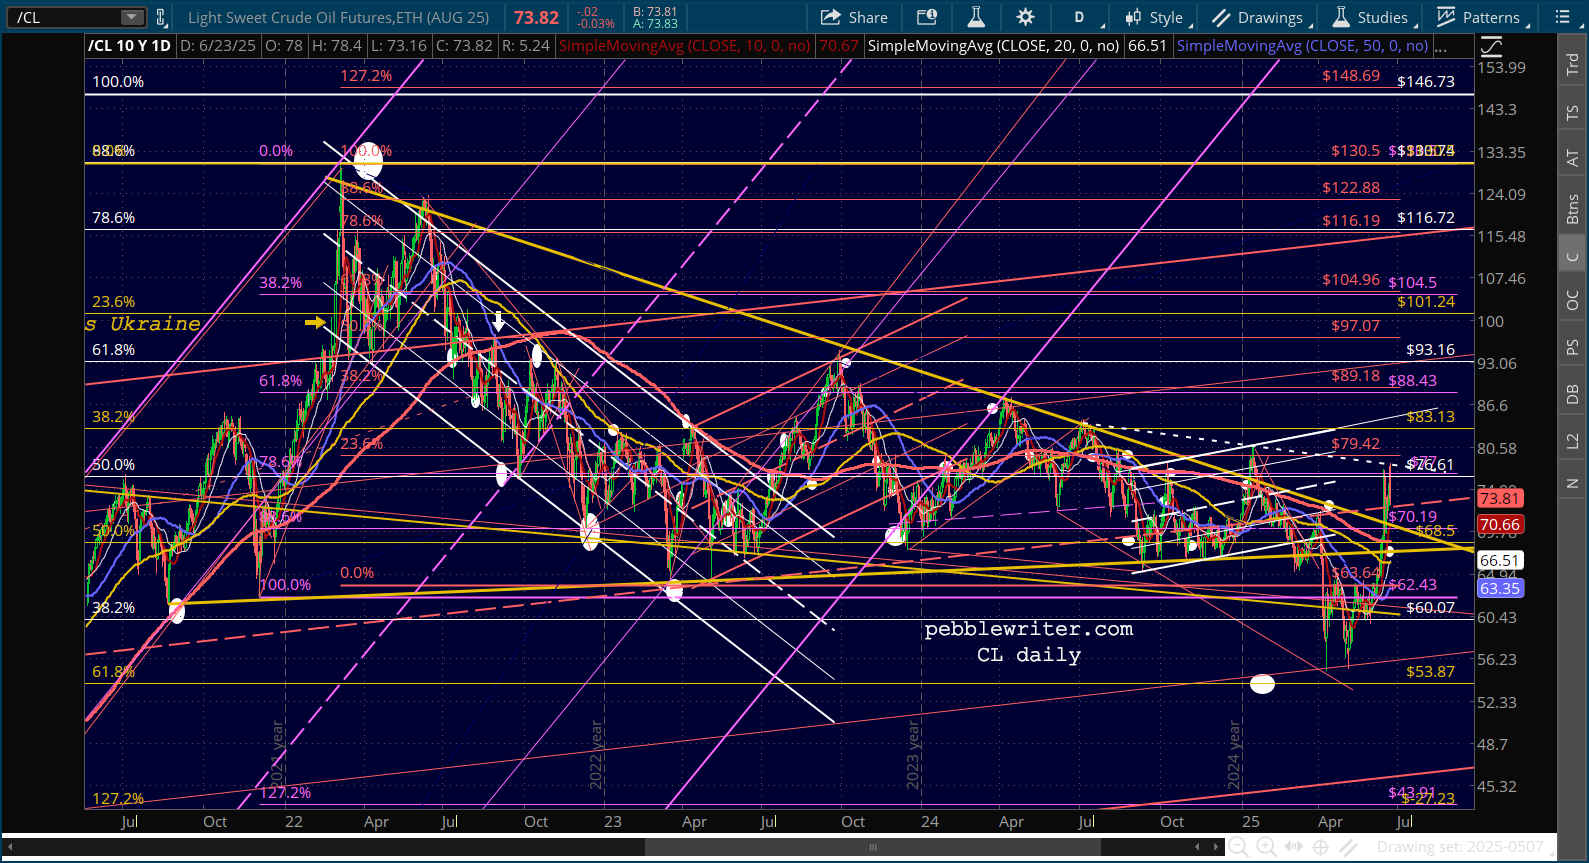 If we zoom out, the top of the giant falling channel from 20+ years ago becomes the much more important support.
 RBOB has a very similar shorter term pattern. The bottom of the triangle below…
. … overlaps the huge falling channel top on the weekly chart.
 The patterns and charts are interesting, but we want more than that. We want forecasts! What they suggest to me is that Trump has struck a deal with OPEC and the US majors that stipulates that oil prices won’t break down, but will also not spike much higher.
 I assume the administration has a brain trust which is at least as sophisticated as yours truly and that they have done the math: A spike in oil prices makes Fed rate cuts extremely unlikely. At some point, it even argues for a rate hike. Therefore, I assume that oil prices are due for a retreat – unless, of course, things spiral further out of control in the Middle East.
Remember, the last time oil prices reversed back below the triangle top they fell about 25%. (from January to April.) CPI fell commensurately, from 3.00% in January to 2.35% in April. There is nothing so appealing to Trump as a huge drop in inflation that would force the Fed’s hand in cutting rates.
Continued on Jun 25…
CURRENCIES:
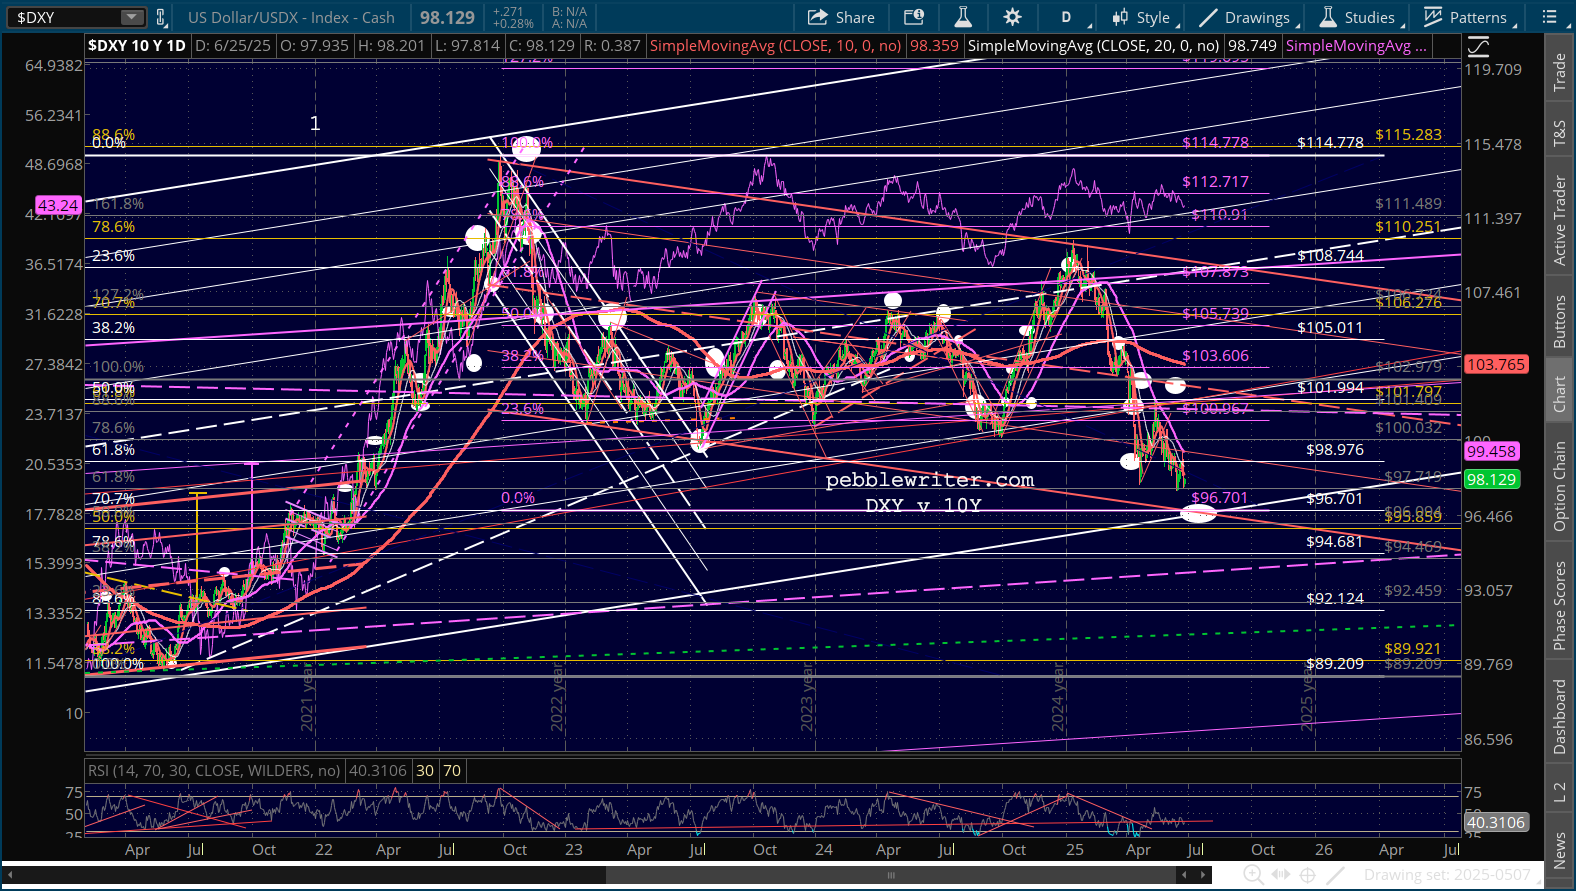
The DXY has fallen over 10% since January. While we used to talk about the yen carry trade, we can now point to the US dollar as the currency that often drives the markets. It just hasn’t been so consistent.
On the left side of the chart, back in the summer of 2022, it’s easy to see that DXY and SPX moved in opposite directions. In 2024, however, we started to see more correlated price movement. The collapse in Jan 2025 was highly correlated until May, when they diverged once again.
 Much of the divergence was related to interest rates and inflation, but there have also been several points where, due primarily to tariffs, the USD and treasuries were both under pressure. Instead of seeing the USD benefiting from rising interest rates, we saw interest rates rising and the USD falling at the same time.
What bulls need is for interest rates to decline while inflation is also falling but the economy remains strong. These things don’t coincide very often, especially if an inflationary input such as huge tariffs enters the picture. This is the Fed’s dilemma.
To further complicate things, a falling USD raises the prices (to American consumers) of foreign goods. In other words, at some point it raises inflation – though not all that quickly.
The longer-term chart suggests that our 96.70 target is a good potential max downside. It sits at the intersection of the bottom of the rising white channel and the bottom of the falling red channel. Anything lower than this means a severe breakdown in the value of the USD.
 The interesting thing about DXY is how it has made lower lows while the 10Y has not. Assuming that DXY continues falling to 96.70, we would expect the 10Y to fall to at least 3.93, but ideally 36.14 – a challenge unless inflation or the equity market collapses.
 In the two days since I began this post, CL has dropped considerably after hostilities between Israel and Iran have subsided. Were it not for the tariffs which are set to kick in on July 9 (the 90-day pause), inflation could be considered licked in short order, particularly with OPEC cooperating – at least in the short run – with Trump.
It allows him to pound the table for rate cuts now, though it’s highly unlikely that the Fed will do so without knowing first how the economy will be affected by tariffs. They are certainly aware of the potential for a transitory drop in CPI based on lower energy costs and would like not to be sucked into a monetary policy stance which proves ill advised as soon as energy prices rebound and tariffs kick in. In watching Powell’s comments on Capitol Hill this week, it appears the Fed’s policy will reflect this caution.
If the DXY is to dip a little further and rebound, it would imply that the EURUSD would rise a little further and then decline and/or the USDJPY would drop a little more and then rise. The EURUSD chart shows a clear path to the .786 Fib at 1.1746, followed by a slightly murkier path to the .886 at 1.2028.
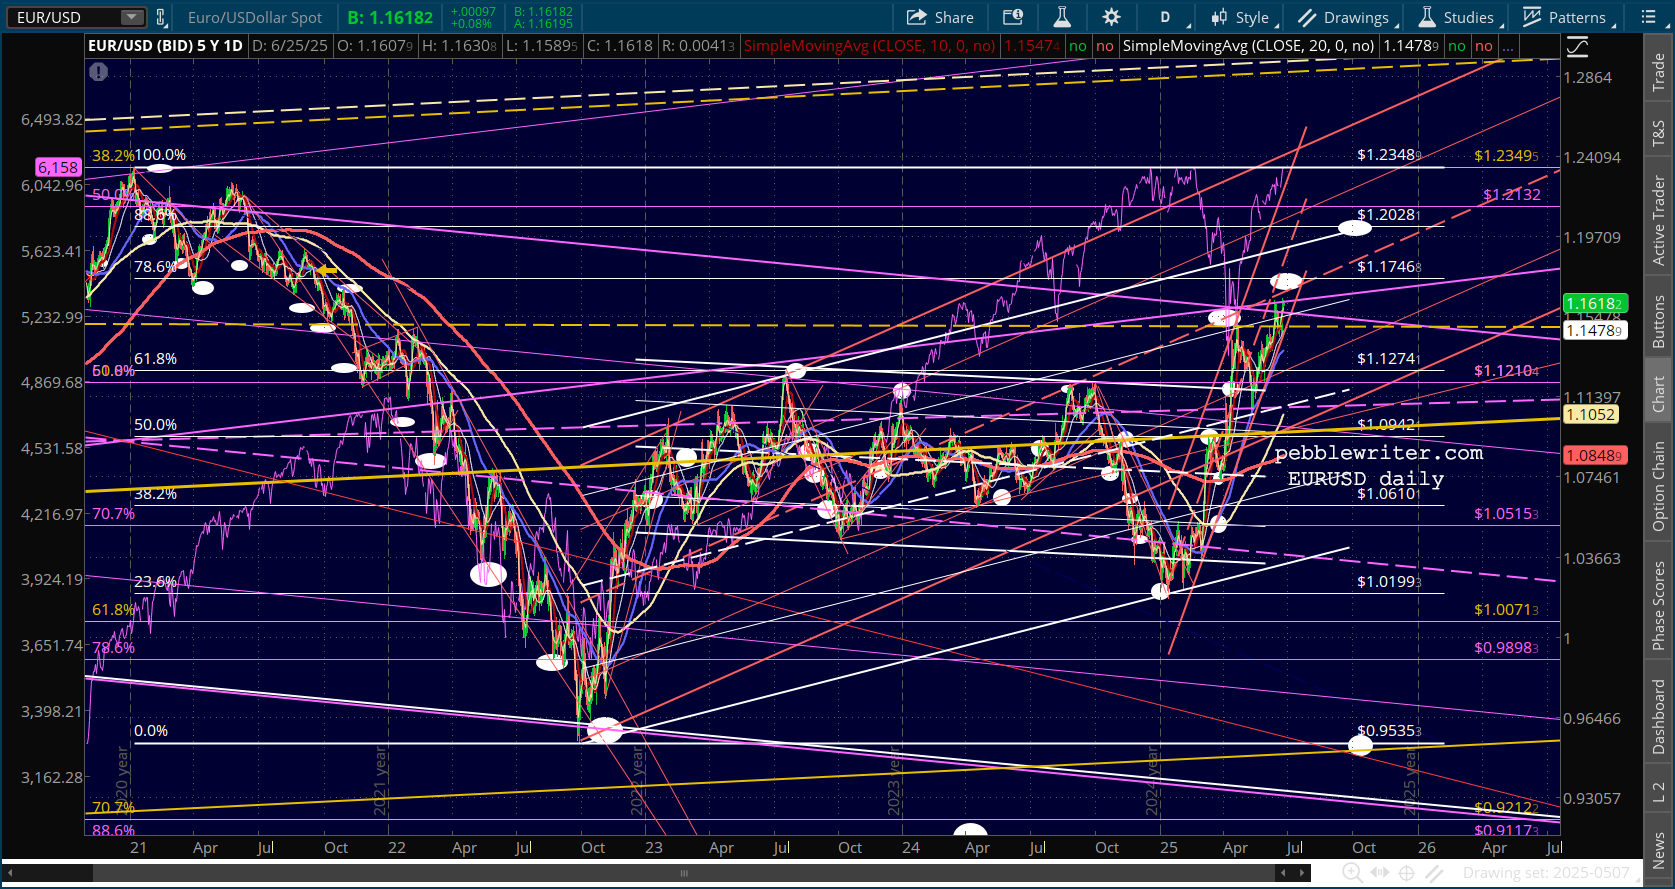 If the DXY breaks down, then the EURUSD has good long term potential to the 1.272 at 1.3114, but the timing could be quite long term, as late as 2028. AS the weekly chart below shows, EURUSD has already broken out of the falling purple channel.
 The USDJPY has a very strong track record of driving equity prices higher – holding support and even breaking out when equities need support. It’s primary target is the Nikkei, but the US market usually benefits as well.
The chart below shows the instances in Sep 2024 and Apr 2025 where USDJPY bottomed around 140, with rebounds that helped NKD recover from steep losses.
 These bounces put USDJPY at odds with the huge rising purple channel which, along with the IH&S, would suggest that 167-183 is within reach as early as Dec 2025. In fact, USDJPY has a habit of rallying into the end of the year, especially during years where YTD performance was weak. The key would be getting USDJPY back above the purple channel midline and former high at 148.11. If it doesn’t, then we would revisit 139.57 and, should that fail, 130-133 – which would obviously be a negative for NKD and US stocks.

continuing…