

ES continues melting up toward its previous all-time highs. Granted, it’s happening mostly on the back of VIX in after-hours, but it’s happening all the same.
 continued for members…
The falling white channel has just about run out of real estate, and the rising channels are set to resume their control over the momentum. It doesn’t mean that all the economy’s problems are solved – far from it. We’re still facing higher inflation, growing debt and a larger deficit, layoffs, slowing economic growth, etc. But, for now, the algos are unconcerned.


 They’re watching VX and VIX break below lengthy trend lines, which means higher equity prices led by the usual suspects.
 Note that the DXY has nearly reached our 96.70 target and that EURUSD has reached our 1.17 target, meaning that DXY 96.70 weakness will have to come as the result of EURUSD poking slightly higher or USDJPY pulling back.


 CL and RB have likely fallen as much as they’re going to at this time.

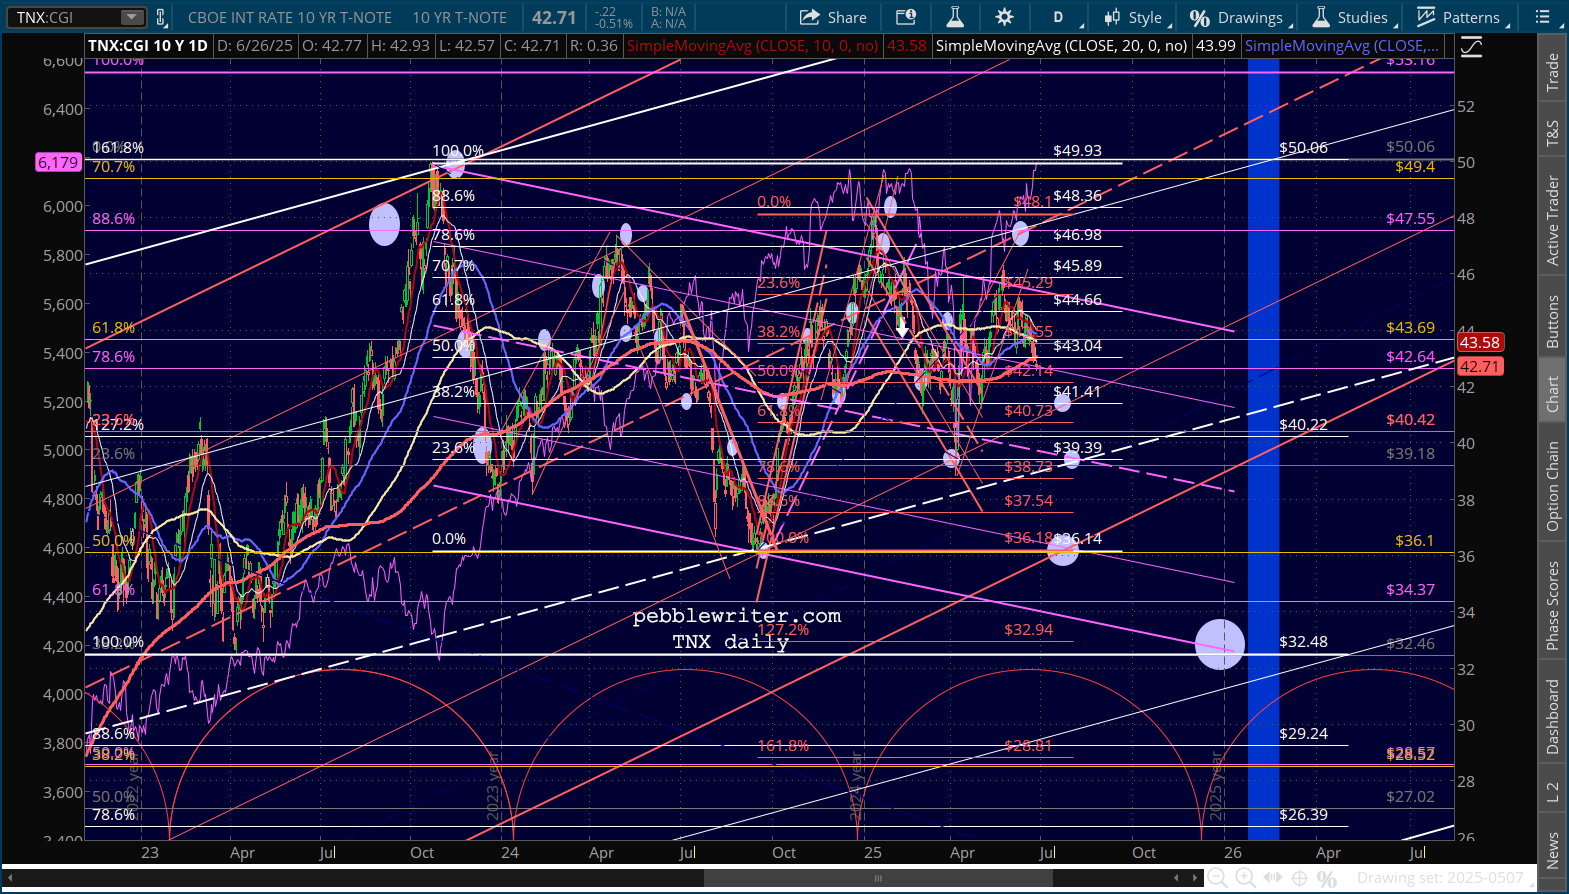
 The drop has enabled the 10Y to drop back below its SMA200, something it’s done only sporadically since Oct 2024. Our charts indicate it’ll drop to at least 3.94% this time, with good odds of a drop to 3.61% or even 3.25%.

 The 10Y is part of the input to the 2s10s, of course. And, the 2s10s is on the rise, heading back toward a potential breakout. The 2Y is, again, heading south faster than the 10Y.

 A move above 67 bps would constitute a breakout, meaning stocks should break down. There is a precedent for this, back in 2015. SPX had reached important Fib resistance, fell a little over 4%, then rebounded to over the .886.
 It led to a much larger pattern where SPX fell 12.5% from its May 2015 top, climbed above the white .886 Fib, then fell apart to a lower low.
continuing…