

Futures are flat going into this morning’s open – a marked departure from the usual holiday weekend ramp jobs we’ve seen over the years. Even so, the care with which the futures have been managed is just as laughable.
 We’ll pick up this morning where we left off Friday on the topic of how the Fed changed the rules regarding interest rates, inflation and market risk.
continued for members…Before we do, note that VIX is back above its SMA10 and is pushing up against the SMA10 and SMA50…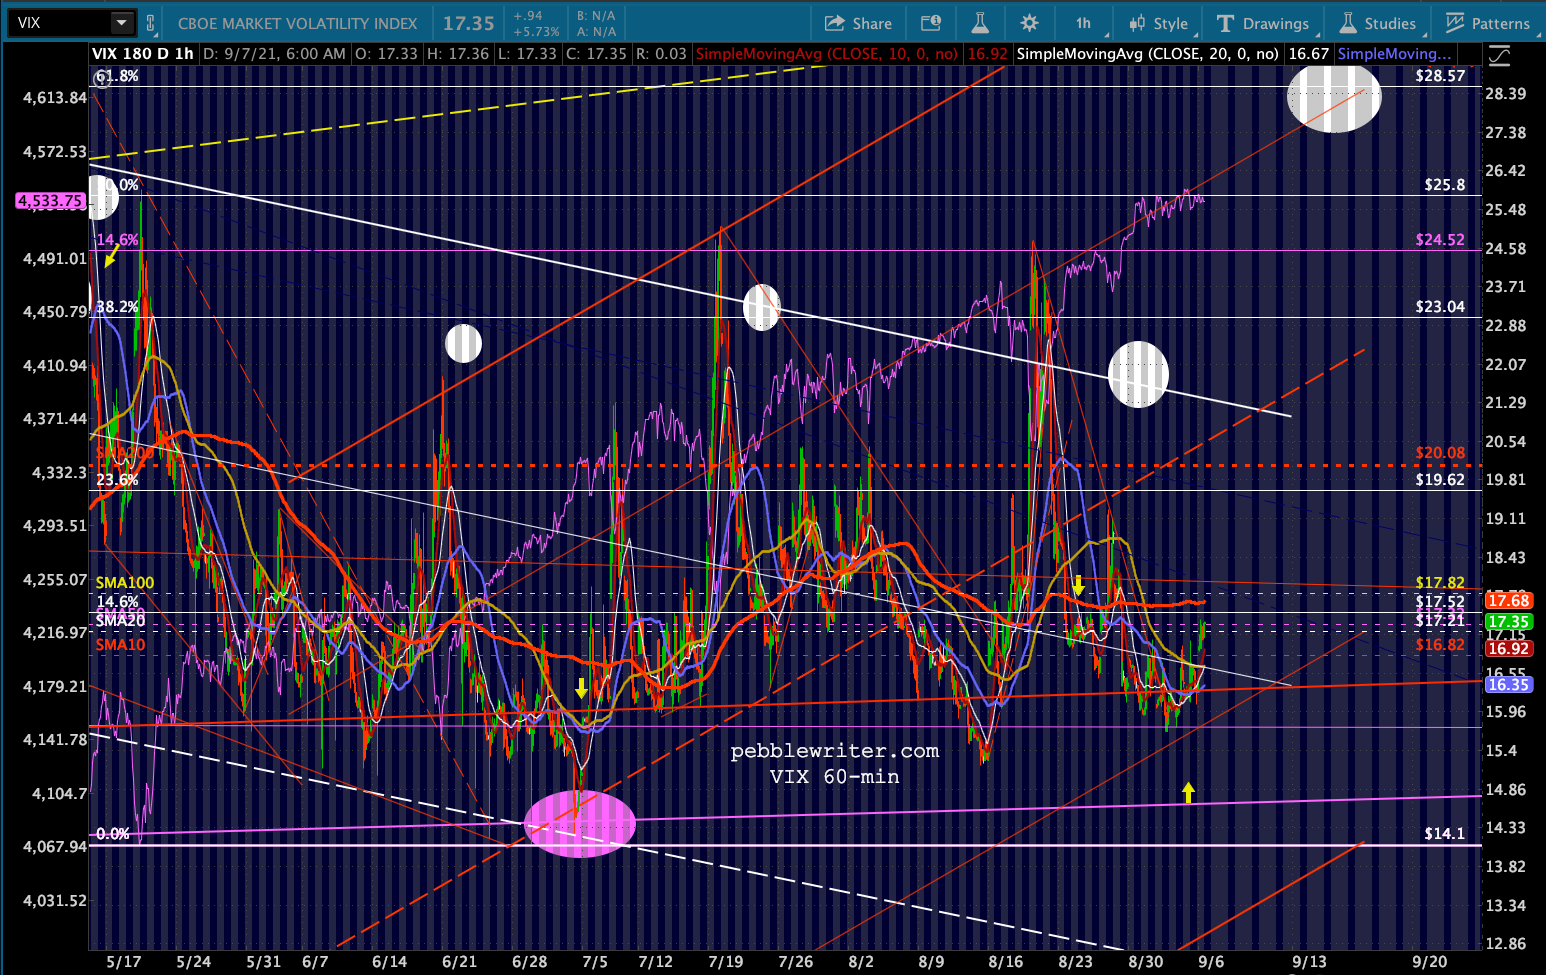 …while CL is off close to 2%.
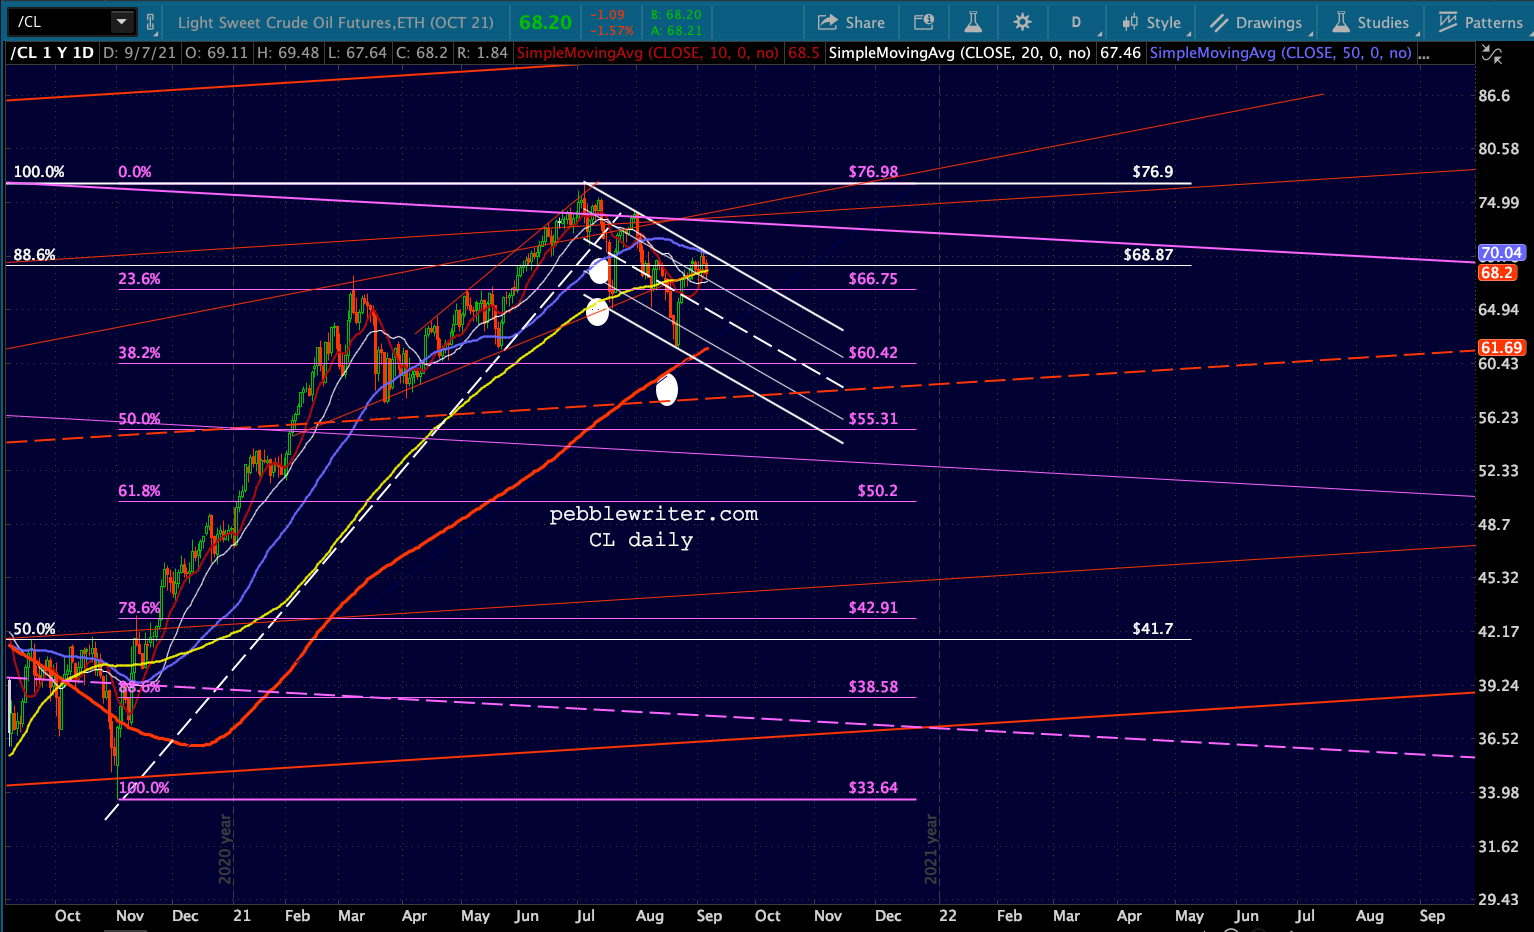 USDJPY is trying to compensate, but has a date with its SMA200…
  Between that and EURUSD’s reversal short of its SMA200…
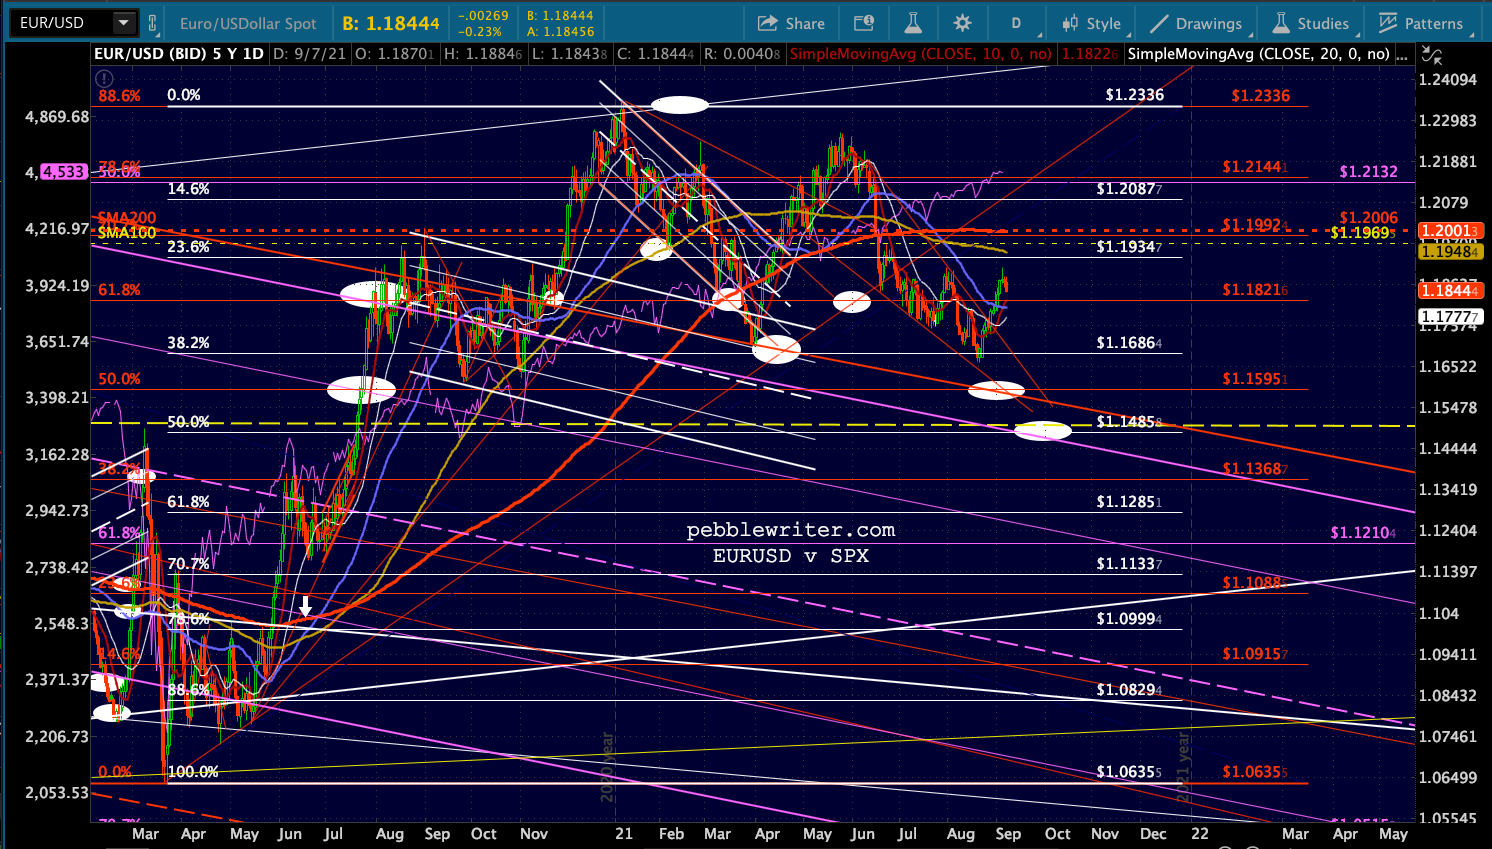 …the DXY is recovering nicely from last week’s softness.
  Now, back to the big picture…
As we discussed, interest rates have traditionally kept the Fed honest. That is, they rose and fell according to the rise and fall of inflation. If TPTB attempted to rev up the economy by lowering short-term rates too far or printing too much money, it would result in higher inflation which, in turn, would cause interest rates to spike higher which would put the brakes on economic expansion.
In the bond market, this would mean a significant drop in bond prices. But that’s not happening now, as the Fed has become a primary buyer of government, corporate and mortgage debt. By buying up most/all of the Treasury’s monthly issuance, they’ve put a floor under prices and therefore a lid on yields.
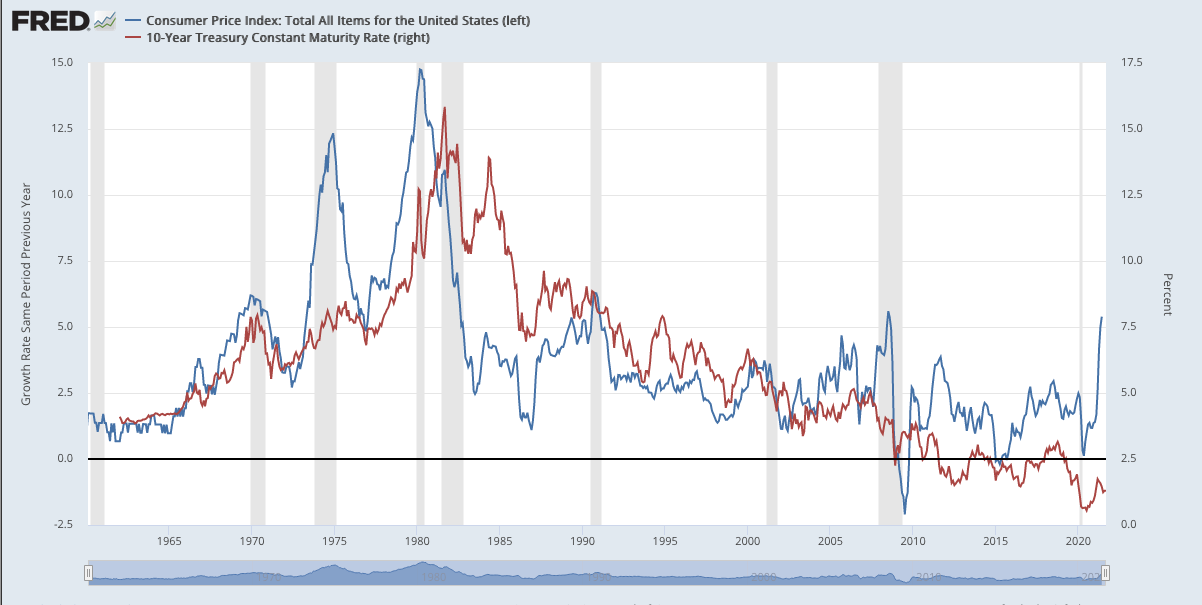
The sharp rise in rates we saw between the March 2020 40 bps lows and the March 2021 1.76% highs has been brought back under control even though inflation has soared since then.
 Looking at it another way, higher inflation was allowed to bolster stock and commodity prices – the fabulous reopening trade! – without the penalty of higher interest rates. Frequently, a bounce off a channel’s .236 line would either reverse at the midline or the .786 line. This one spiked through the midline and was headed straight for 2% before the Fed stepped in and forced it back down to its current 1.2-1.3% range.
 This is totally out of character with 5% inflation.
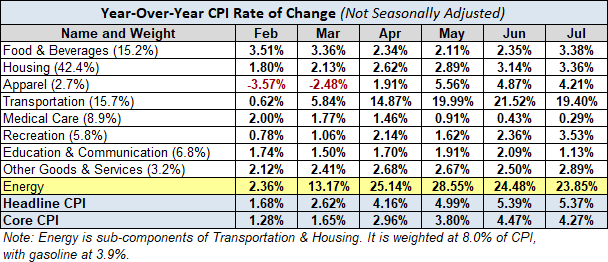
 The Fed has characterized the divergence as related to a transitory bump in inflation. To the extent that the YoY increase in oil/gas prices will gradually fade, this is true. But, the problem now facing the Fed is that other inflation categories that are largely unrelated to oil/gas have also spiked well above 2% annually.
 Prices can rise and fall, but one important underlying cause of higher, persistent inflation is wage growth. Although real wage growth rises and falls…
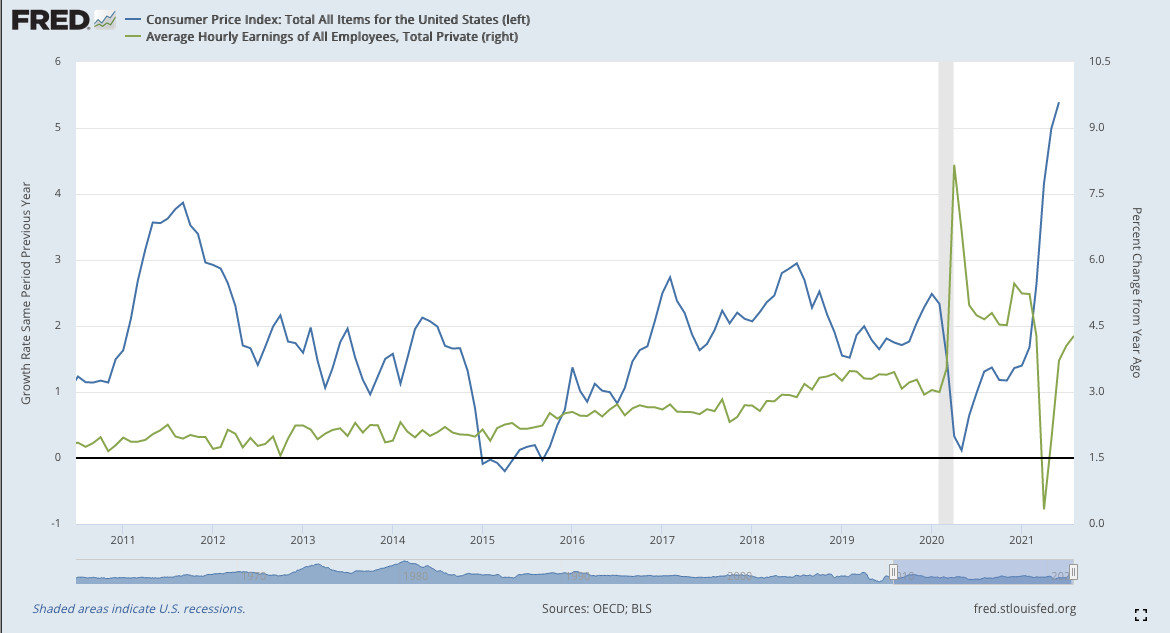
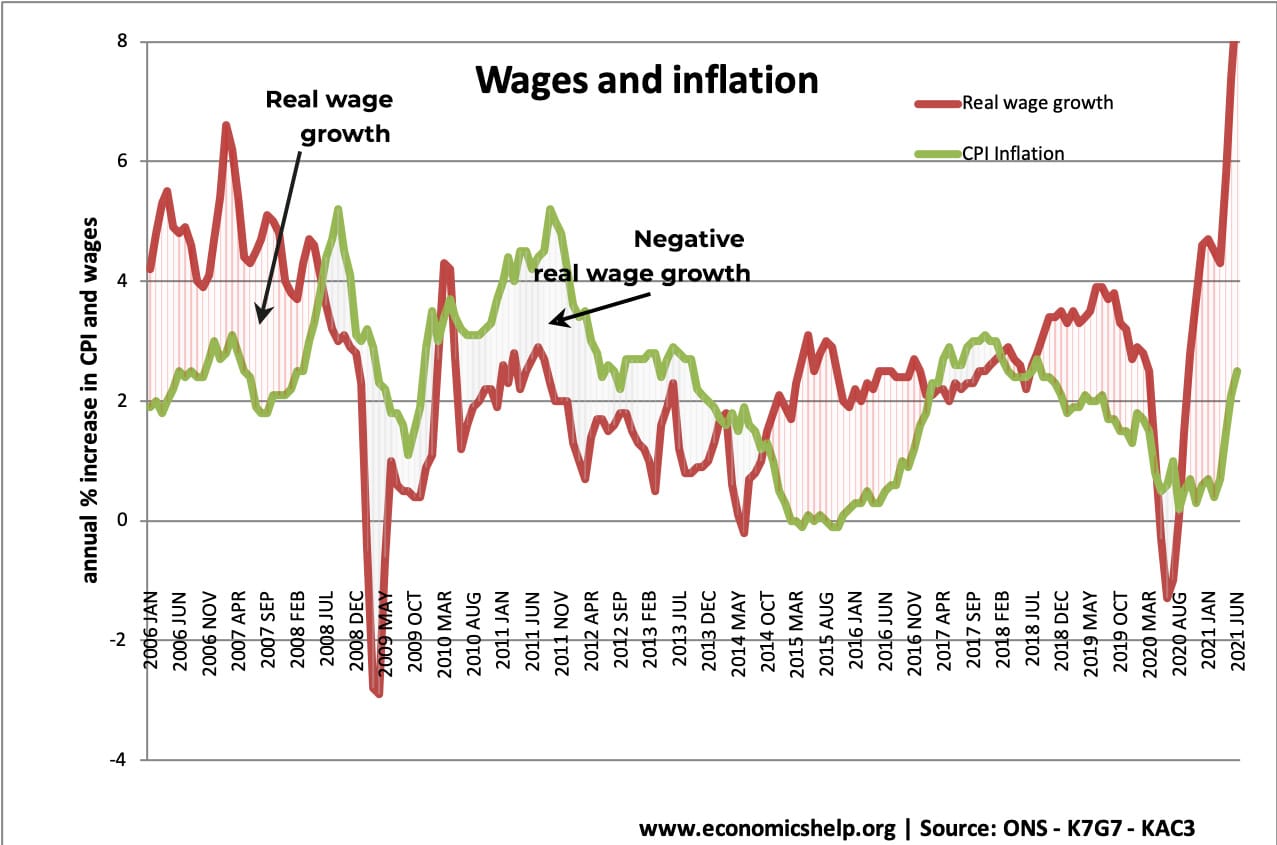 …nominal wage growth is normally pretty steady. Ignoring the sharp rise and fall associated with the pandemic, it is now approaching 4.5%. This should infuse most goods and services with excessive inflation over the coming year, putting additional upward pressure on yields unless the Fed finds a way to suppress them.
 Can they? Sure. They’ve proven that they can. But, in so doing, they sew the seeds of additional inflation – which defeats the purpose. One way or another, the whole scheme eventually collapses in on itself.
What about equities? If the relationship between inflation and interest rates has been damaged, the relationship between interest rates and equity prices has been destroyed. The only reliable “tell” is that rate plunges and equity corrections go hand in hand – as strong equity corrections drive money out of equities and into bonds. As a result, I’m always on the lookout for tumbling rates.
Steady or rising rates have generally been supportive unless rates reach a point where they might break a long-term trend such as in Oct 2018. But, that was due primarily to oil prices topping out and reversing in order to mitigate inflation and, thereby, interest rates. The algos were not amused, and stocks dropped some 20% in the process.
 The other “tell” is currencies. We expect USDJPY to come back and backtest its SMA200 as it emerges from the falling purple channel. This dollar weakness versus the yen is exactly opposite a healthy environment for algos.
 A falling EURUSD has been likewise not that healthy for stocks. In April, it backtested the top of the falling red channel from which it broke out in late 2020. But, then it made a lower low – suggesting that the downturn might not be over just yet.
  Breakdowns in EURUSD mean a rise in DXY, which has typically not been at all supportive of stocks. The bulls are hoping that the white flag pattern breaks down, while the bears would like nothing more than to see a breakout and backtest of the purple channel.
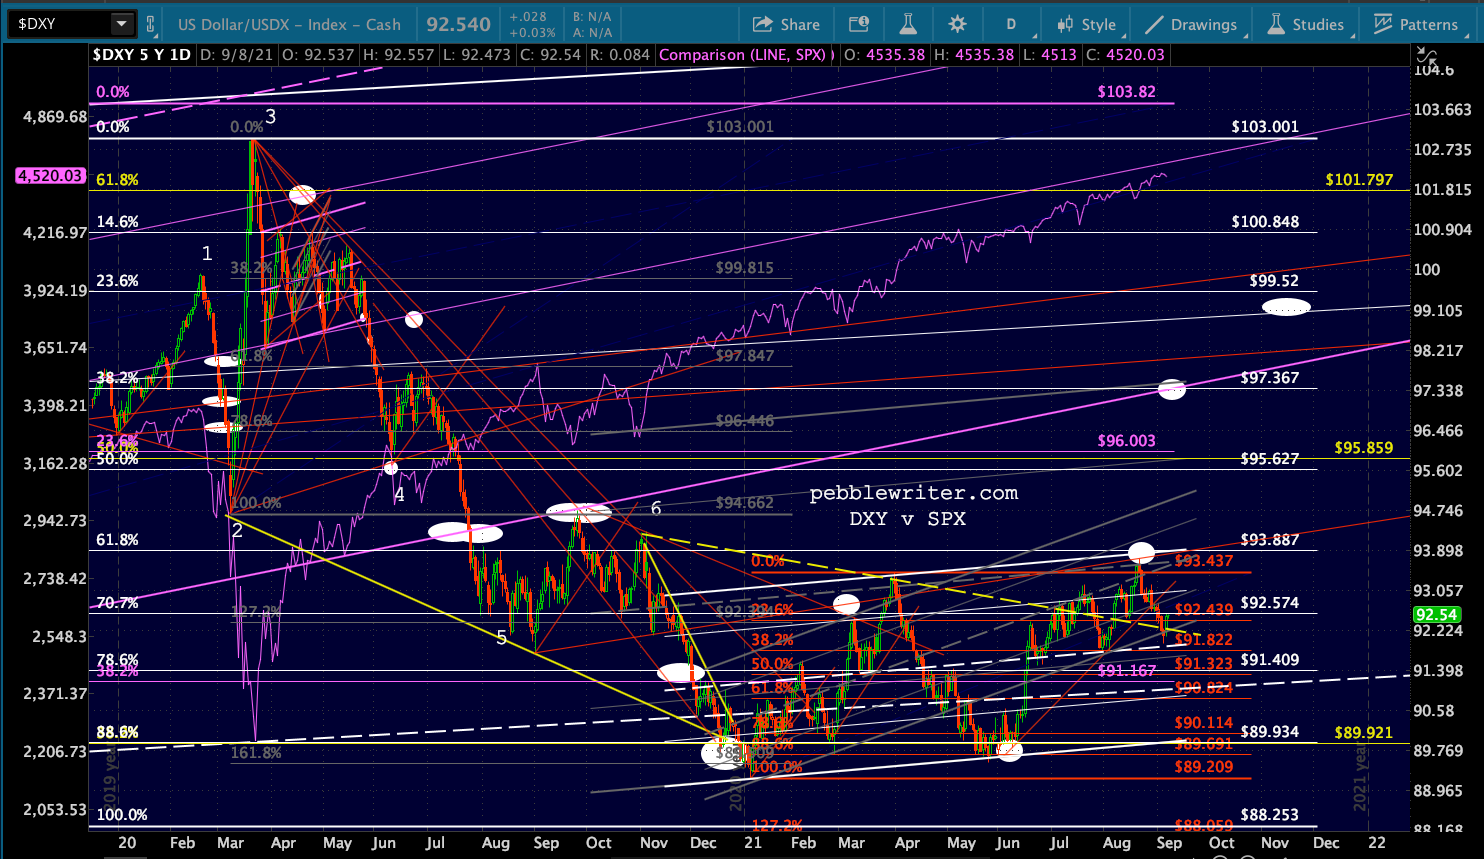 Wrap it all up, and we have an environment which is not terribly supportive of stocks at the present time, but is only a 10-12% correction away from short-term reasonable support. It remains to be seen how the Fed can/will course correct in a manner which doesn’t ruin the economy longer term.
Stay tuned…