

Futures are flat ahead of tomorrow’s CPI print.
 Yesterday’s price action put ES in the most ambiguous position possible: poised for a reversal or a breakout.
continued for members… (more…)
Futures are flat ahead of tomorrow’s CPI print.
Yesterday’s price action put ES in the most ambiguous position possible: poised for a reversal or a breakout.
continued for members… (more…)
Futures are slightly lower on the last day of a pretty impressive Q3 at +8.7%. Can the rally keep going in October?
continued for members… (more…)
Futures are up slightly ahead of another data-heavy week: S&P Services and Manufacturing PMIs today, Philly Fed Non-Manufacturing, Richmond Fed, and the Conference Board confidence data tomorrow, and Initial Jobless Claims, Q2 GDP, and Core PCE later this week.
 continued for members… (more…)
In our last dedicated Update on Gold and Silver in April, we noted that gold had reached our Fibonacci target of 2466.50 but could have further to go.
GC is fairly straightforward. There’s a large IH&S pattern which completed around Mar 7 targeting 2557, a short distance above the white 1.618 at 2466.50.
GC reached 2557 this morning.
 It’s interesting that it’s reaching overhead resistance at the same time as SPX and at the same time that DXY has reached our next downside target.
continued for members… (more…)
Futures are up slightly as the FOMC begins its July meeting. But, it’s a continuation of the consolidation that began last week.
 continued for members… (more…)
A lot has happened for RUT in the past week. It was only 11 days ago that we updated its chart, suggesting RUT would reach 2282 by the end of the year.
RUT’s reversal at its .618 in April set up either a Gartley or Bat pattern, meaning a move to its .786 at 2282.27 or its .886 at 2364.78. If we extend the dashed red trend line to the right, we get an intersection with the .786 at the end of the year – a very common scenario. While the .786 in December is a logical next target, an equally compelling case can be made for the .886 in September or October.
Don’t look now, but RUT pushed past the red TL we discussed, allowing RUT to tag 2282 (well, 2278) late last week.
 continued for members… (more…)
NFP came in at 303K vs 200K estimates, a huge beat which, combined with a decline in the unemployment rate, argues against any near term rate cuts.
 ES is all over the map this morning, but has given up much of its overnight ramp and is approaching our next downside target. With CPI coming out next week and a likely military escalation in the Middle East, ES will do well to hold its 50-day moving average.
continued for members…. (more…)
In a repeat of the most effective algo move of the past 10+ years, VIX broke down following the Fed’s no-news rate decision and press conference yesterday.
 As always, this allowed equities to leapfrog an area of stubborn overhead resistance.
  continued for members… (more…)
The last time VIX cratered to below its 50-day moving average in two days, ES popped over 3%. Then, as now, SPX had committed the egregious sin of dipping below its 10-day moving average as it approached important Fibonacci resistance. The difference, now, is that SPX is on the brink of a breakout above that resistance.
 continued for members… (more…)
February headline CPI came in at 0.4% versus 0.3% expected (and January.) Core CPI registered a 0.4% rise versus .03% forecast and 0.4% prior. YoY, headline was up 3.15%, up from 3.09% in January and a slight beat of the 3.1% expected, while core rose 3.8%, down from 3.9% in January.
Shelter and gas price increases were responsible for 60% of the rise in February.
 This is in keeping with our Gas v CPI model which shows a slight uptick in MoM pricing in the midst of a YoY decline.
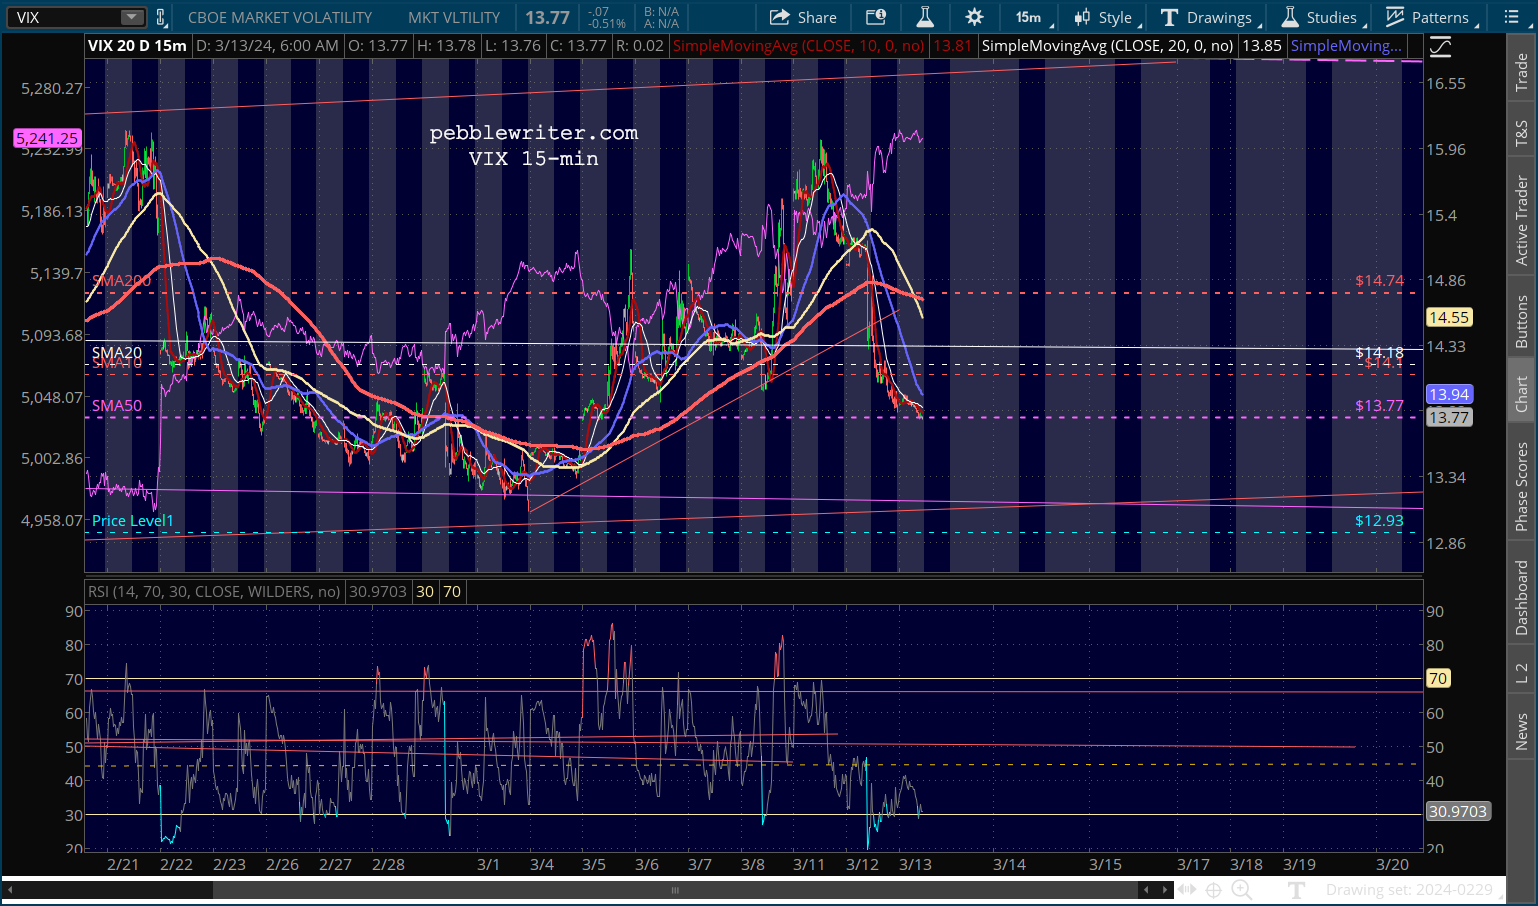
 The short-volatility algos were busy this morning, with VIX diving more than 5% in minutes to back below the 200-DMA.
 Futures, which might have been expected to tumble on the expectation of further delays to FOMC rate cuts, rallied instead.
  continued for members… (more…)
