

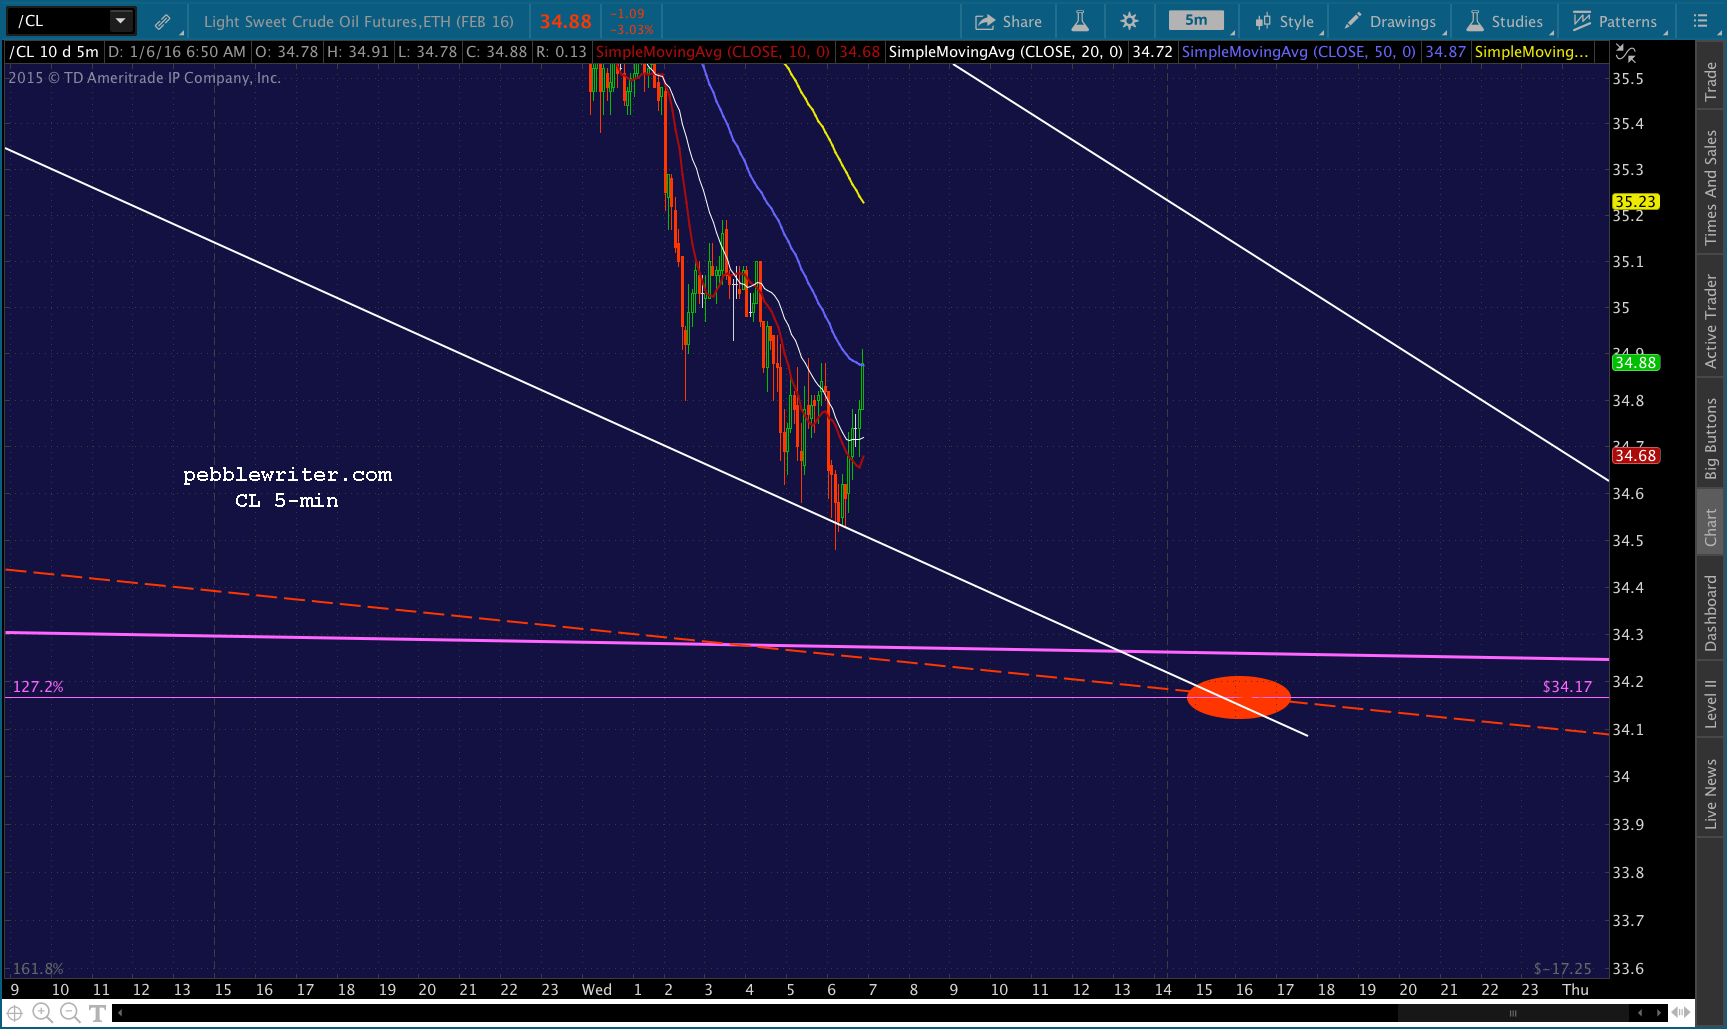
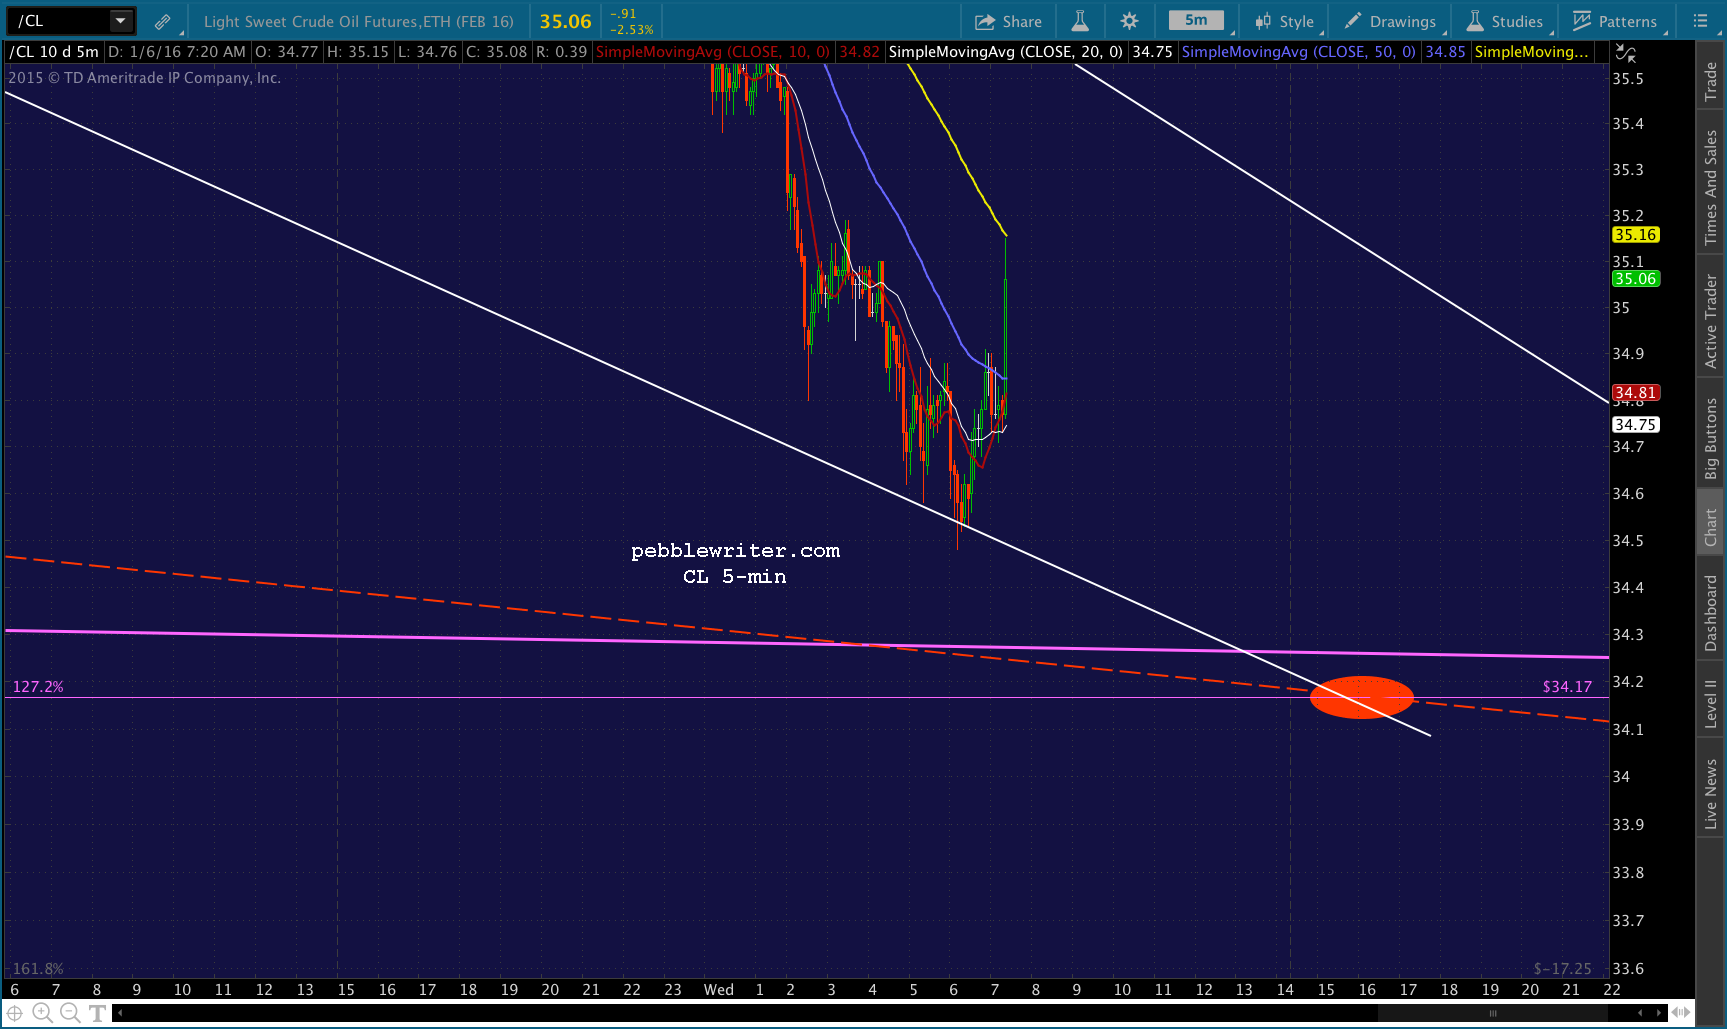
In a repeat of Monday’s pre-open, just about everything is off this morning. We’ll start with CL, which is testing Dec 14’s lows and nearing our next downside target. Along with USDJPY, it should allow SPX to reach our next downside target at the open [see: Happy New Year, 9:46 Update.] In short, while it feels like the “market” is out of control, it’s playing out exactly as expected.
continued for members…The most serious development for bulls, USDJPY is testing its Oct 15 lows.
 It can be considered a very deep retracement at this point. But, it has already broken trend. So, the only thing it has going for it is the ability to scuttle sideways until its eventual recovery.
 Should it dip below the last lows, then our SPX 1962 target becomes front and center. The rising purple channel suggests it’s later in the month, or even early February.
 But, ES’s chart suggests it could happen as early as today (with the equivalent being ES 1937.67.)
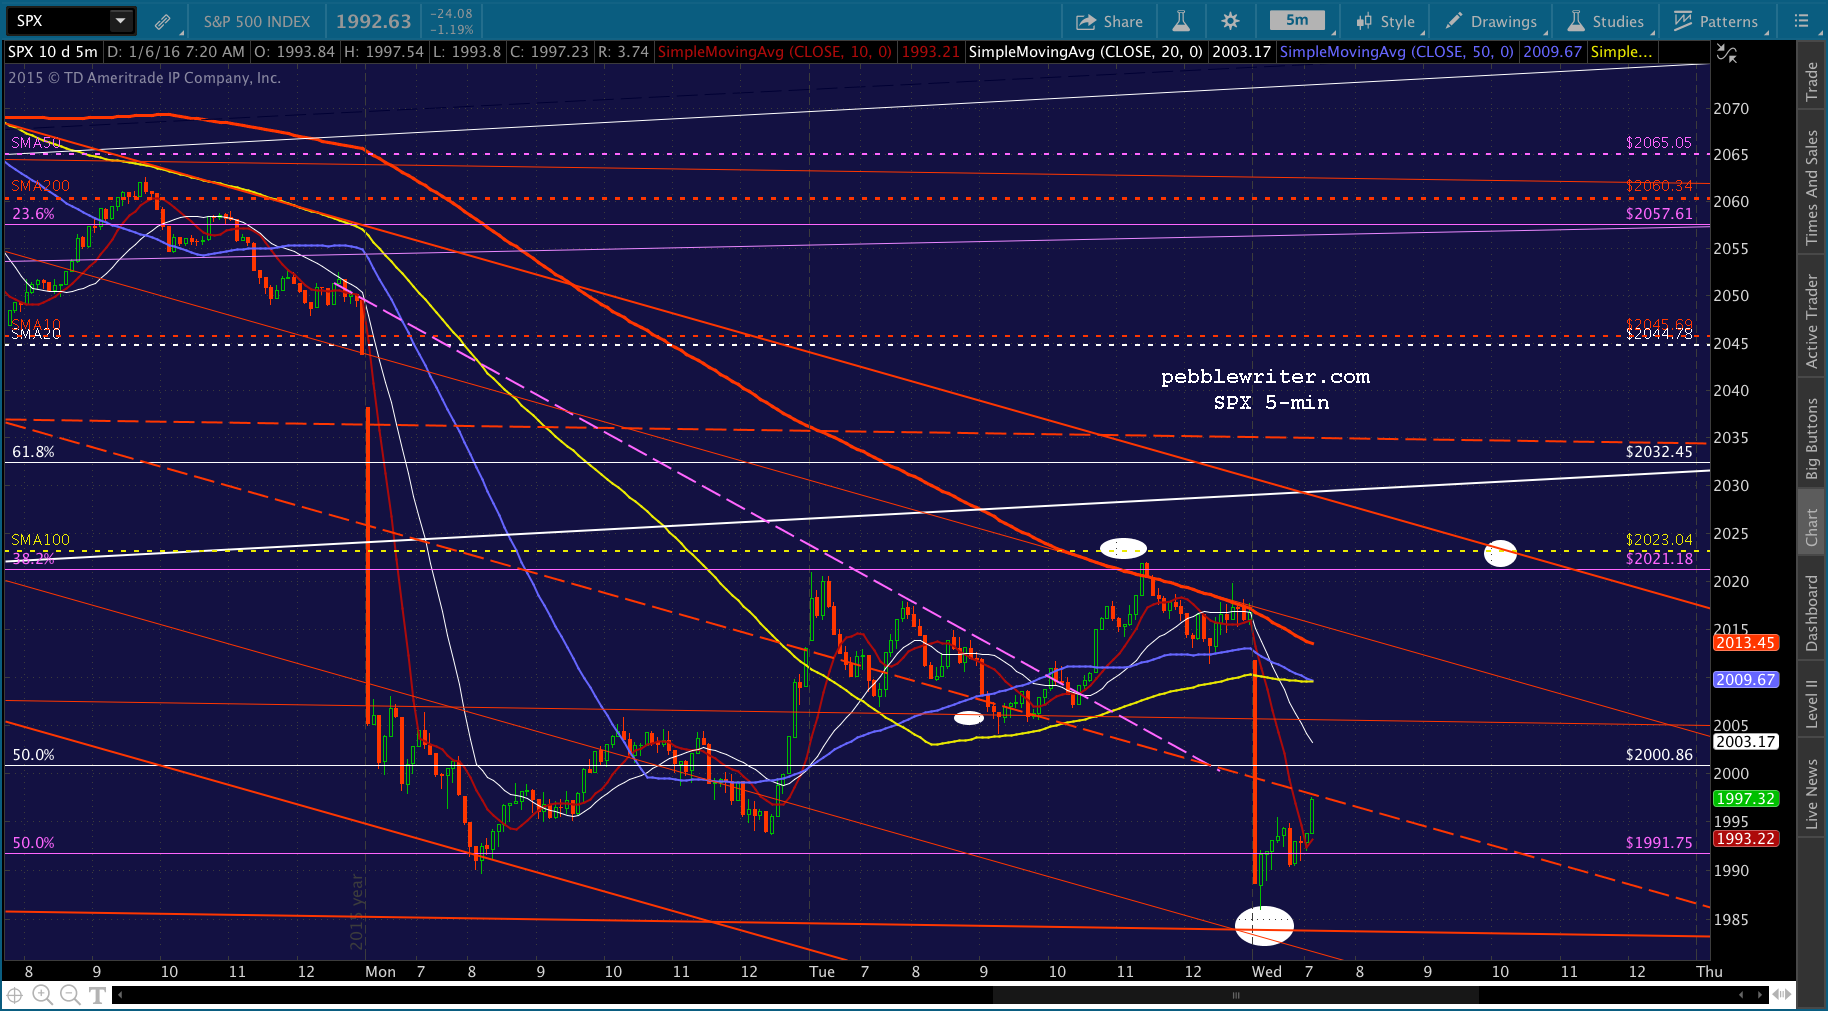
 In the meantime, we’ll focus on a likely tag of SPX’s Flag Pattern bottom at about 1983-1984 (ES already reached its.)
I would short at the opening and look for a potential bounce there. If it doesn’t bounce, then the purple .618 at 1962.11 is next on the agenda. I’m laying this out as best I can now, because outside my windows the first big winter storm of the season is barreling in off the Pacific. Thunder, lightning, high winds… the whole shebang. I wont be the least bit surprised if we lose power in the next hour or two. I have my laptop and cellular internet connection ready. But, if the cell towers go dark, there’s not much I can do.
UPDATE: 8:56 AM
Here are a few short-term charts to chew on. Note that SPX’s two previous tags of the Flag Bottom resulted in huge bounces of 100 and 83 points. So, a bounce up to (finally) tag the SMA100 at 2023.04 wouldn’t be at all unusual — assuming that it bounces.
A plunge through to 1962 would catch a lot of folks on the wrong side, which earn it at least 25% odds in my estimation.
 The key, as always, is to keep an eye on ES, USDJPY and CL, which all have easy escape hatches: the TLs and MAs that can be quickly broken through to the upside in order to save SPX from any further downside once it reaches 1983ish.

 Other charts to keep an eye on are NKD, which is coming up on a key channel midline…
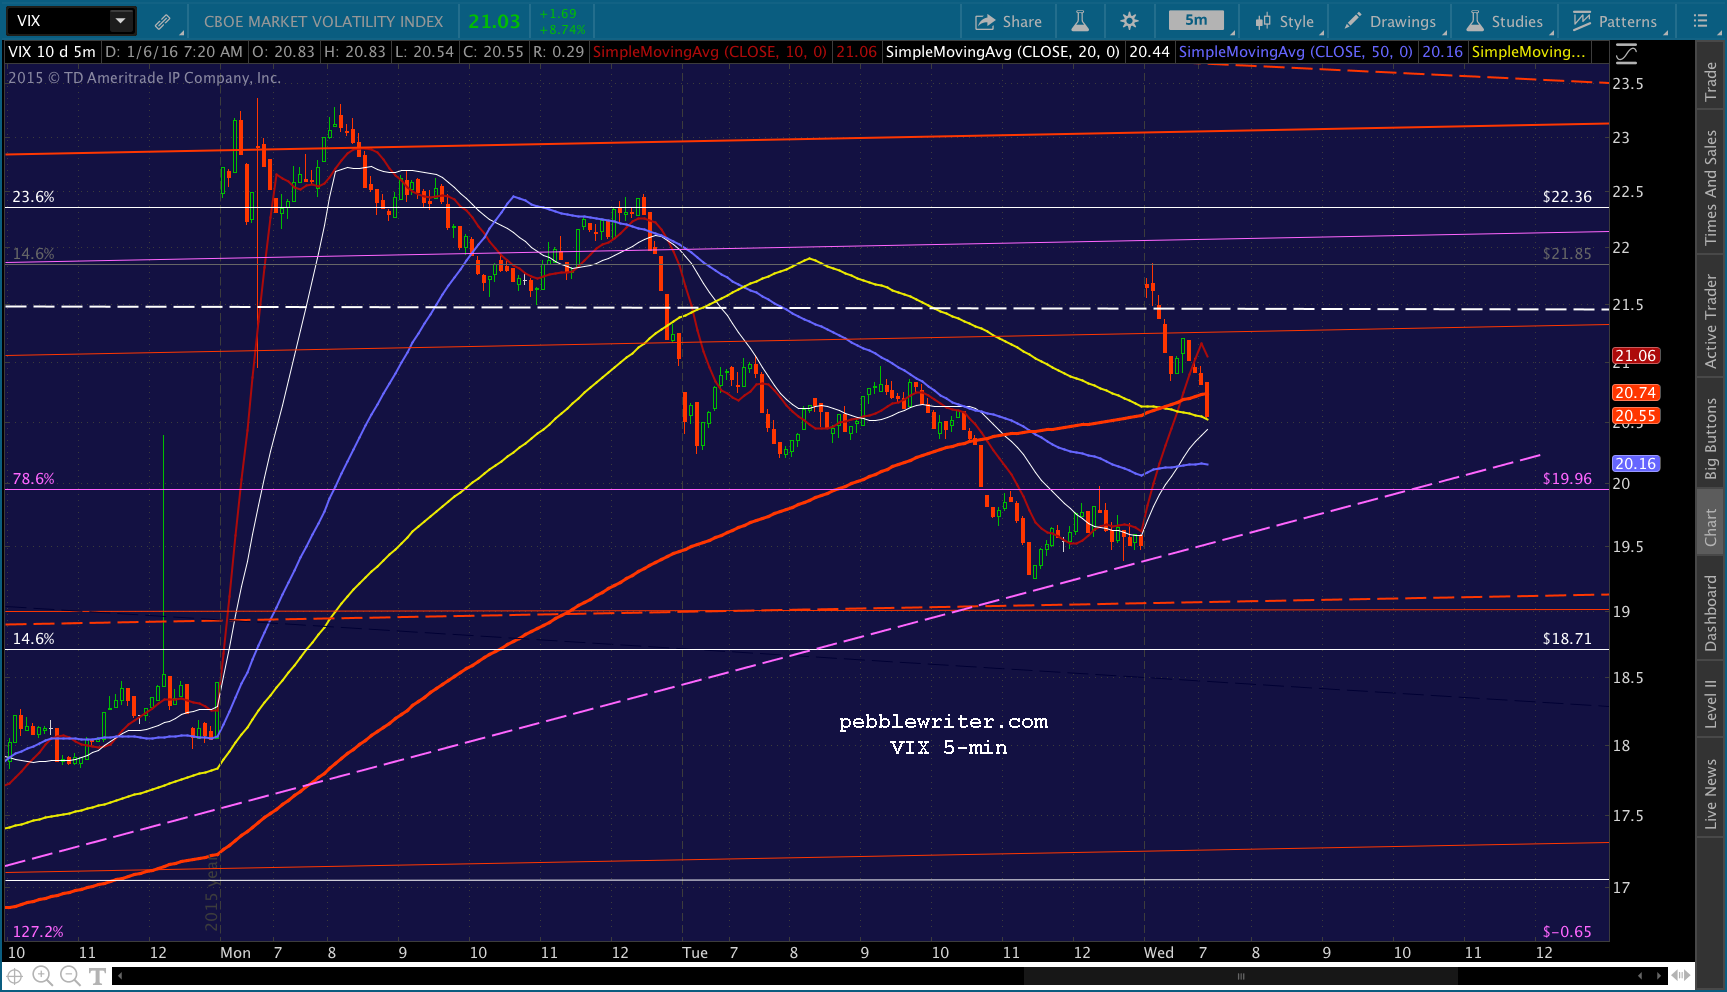
 …and VIX, which could bust through an important fan line this morning.
 UPDATE: 9:50 AM
The initial push only reached 1986.02, a little shy of the Flag Bottom. But, CL and ES, in particular, started bouncing – a lot. So, SPX has bounced along with them.
Just speculating, but it might be headed for the red channel midline (1998.7) for a backtest of the SMA5 10 before another leg down. It’s also possible that this morning’s low will just be a whiff. With ISM and factory orders coming up in 10 minutes, we should find out very soon.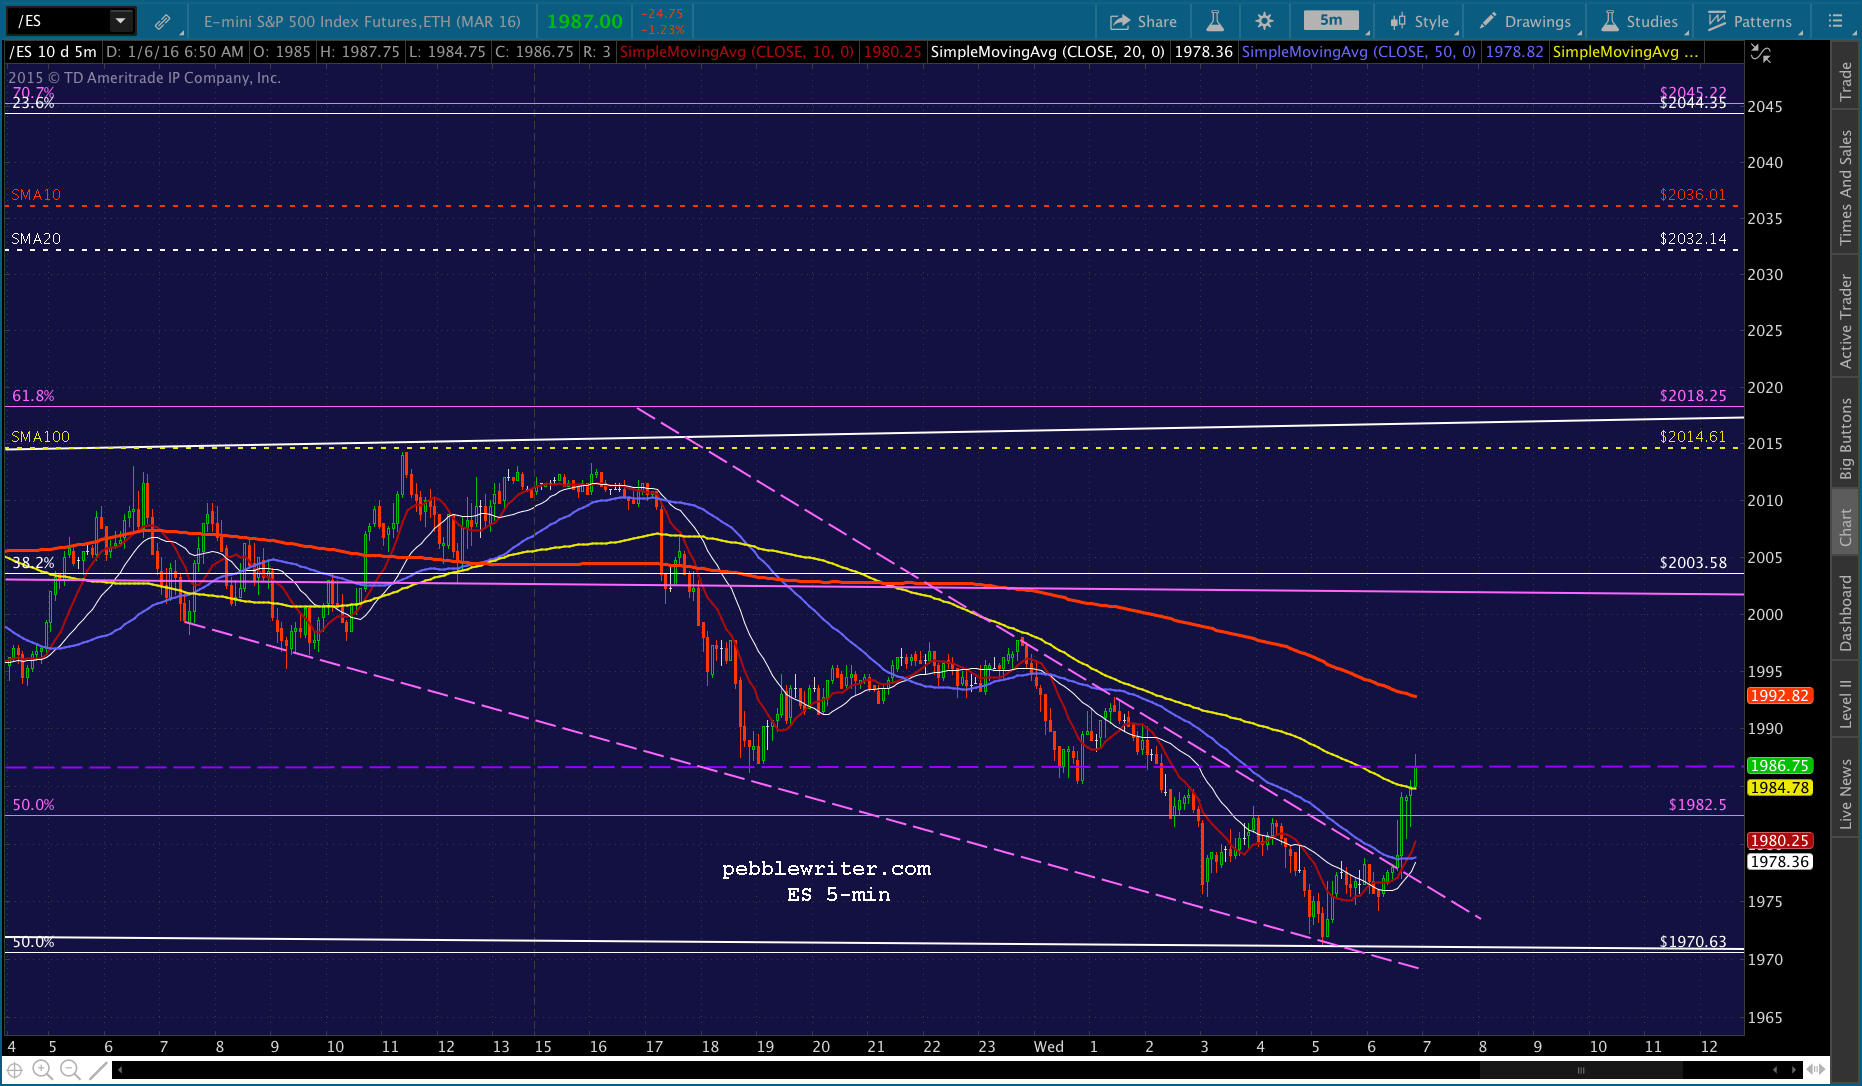
 UPDATE: 10:22 AM
Sorry for the delay… just had our first power outage. It’s back on for now.
SPX ran up to the midline discussed earlier, and other indicators have reached potential points of reversal. So, a run back down to 1983 still looks possible. A push any higher would be reason enough to go long.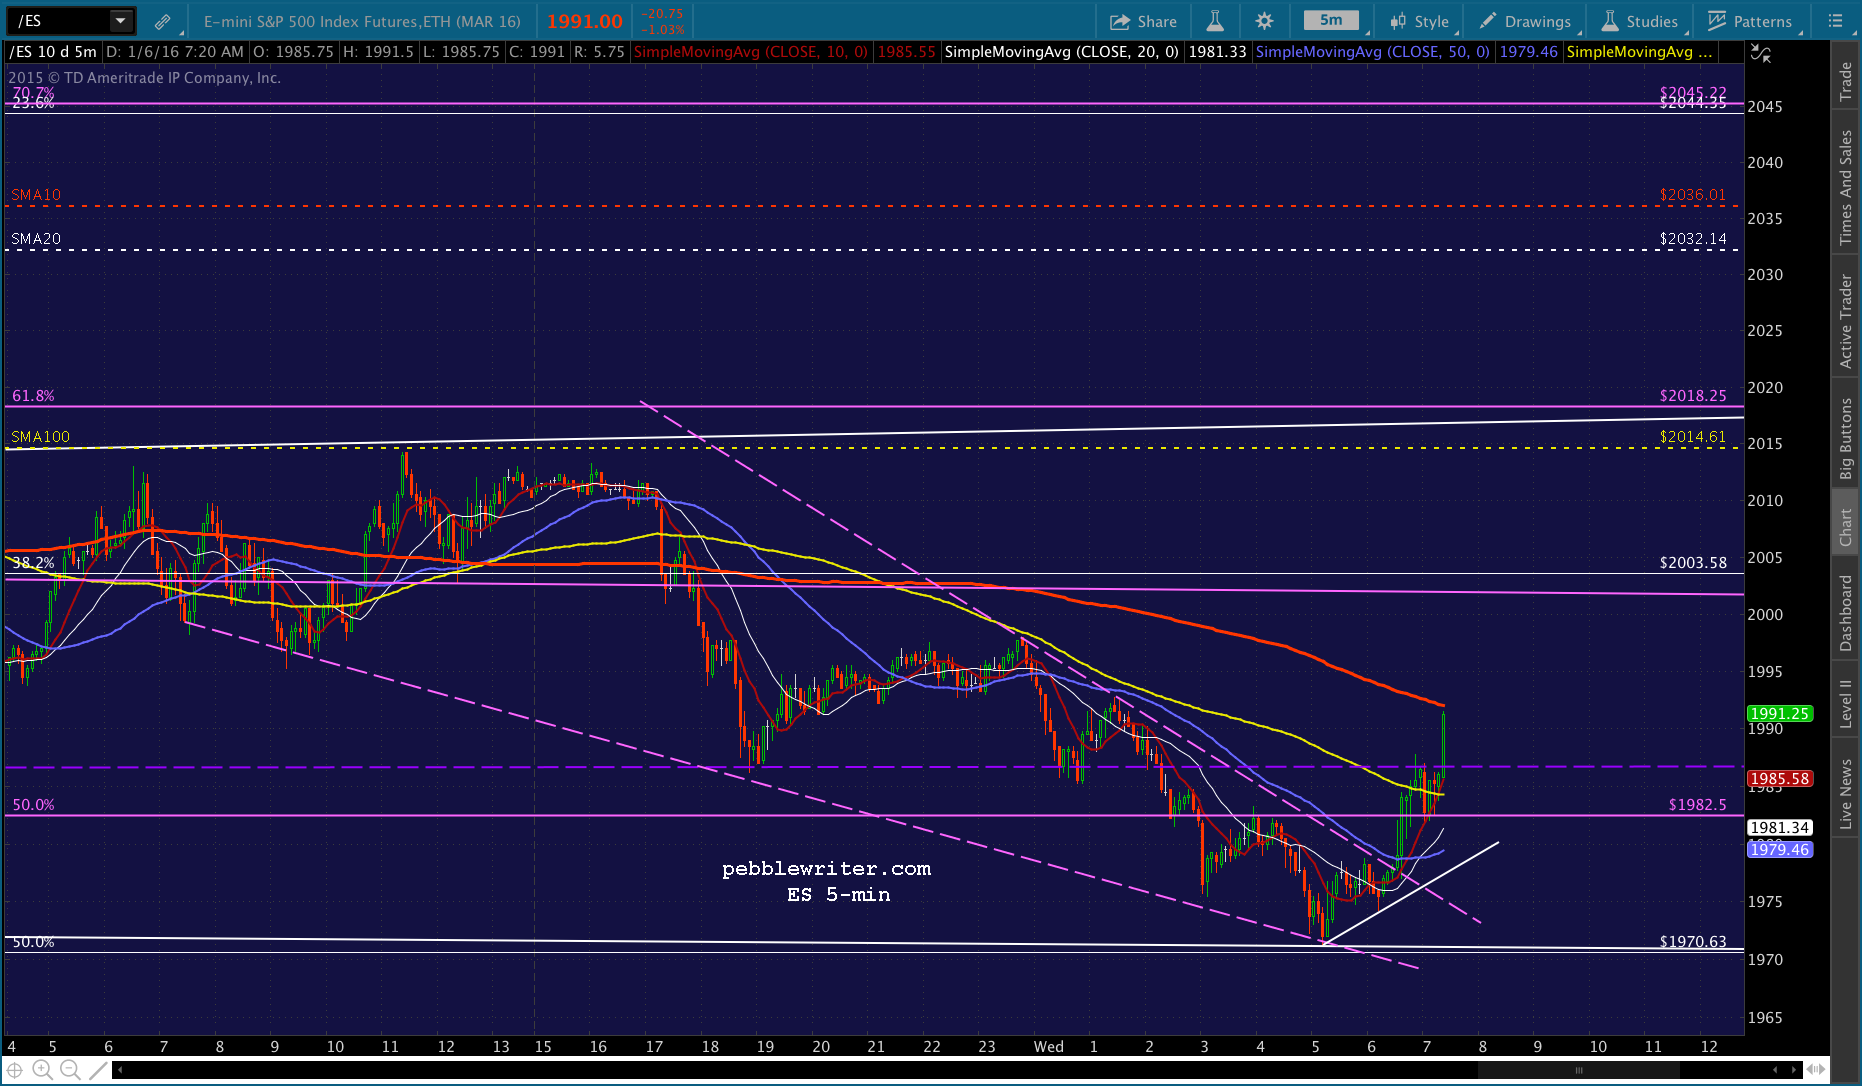

 Crude oil inventory data is due out at 10:30 ET.
UPDATE: 2:06 PM
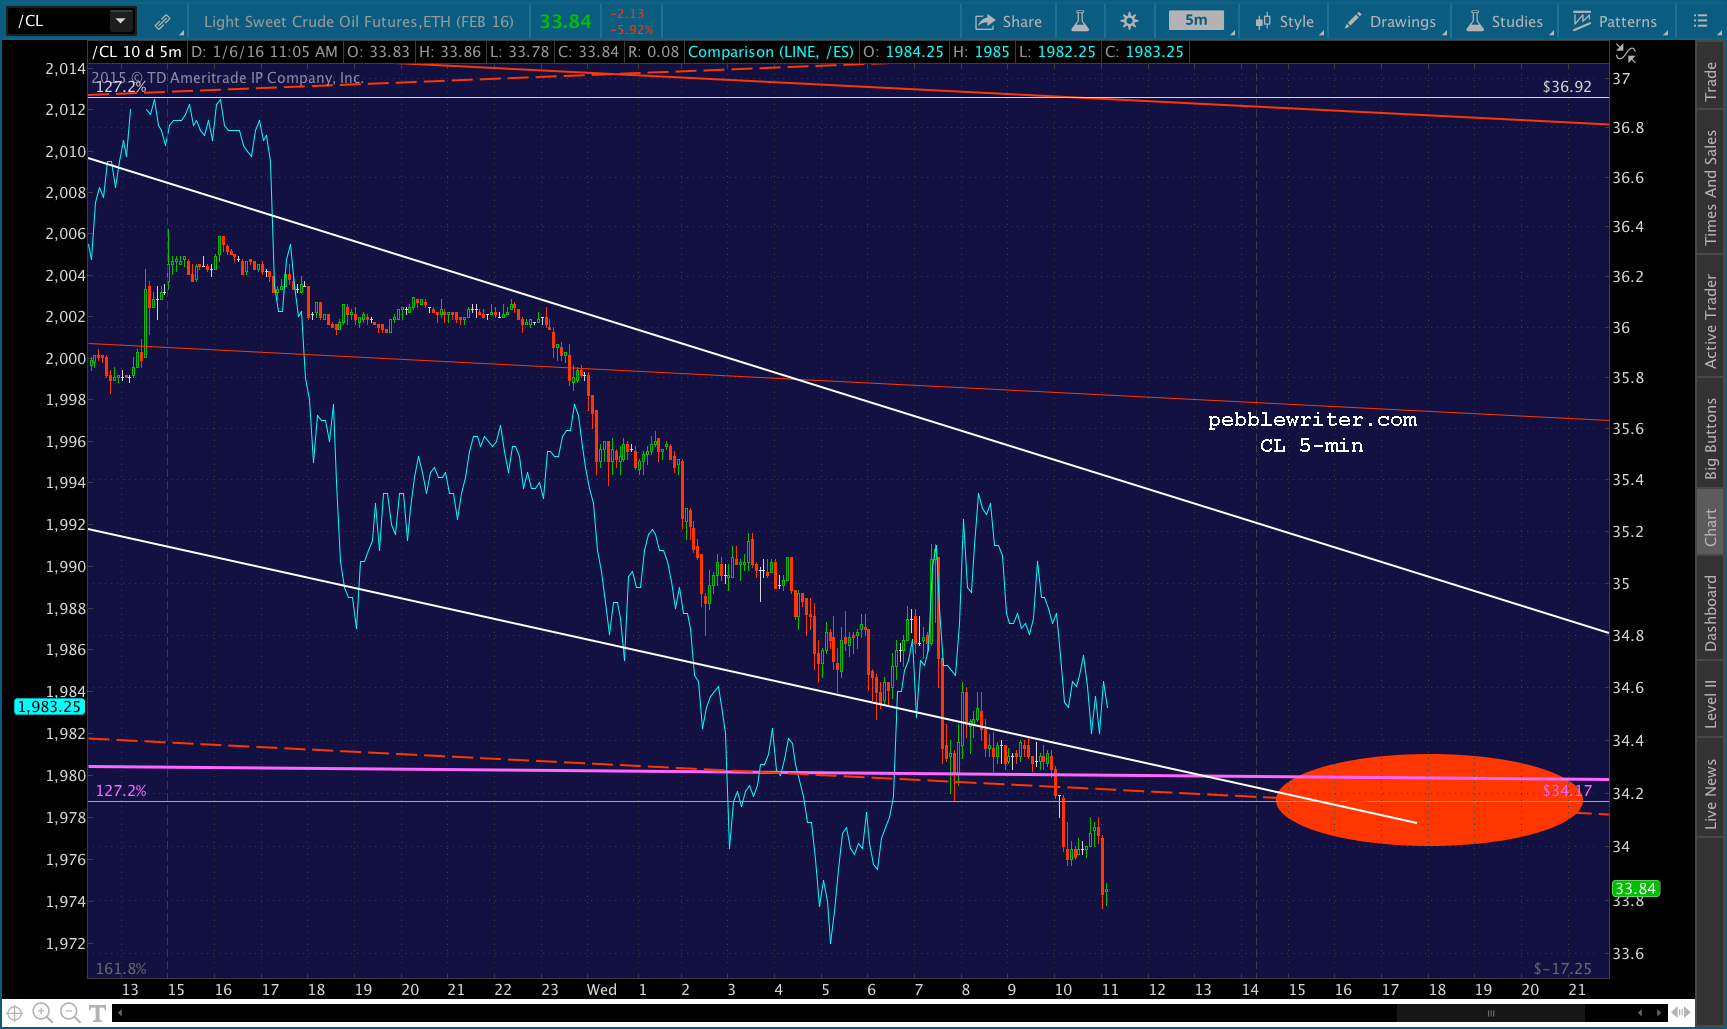
This is pretty fascinating. CL just pushed below 34.17 and USDJPY just plunged below the TL that’s been propping it up all day. But, SPX has so far refused to play along.  Part of the problem is VIX, which just spiked much lower for a nanosecond.
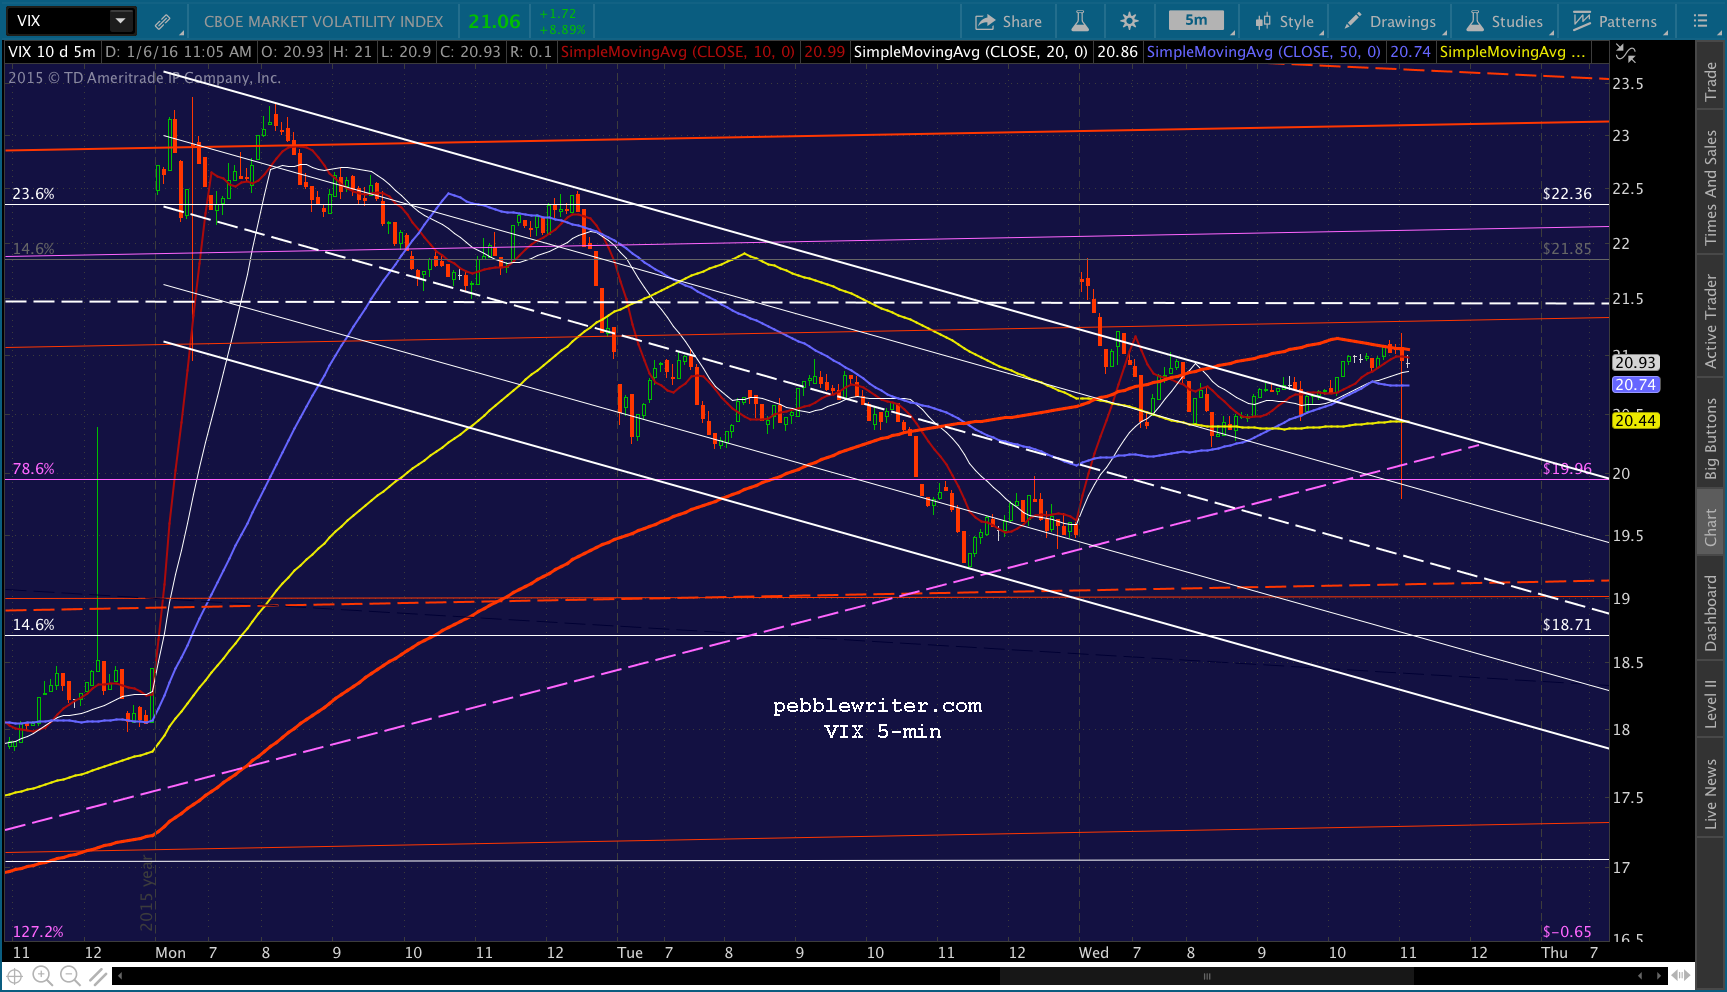
 What’s it going to take? My concern is that they’ll prop it up through the rest of the session, and bag 1983 in the morning on another gap lower. If it pops up through the blue SMA5 50 at 1995ish, it’s probably going to the SMA5 100 at 2002.66.
If that scenario doesn’t play out, then it’ll probably be a plunge at the close that looks just scary enough to trap a few bears before a gap higher in the morning.
UPDATE: 2:50 PM
Just reached target, USDJPY still falling. Holding short till it turns. UPDATE: 2:51 PM
USDJPY just bounced, so I’ll switch to long here at 1981.23. Very tight stops.
 UPDATE: 2:56 PM
Yes, I’m micromanaging this one — only because 1962 is still a possibility. Back to short here at 1981.24 — still tight stops.  Will go long when USDJPY stops going lower.
 UPDATE: 3:03 PM
Just stopped out all the ES bulls. Time to go long, as USDJPY is on its way higher. Not sure where it’s going, but I’d guess the red midline at 1988 for starters. If it makes it past there, then 2000 looks interesting. Keep the stops tight, as this could easily be a dead cat on the way to 1962.31.
 UPDATE: 3:30 PM
There’s the 1988 tag at the channel midline. It may have further to go, but I’d raise stops here just in case. UPDATE: 3:39 PM
Looks like it’s running out of steam. I’d take profits and go to cash here. Though, if it zips up through the SMA5 50 or down through the midline again, I’d be tempted to ride along. Note that SPX has backtested the purple .500 Fib.
 FWIW, VIX seems to have a little more downside meaning SPX might be headed for 1998-2000 and ES for 1986.4.
UPDATE: 4:00 PM
SPX closed just above where I showed the Flag Pattern bottom – and, then ES took off and tagged 1986.25. 
 And, yes, VIX played a role by falling to the TL.
 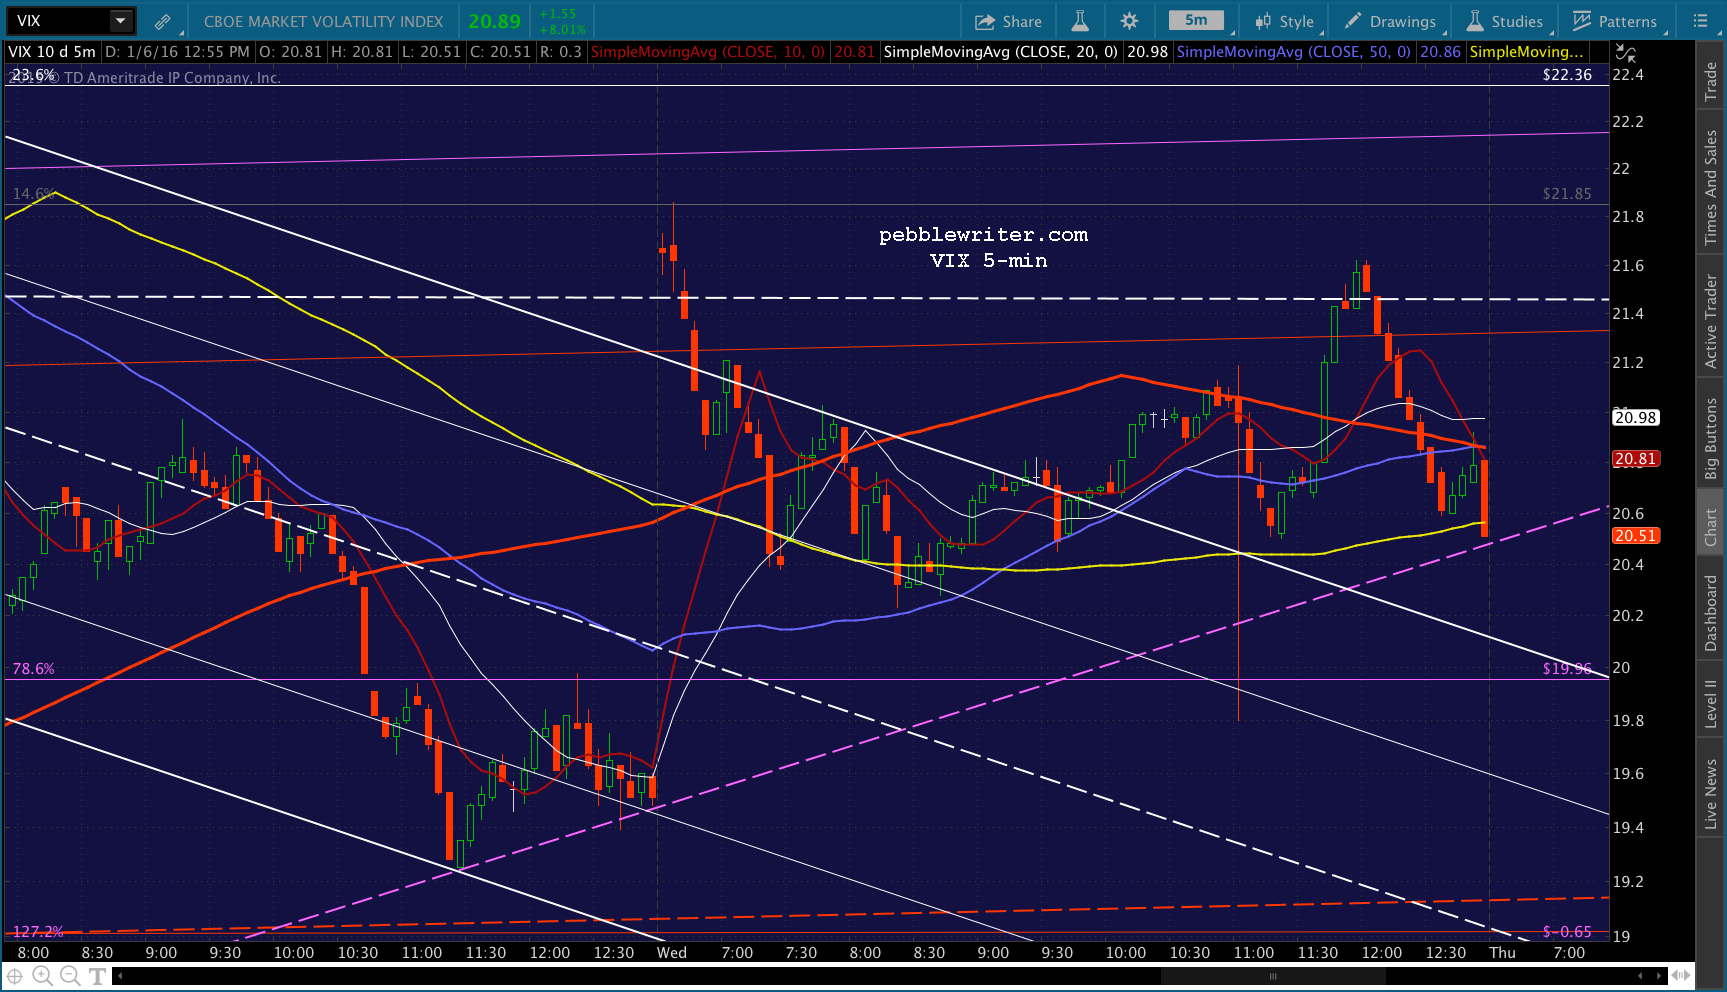 Altogether, a pretty decent day. I show us up 1.47% on a day SPX fell 1.31%.