Back in March 2020, we watched a phenomenal development unfold in the Dow Jones Industrial Average. As the Dow plunged with each of Trump’s untruthful, nonsensical and totally unscientific tweets about COVID, we wondered just how bad things could get. We put a big fat target at 18,974, which was a channel bottom, a key Fibonacci level, and just above where the Dow was trading when Trump was elected in 2016.
Sure enough, that’s exactly where the Dow dropped to before beginning a stunning reversal that saw it making new highs by November.

Many of my more conventional contemporaries poo-pooed the idea, but it was pretty obvious to any chartist. Trump et al couldn’t let the Dow drop below that price level because, at the end of the day, the Dow is Trump’s most important internal score card. And, just like the one he uses when golfing, this one involved a big kick back into the fairway whilst no one was looking.
Why bring it up again this morning? Because a couple of hours ago, in the midst of a huge military conflagration, Trump took time to put in a call to Joe Kernan at CNBC. Why? He felt it was really, really important that we know that he was having really, really productive conversations with the Iranians and that he was postponing the attack on Iran’s power plants (potentially including a nuclear reactor, which would have been a war crime if that even matters any more.)
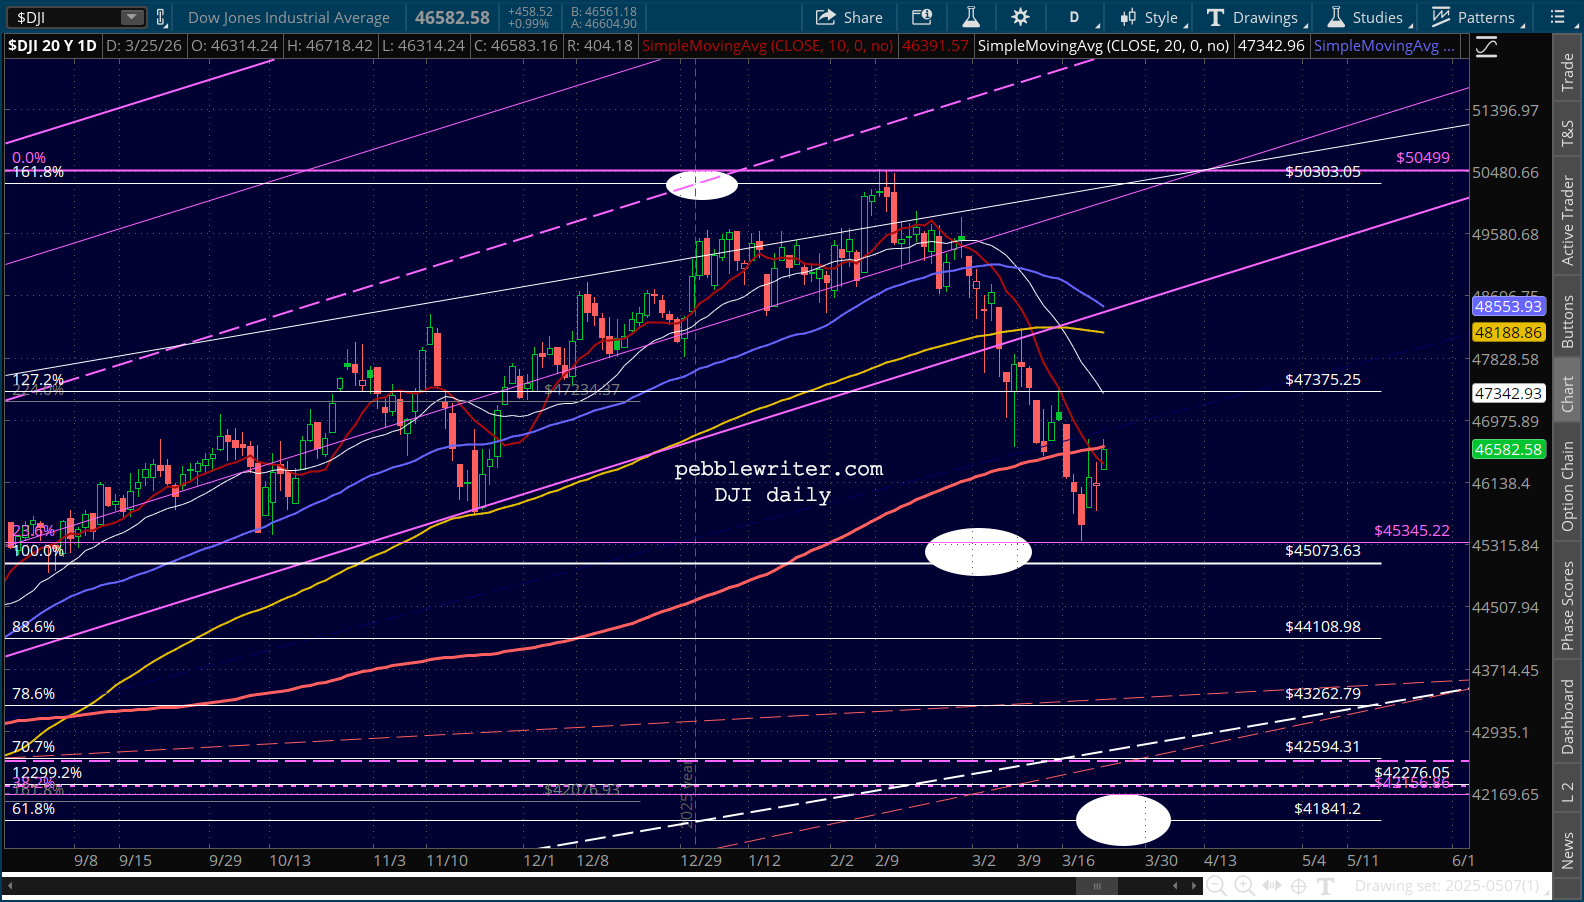
Purely by coincidence, the news was shared precisely when the DJIA futures had plunged to the December 2025 highs – the ones that were established before Trump went nuts with DOGE, tariffs, attacking Venezuela and Iran, ICE shooting Americans in the streets, talking about invading Greenland, etc.
So, instead of opening below 45,073 on the heels of a 700-point loss – which it would surely have done – the Dow futures will open at a gain. Again, purely by coincidence, it will avoid being any lower than where it was after Trump was reelected. Isn’t it weird that this all happened when the market was closed and easily manipulated? Isn’t it also weird that Trump is allowing 5 days – in other words, after Friday afternoon’s close – to confirm whether there’s any actual good news?

Some radical left commie TDS detractors might say that Trump always chickens out, that he can’t bear the embarrassment of the market dropping below where it was when he was elected. He needed an off-ramp after such a colossal cock-up and he’s just trying to stay alive until after the mid-terms which could see him impeached.
I say that’s silly. Random walks, great fundamentals, greatest president since, well, 2024! So what if the timing is a little suspicious?
Life’s just funny that way.