There are two factions on Wall Street vying for our money: those who get paid according the number of trades we place, and those who get paid based on how much of our money they manage. They both play an important role, though I prefer the latter from an ideological standpoint. If a manager makes me more money, I have no problem with him making more money. Our interests are aligned.
Unfortunately, that’s about as far as it goes with most investors. At least once a week I get a call from someone who’s dissatisfied with their current manager. But it’s usually it’s due to poor service. Only once in a while does an investor sit down and compare his manager’s results to the S&P 500 or Russell 2000 and realize they’ve underperformed.
It’s especially unusual in a rising market like we’ve had the past two years. Most investors look at their statement when it comes in the mail and compare it to last month’s. If the value has increased, they file it away and forget about it. If it’s lower, the statement goes into a pile in the corner of their desk of “things to do something about one of these days.” When this pile gets to be a few inches thick, they go shopping for a new manager.
The reality is that over 3/4 of all managers underperform the market. But, most of their clients don’t realize it. As long as the statement shows monthly increases, they never question the results. They’ve been sold on the idea of buying and holding, committing to a long-term investment approach. If it’s good enough for Warren Buffett…
IT’S NOT GOOD ENOUGH
 If you’re worth $60 billion and travel like Warren, I’d say leave well-enough alone. The daily market swings probably won’t spoil your fun. But, if you’re like the rest of us with big-ticket items on the horizon (weddings, college educations, vacation houses, retirement, etc.), Warren’s approach might not work for you.
Anyone out there remember 2008? Did that 60% plunge in the market put a dent in your plans? Your money manager might have consoled you, encouraged you to take the “long view.” He might even have outperformed the market and been down only 50%. But, that probably wasn’t much solace to your daughter whose wedding reception had to be rebooked at the local Motel 6.
THE BETTER APPROACH
Not everyone believes in technical analysis. Even fewer believe in market timing. In business school, the CFA program, broker training…they teach you that it simply doesn’t work. As a product of all those fine institutions, I firmly agreed — until 2011.
I had lost a bundle in real estate (another market they tell you not to time.) I turned to my pitiful and neglected stock portfolio and wondered if it could possibly pay the bills, let alone replace the money that had vaporized in the real estate crash. I considered changing managers; but, seemingly everyone had lost money in the crash. The traditional approach had failed.
Purely by chance, I came across some articles on chart patterns and Harmonics and began to study. The S&P 500 had dropped from 1576 in Oct 2007 to 666 in Mar 2009. By April 2010, it had risen back (retraced) to within 9 points of 61.8% of the drop before plunging again. According to Harmonics, the next big reversal would come at the 78.6% Fibonacci level (1381.50) to complete a Gartley Pattern.
On May 2, 2011, I became convinced enough that a reversal was at hand that I wrote my first blog post on pebblewriter.blogspot.com: Charts for May 2, 2011. Despite the dazzling graphs and compelling title, about 4 people read that post. Not to be deterred, I followed up with even more dazzling graphs and a more sinister title: Collision Looming.
 That did the trick. Readership almost doubled… to seven or eight, I don’t really remember. In fact, I was looking for a rock to crawl back under when, lo and behold, May 2 proved to be the high for the month and the market tumbled by 8% over the next 6 weeks. My confidence (and my readership) took a turn for the better.
RESULTS
By early June, I had discovered an analog that indicated a huge reversal at about SPX 1345 in late July. I took a deep, calming breath and and started posting. When the market plunged 18% from 1347 on July 23, I became a true believer in market timing — as did those readers who were able to protect themselves from the decline (not to mention those who profited from big bearish bets.)
 By the time the next big top approached in March 2012, I had set up pebblewriter.com and was working full-time on forecasting big market moves. The downturn from the Butterfly Pattern that completed at 1421 [see: All the Pretty Butterflies] provided a great launch pad for the new site’s track record.
One of the more interesting comments in that Mar 29, 2012 post was the following:
If you’re an überbull, there’s a potential silver lining. The May 2nd 1370 peak — a .786 retrace of the 2007-09 drop, could be the Point B of a much larger Butterfly pattern. If it were, we’d have a 1.272 extension up around 1823 and a 1.618 at 2137.
It was accompanied by this chart which shows the major Fibonacci levels between 1576 and 666 as well as the 1.272 extension.
 In fairness, I also mused at the time that reaching 1823 by the end of 2013 would probably mean $8 gas, 12% T-bills and $3,000 gold. Although tongue in cheek, I was trying to make the point that such a market result would surely come at the expense of much higher inflation and a thoroughly debased US dollar.
In fact, there were many who felt that the amount of QE necessary to goose the market another 28% — after having already doubled — would result in runaway inflation. Didn’t happen. But, look at what did happen — even though the economic forecasts were way off target.
 The S&P 500 is only a few FOMC Minutes (pardon the pun) away from reaching 1823. Today’s high missed it by 1.15% — very close to the margin of error for the past three Harmonic reversals (the .618, .786 and .886.)
The 28% return is in the bag, even for those who bought and held from 1421 (the red arrow) on Mar 29, 2012. But, the three previous Harmonic reversals ranged from 8.9 – 21.6%, with an average decline of 15.9%. How much of that 28% will you get to keep?
BTW, those of us who shorted at 1421, went long at 1288, shorted again at 1494, went long again at 1343, etc. did much better than 28% — earning an average of 12% per month since then [see: Pebblewriter Results.] Most importantly, there were no negative months — or even weeks. We didn’t always hit it out of the park. But, we also never took a fast ball to the family jewels.
THE CATCH
It’s not automatic. Harmonic Patterns, Chart Patterns and Analogs fail just often enough that you can’t really “set it and forget it.” Nor is there an automated approach that works consistently enough for me to manage my portfolio from the helm of an Oyster 625 (though, I’d love to try some day.)
 Investing like this is a full-time job — especially if you’re trying to capture the moves within the moves. I’m usually up by 4:30 AM and make my last check on global markets around 11PM. If you enjoy sleeping, have any hobbies or want to wake up to someone other than this guy, you might want to consider using a professional manager.
But, examine the manager’s performance during the corrections, not just the rallies. See any drawdowns in there you’d have been uncomfortable with? Get an explanation. Is he using some goofy homegrown benchmark that doesn’t relate to your future liabilities? Ask why.
And, if he tells you that trying to time the market is dangerous, or not tax-efficient, or simply can’t be done — keep looking. The management fees you spend every year entitle you to more than a glossy annual report and stale Fruit Cake.
ALL TRUTHS…
I have a little quote of Galileo’s that I like on pebblewriter.com (he’s never complained…) I think it speaks well to investing in general, and buy and hold investing in particular.
“All truths are easy to understand once they are discovered; the point is to discover them.”
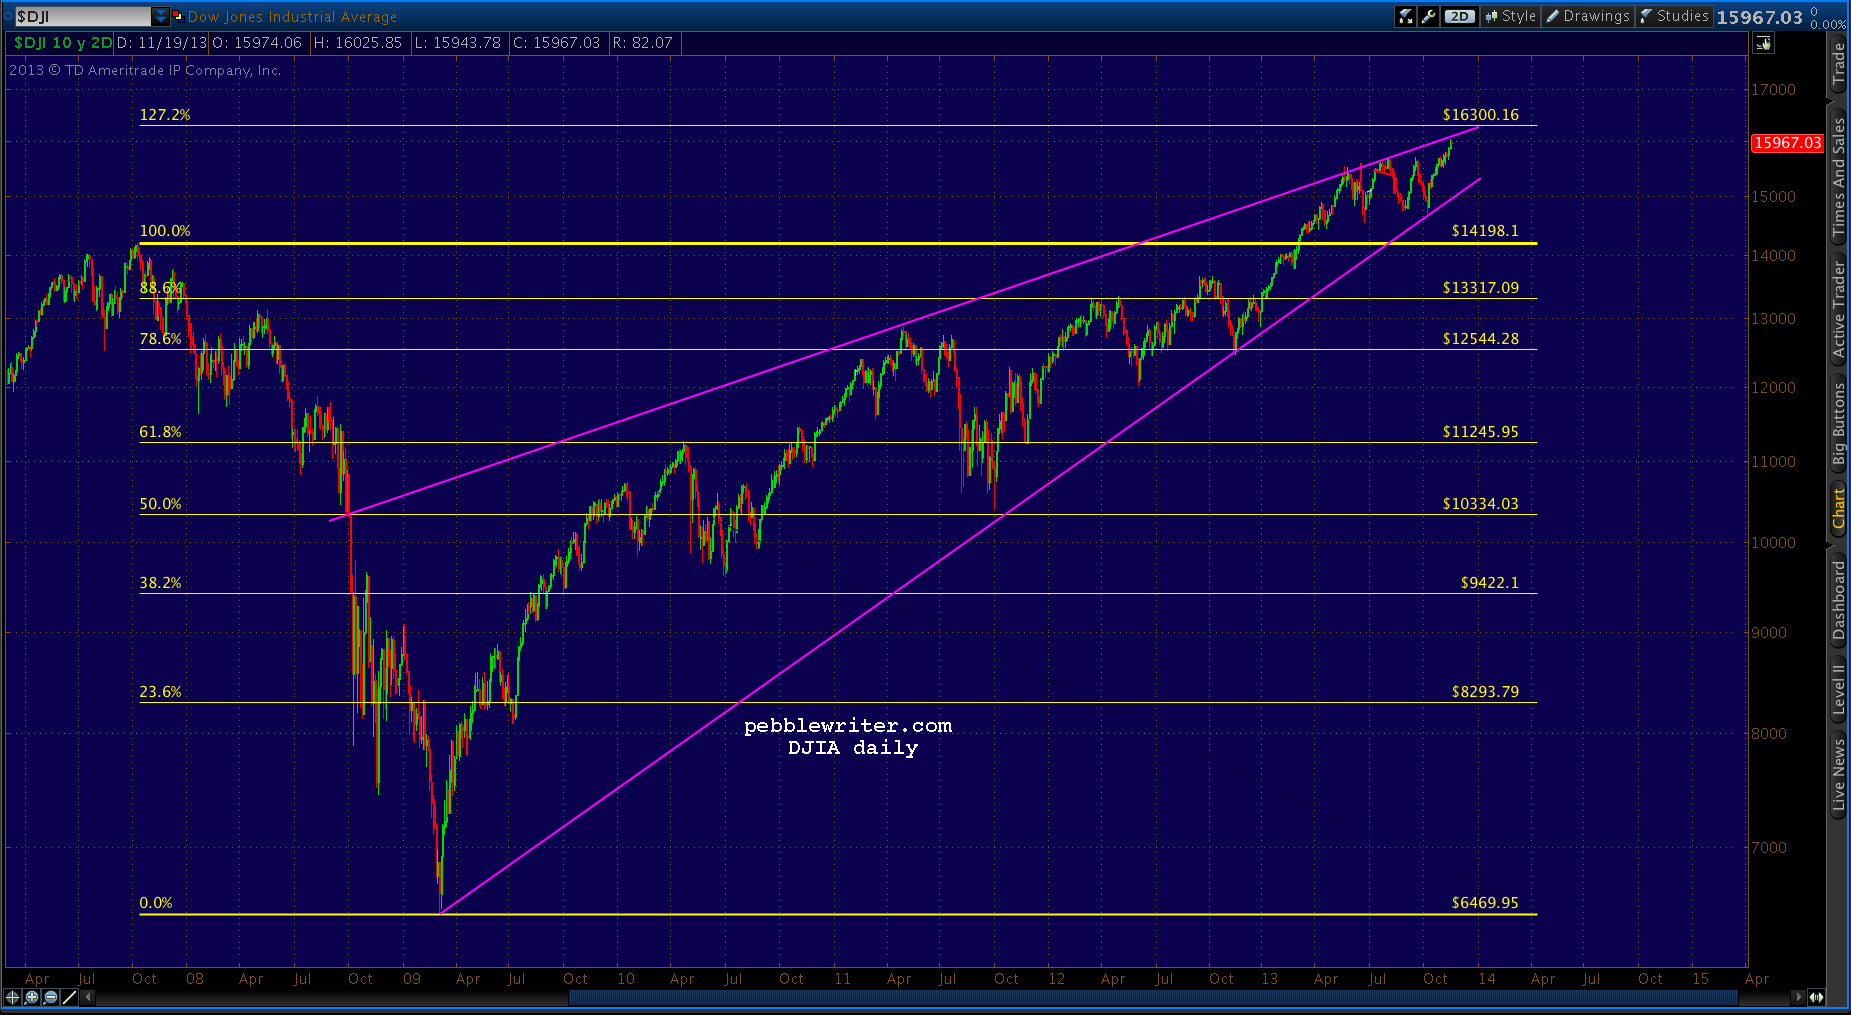
The past 13 years have seen two crashes of over 50%. After inflation, the S&P 500 index isn’t even back to its March 24, 2000 high. With markets at nominal all-time highs and approaching yet another potential turning point, maybe it’s time to focus on a different approach.


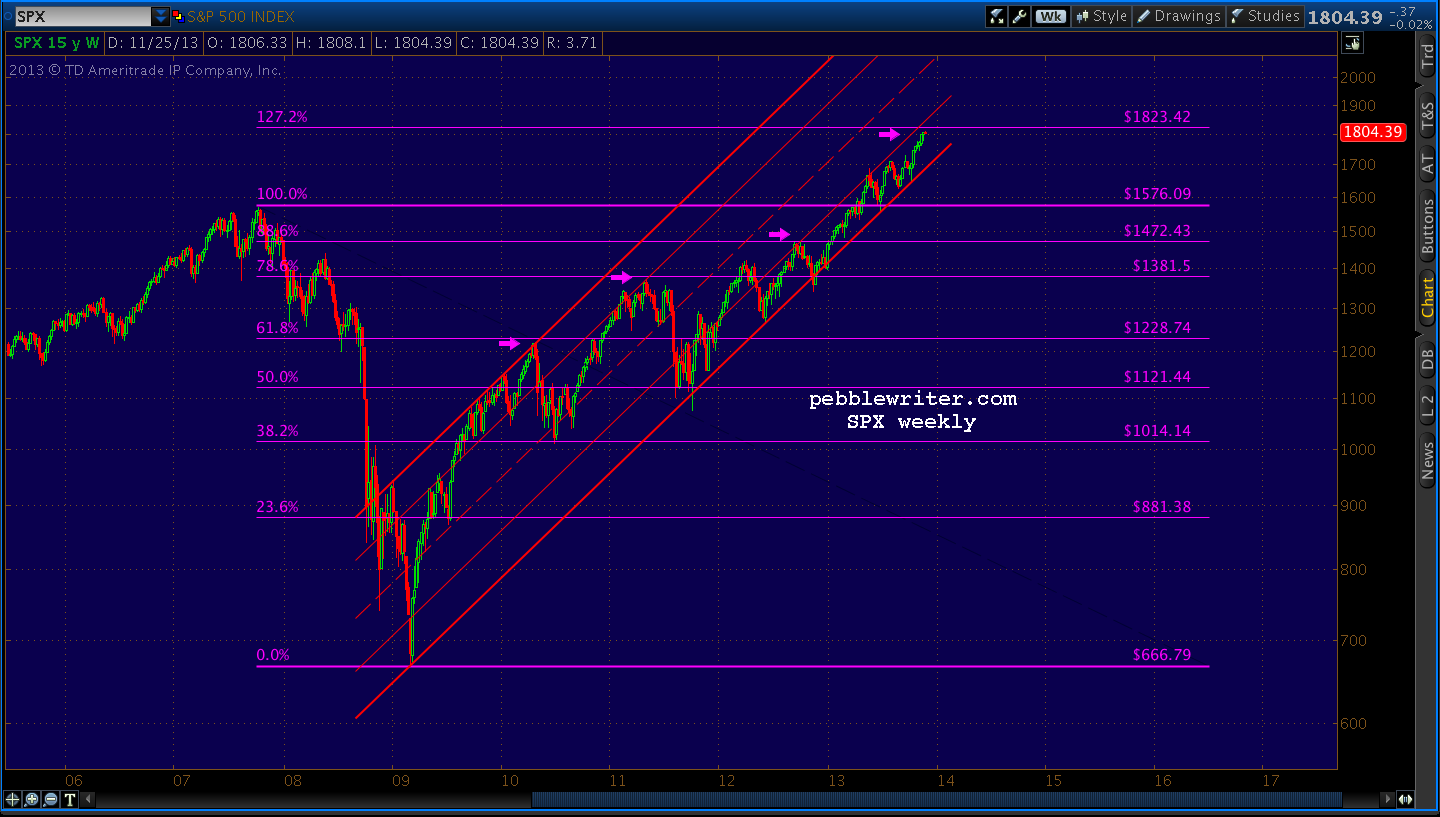 For those who have been following this website for any length of time, this is a major milestone we’ve been anticipating since Mar 29, 2012 — shortly after this website was launched [see: All the Pretty Butterflies.]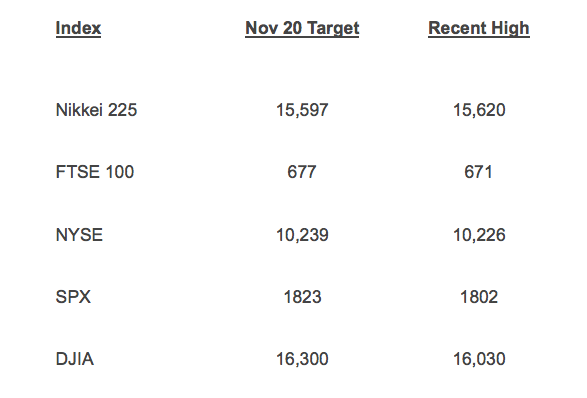
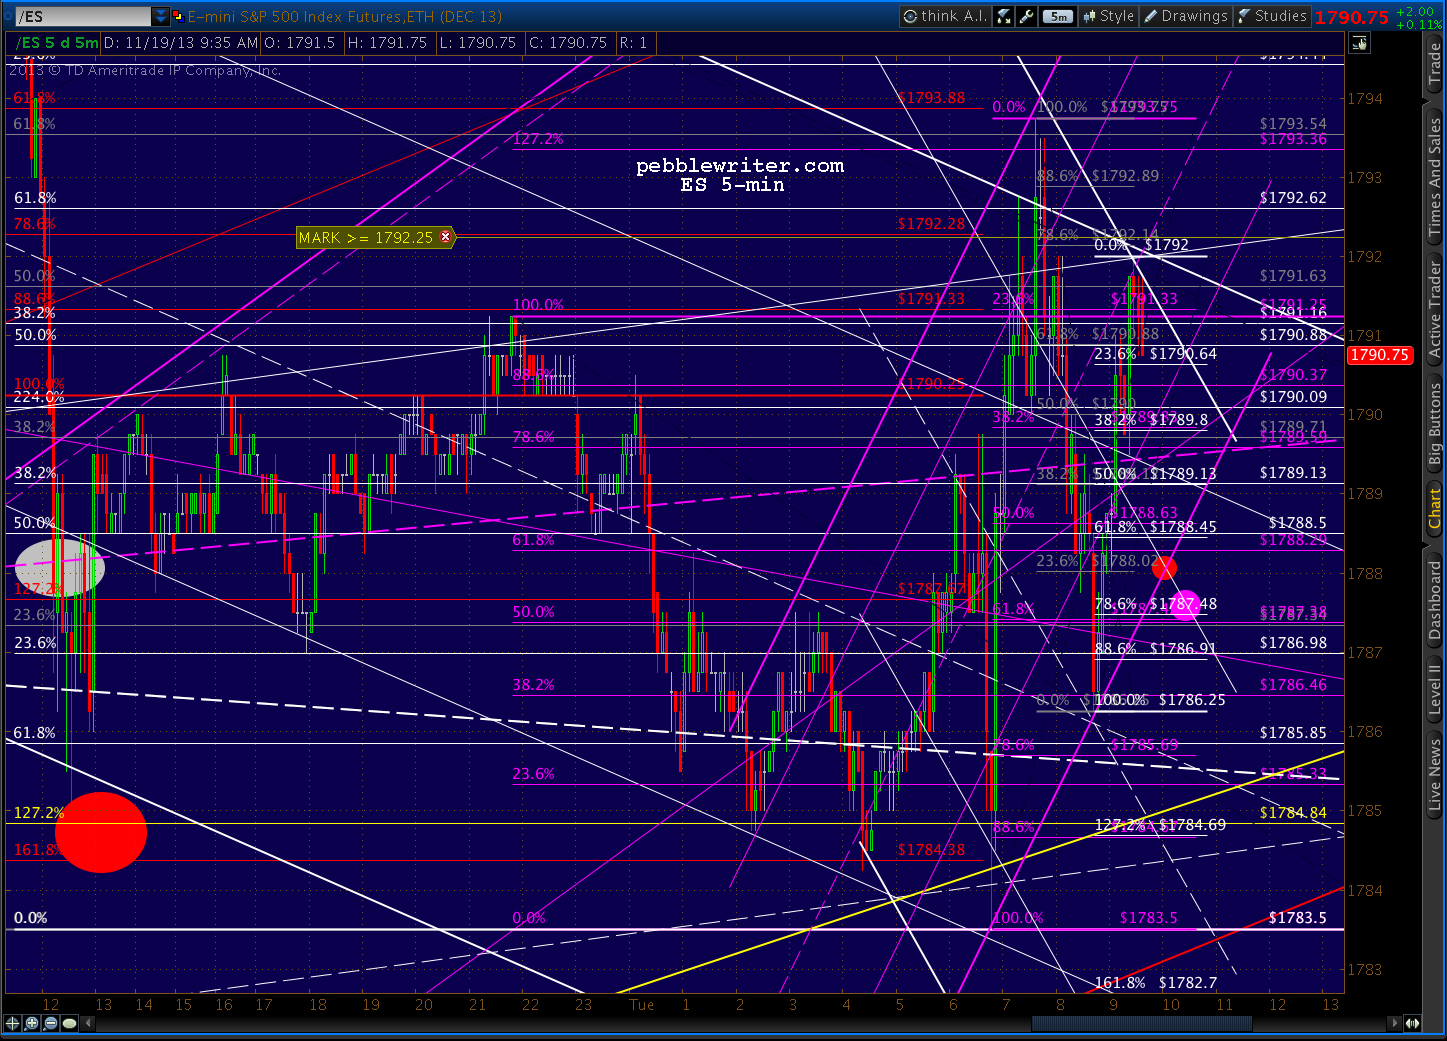
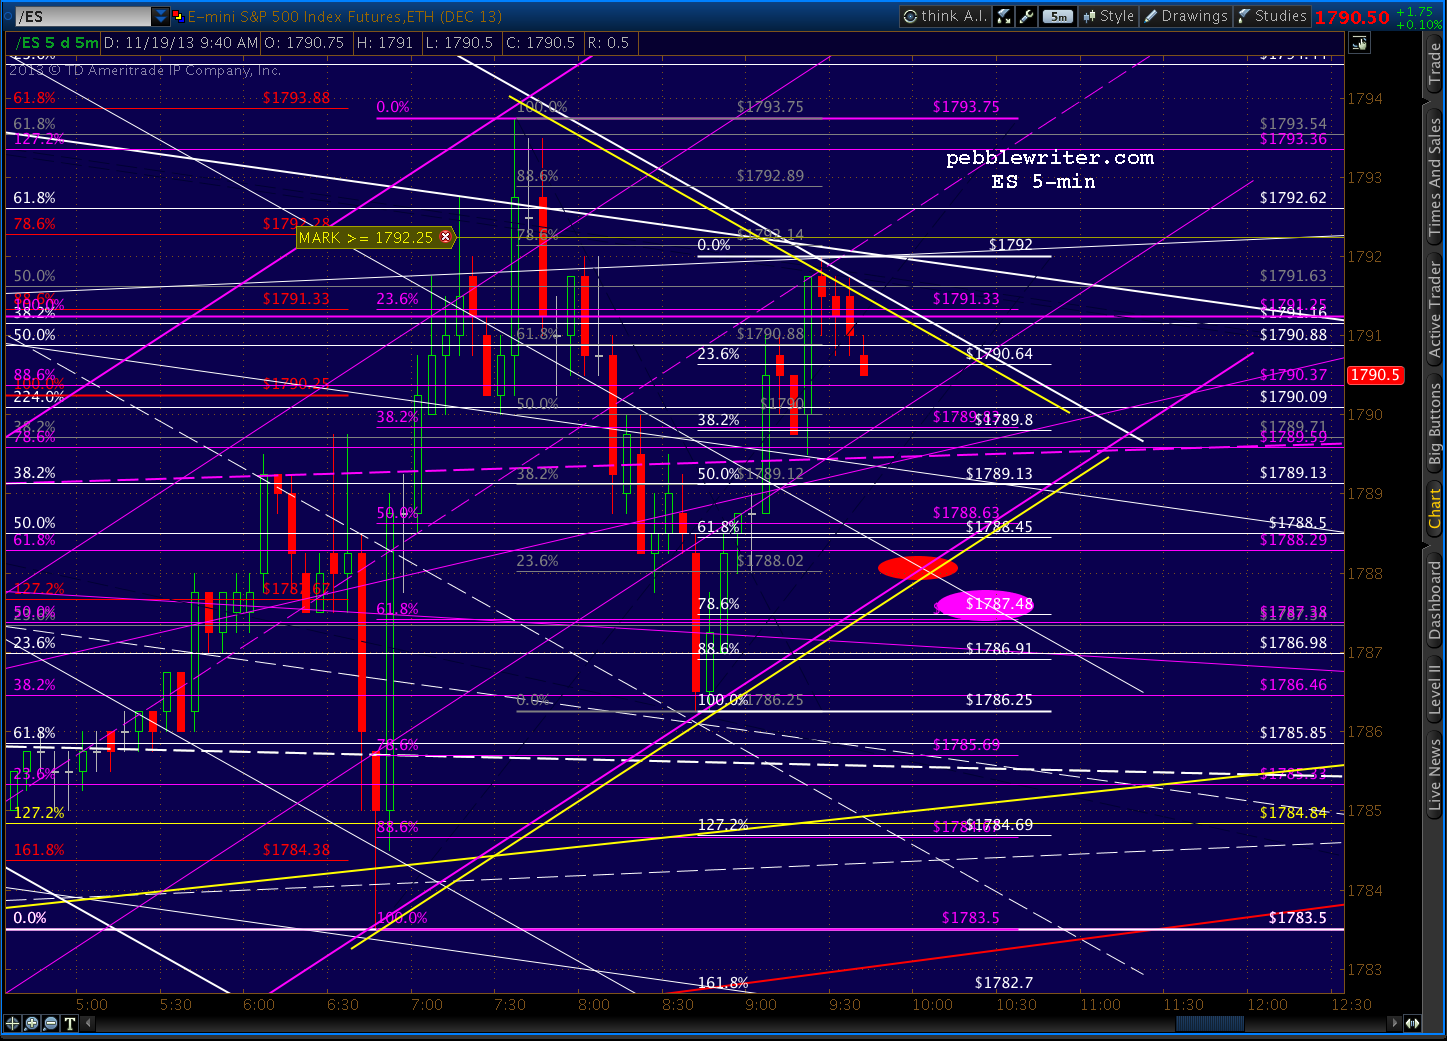
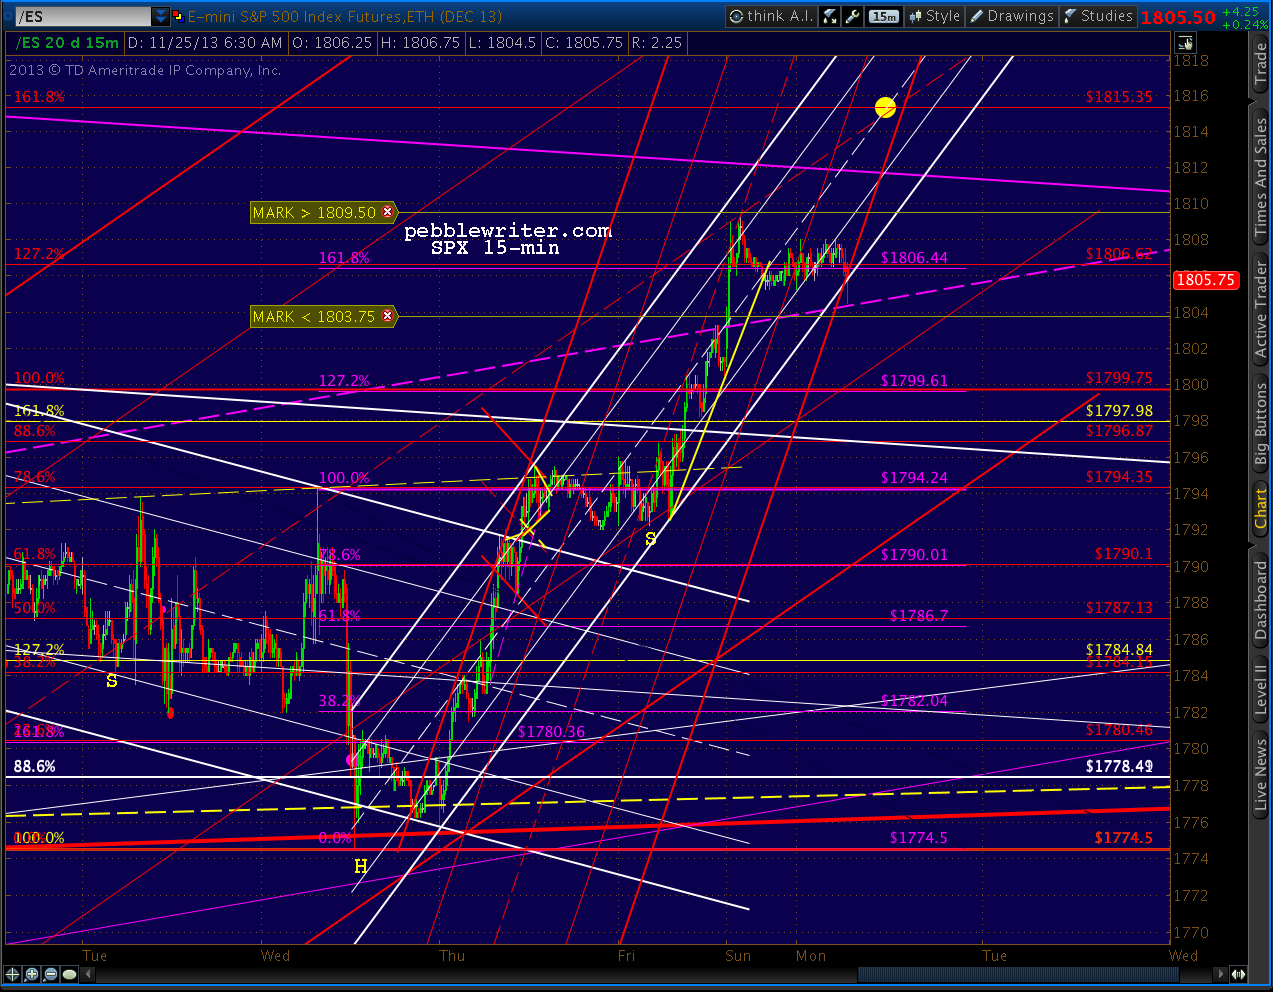 UPDATE: 10:00 AM
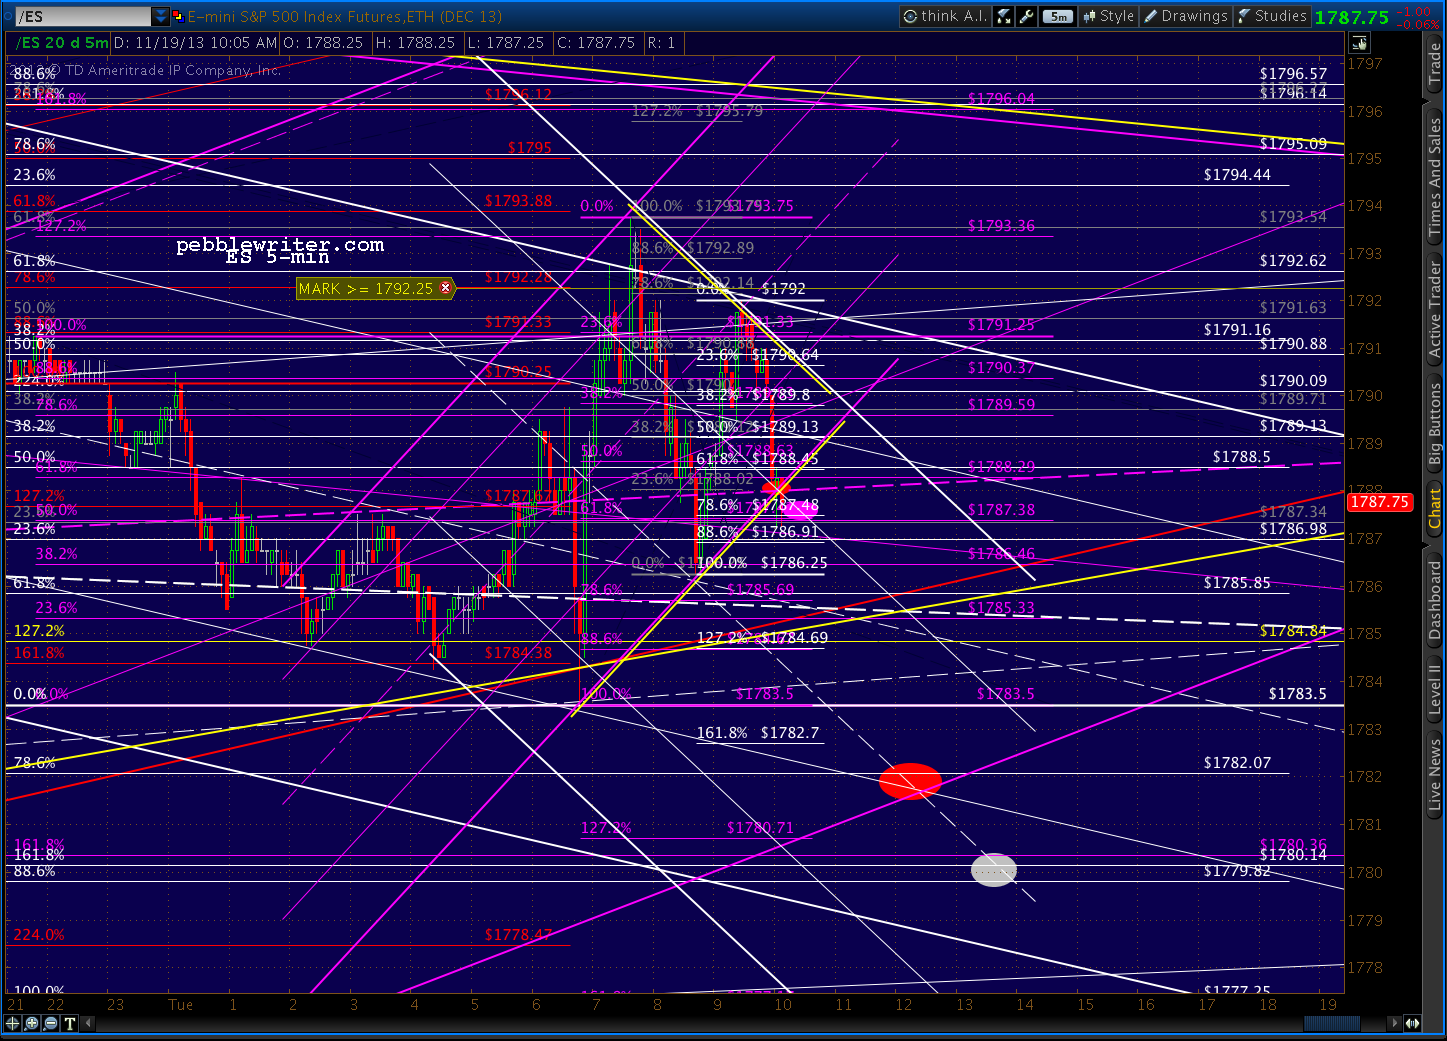
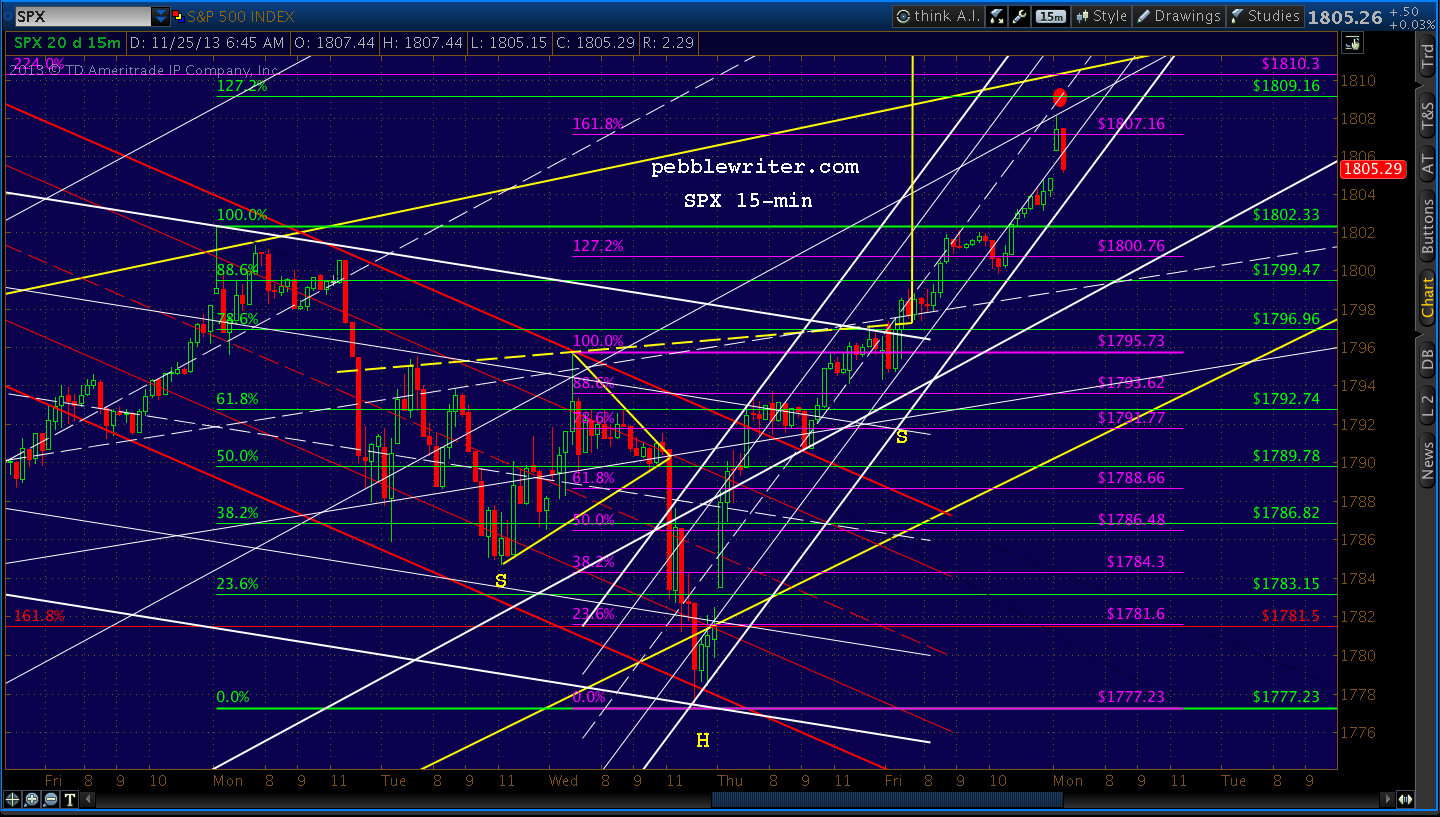 UPDATE: 11:55 AM
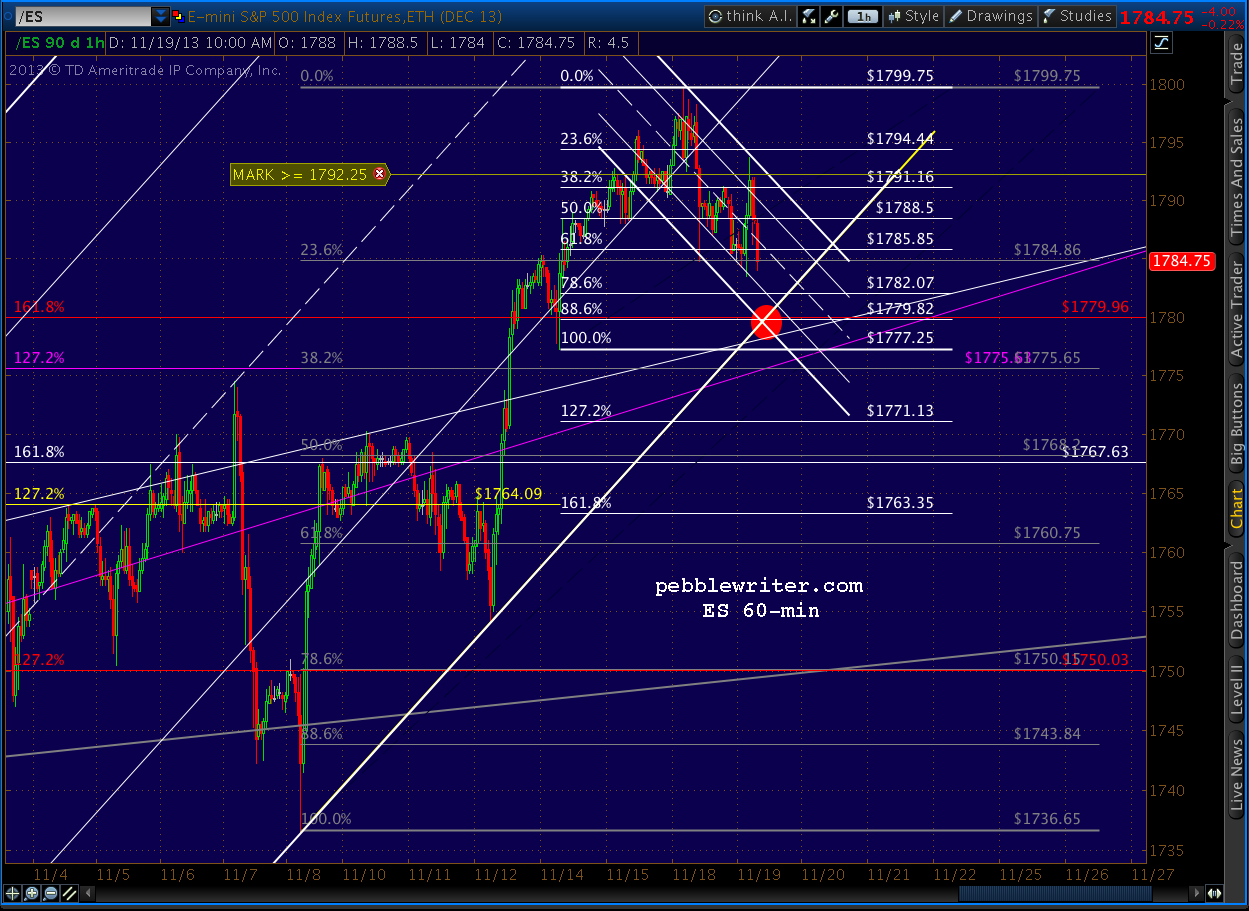
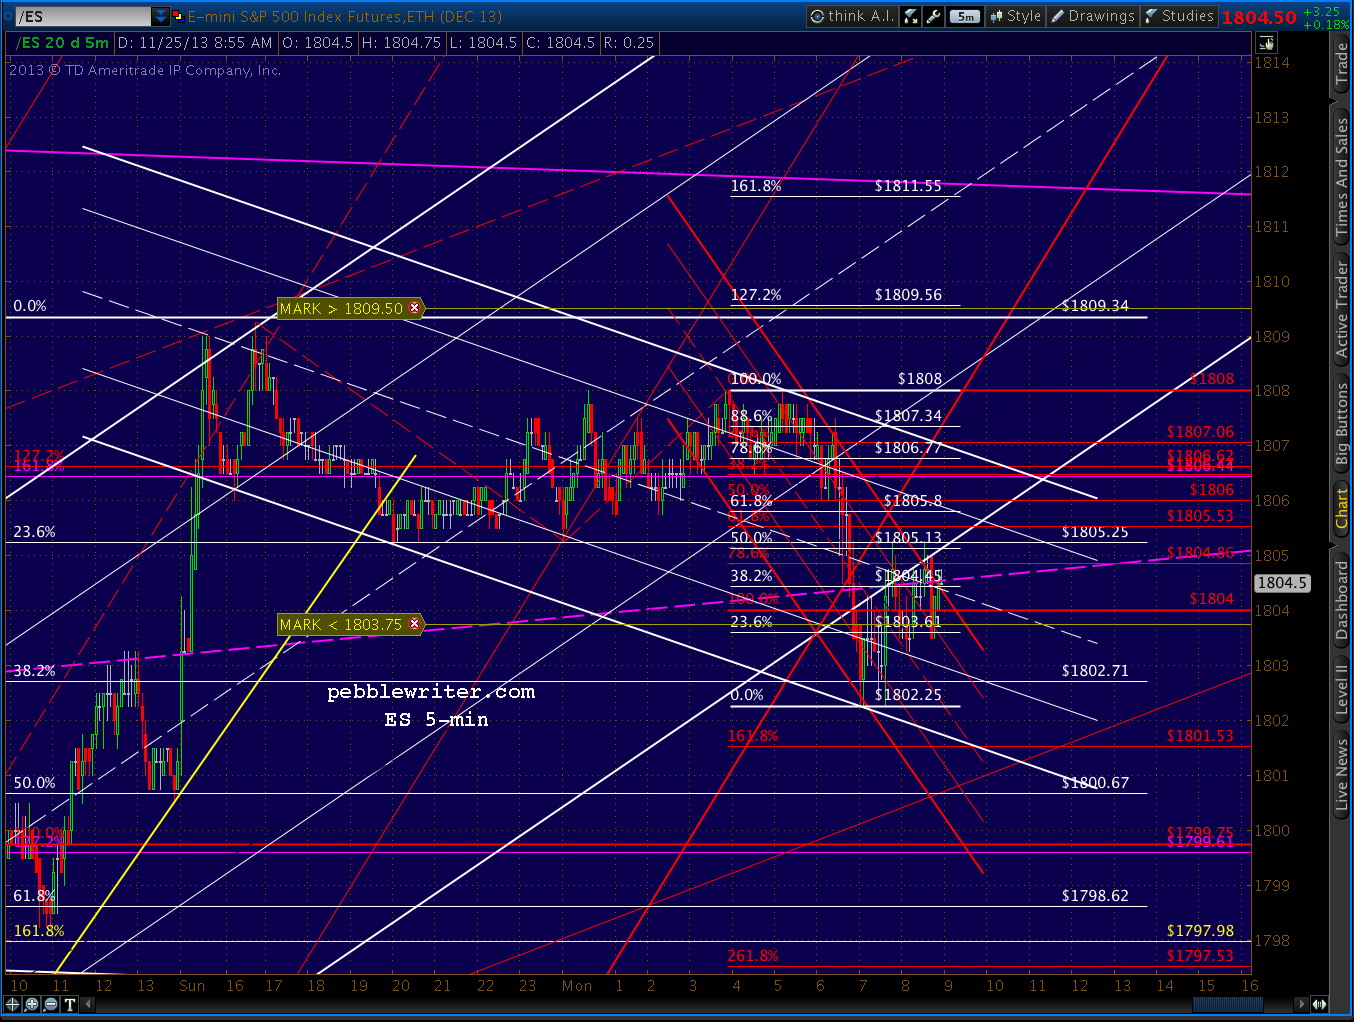 UPDATE: 3:10 PM