Posts

  • Big Picture: Sep 9, 2014

    Continuing the theme began yesterday of big picture items, we’ll take a quick look at interest rates.  The 10-yr note was another of those bearish charts from earlier in the year.

    While the talking heads insist that lower rates would be a good thing for stocks, the chart shows otherwise.  Reversals from tags of a falling white channel as well as the yellow dashed trend line led to stock sell-offs, as the chart from March clearly shows [see: Eye Candy for Bears]:

    2014-05-19-TNX v SPX w notes

    As we anticipated, rates did, in fact, decline from the start of the year.  Yet stocks have done anything but follow along.  What gives?

    2014-09-09-TNX 60 0600

    Rates can decline for lots of reasons.  But, the chief reason for the highlighted past declines was fear.  As markets were perceived to become riskier, money at the margins flowed from equities into bonds and notes — bidding u prices and driving rates down.

    If investors have learned anything from the past year in the “markets,” it’s that there is nothing to fear.  Each (successively smaller) dip has been aggressively bought. Margin debt and complacency are at extremes.  And, long-short hedge funds have stopped shorting all together.

    Time will tell whether the relationship between TNX and SPX that dates back to 1998 is broken, or simply hasn’t played out yet.  With QE ending next month, I tend to think the latter.

    *  *  *  *  *

    Today’s initial sell-off reinforces our downside case — but, only if prices move through a critical level.

    continued for members

    (more…)

  • The Big Picture: Sep 8, 2014

    SPX and ES ramped strongly into the close after tagging our initial downside target Friday, but there’s been plenty of negative news (China, EU, Japan, Ukraine) in the last 72 hours — adding to a somewhat confusing Fib picture.  Note the strong swings in either direction in the past week, repeatedly crossing the IH&S neckline.  I remain partial to the 2nd downside target of ES 1981.50.

    2014-09-08-SPX 15 0615

    Japan’s economy continues to contract, weakening the yen (and aiding the USDJPY) — a net positive for US stocks. The euro also continues to weaken following the Scotland polling news.  China continues to falter.  Net net, the dollar is the key over the next few days.

    Remember the long-term USDJPY chart from December 26, 2013?

    We noted that previous tags of the top of the yellow channel from 1998 had not been kind to equities, prompting declines of 22%, 35% and 57%.  We also noted that USDJPY would decline in the next few days, which it did — plunging from 105.43 on Jan 2 to 100.74 on Feb 4.  SPX lost about 112 points as a result — a 6% decline.

    What we didn’t see coming was the BOJ’s decision to put a floor under USDJPY at 101.43.  Indeed, ten subsequent attempts to pierce 101.43 were each rejected vigorously — which fueled the dollar-yen carry trade, resulting in a series of new highs for US stocks (the thin purple line.)  The last boost was the strongest, taking USDJPY all the way back to the previous high — and, importantly, the top of that yellow channel yet again.  And, FWIW, the Jan 2 high of 105.43 came in just shy of the .618 retrace (105.57) of the drop from the 2007 high to the 2011 low.

    2014-09-08 USDJPY daily 0723

    The big question, then, is whether the BOJ will be content with the pair trading below 106, or will they feel compelled to ramp it up to new highs?  Abe’s advisor Koichi Hamada hinted this morning at further yen weakening.  According to Bloomberg:

    “The weak yen benefits the economy by increasing corporate profits, capital spending, employment and tax revenues even if it hasn’t boosted exports,” said Koichi Hamada, 78, who helped Abe design his reflationary policies. “It’s a positive for Japan’s economy.  I understand why the BOJ is not trying to stop the yen weakening, as they see sustaining the recovery as important and the weak yen as a tailwind for the economy.  The yen is back at 105 yen per dollar now and it looks like it’s going to weaken even further.” 

    This echoes BOJ’s Kuroda, who last week proclaimed that a weak yen “wasn’t negative for the economy.”  A lower yen, of course, boosts exports. The flipside, however, is that it increases the cost of imports — which affects everybody in Japan who eats, travels, heats their home or factory, buys raw materials for manufacturing, etc.

    Like the Fed, the BOJ touts a low rate of inflation by excluding many real and meaningful price categories which are positively soaring. With the nukes offline (for now) fuel prices are a particular problem.

    Screen Shot 2014-09-08 at 8.32.45 AM

    Toss in a 60% increase in sales taxes — and another 25% increase coming next month — and the citizens of Japan are feeling the pain.  Abe’s popularity slumps a little further with every tick higher in prices and taxes.

    Bottom line, someone has to be thrown under the bus: either Japan’s consumers or its exporters.  Neither is palatable for the politically savvy Abe, leading us to believe the USDJPY could remain in the 102-106 range for the foreseeable future, with any further declines in the yen limited to Draghi-style jawboning rather than actual intervention.

    If it pushes above the January highs of 105.43, however, the question is moot.  It will have broken out yet again.

    to be continued…


  • Charts I’m Watching: Sep 5, 2014

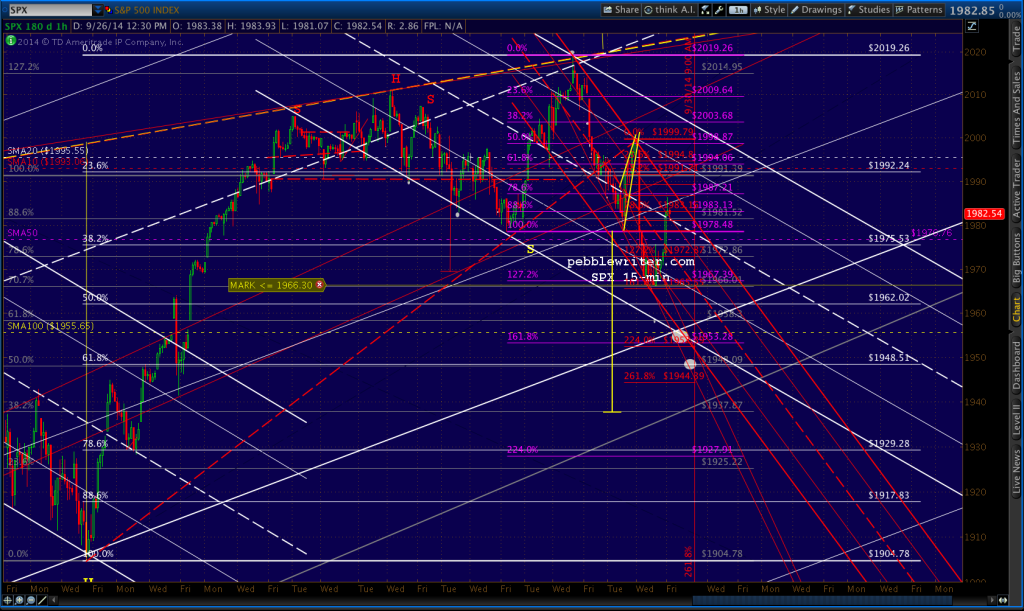
    Futures spiked 10 points on the crappy jobs data, then promptly gave most of it back.  Key chart factors: yesterday’s late day plunge further distanced stocks from the rising white channel.  The backtest we surmised would lead to a decline seems to be underway, but not without a fight from the algos — characterized by three backtests (so far) of the purple channel.  Yesterday’s downside target remains in play until stocks climb back into that channel and stay there.

    While D1 would suffice as a Butterfly Pattern, D2 (1980ish) represents the SMA20 and the red 1.618 and the larger white channel midline.  As such, it makes a much more appealing target — if TPTB allow the market to settle a little lower.  And, lately, that’s a huge “if.”

    2014-09-05-ES 15 0615

    Bonds prices shot up on the data this morning, clearing a falling channel.  And, the USDJPY is struggling after setting a new high overnight (based more on USD strength than JPY weakness.)

    The backtest by SPX is a little cleaner, but the same downside target is worth watching.  On the SPX chart, 1977 represents the SMA20, the white 1.618 and the falling white channel bottom.

    2014-09-05-SPX 15 0640


    UPDATE:  12:30 PM

    ES tagged our D1 target on the nose this morning.  It remains to be seen whether we’ll get another thrust lower.

    2014-09-05-ES 15 1000

    Algos have taken over again, driving the DX up toward the .886 and SMA200 on 5-min chart.

    2014-09-04-DX 5 0922

    Might get a reversal here, given that USDJPY is approaching its SMA100 on the 5-min — scene of its strong reversal early this morning.

    2014-09-05-USDJPY 5 0937

    Lots of fib and channel overhead resistance at SPX 2003ish…

    UPDATE:  2:55PM

    SPX overshot the resistance, and is possibly backtesting it as support.  FWIW, the yellow dashed line running through the chart is the neckline of the big H&S Pattern from July.  Its

    2014-09-05-ES 5 1153

    Seen below in yellow.  Take your pick of right shoulders — either done or something more balanced like the lower “S” at the white channel midline.  Obviously, prices have pushed through the neckline several times before — but, without any follow-through (your “market” run by algos…)

    2014-09-05-SPX 1200


  • Charts I’m Watching: Sep 4, 2014

    The USDJPY continues to tread water around the daily .886 retrace of the drop from Jan 2.

    140904_080506_CQG_Integrated_Client_Chart_USDJPY_-_Japan_(Yen)_Daily

    The futures went nowhere on BOJ’s non-action on rates or QE, but raced ahead 10 points on hopes that the ECB would pump up the volume.  As usual, Draghi’s speech was long on promises but lacking on real import.

    continued for members

    (more…)

  • Charts I’m Watching: Sep 3, 2014

    Keep an eye on USDJPY, which is due to react to under the major .886 (104.89) discussed yesterday.  Quick overview on SPX, which is likely to follow:

    (more…)

  • Charts I’m Watching: Sep 2, 2014

    Interesting chart from BofA, republished in Zerohedge this morning:

    Screen Shot 2014-09-02 at 6.14.38 AM


    USDJPY has shot up on continuing dismal economic news out of Japan, reaching the .886 retracement overnight of the drop from 105.43.

    2014-09-02-USDJPY daily 0600

    This coincides with a smaller scale potential reversal for SPX.

    (more…)

  • Charts I’m Watching: Aug 29, 2014

    Today’s setup: end of the month and holiday bullish bias and channel support versus disappointing economic data here and abroad (and, that war thing in Ukraine that the “market” doesn’t seem to care much about.)

    One wildcard is Japan.  The latest data was, again, horrid.  But, there’s increased talk of doubling the country’s pension plan’s allocation of stocks.  No economic recovery? No problem.  The carry trade should be safe for a while longer.

    (more…)

  • Charts I’m Watching: Aug 28, 2014

    So, the Head & Shoulders Pattern worked out after all.  Miracles never cease.  Last night’s plunge below the neckline hasn’t been erased by the inexplicable Q2 GDP estimate increase.

    (more…)

  • Charts I’m Watching: Aug 27, 2014

    Quick update on ES, which saw an interesting turn of events today…

    (more…)

  • Update on USDJPY: Aug 27, 2014

    USDJPY is faltering.  Recall that it recently tagged the large scale .618.  It has been in pullback mode ever since.  As I first charted in December 2013, pullbacks from the top of the yellow channel have always resulted in large stock market declines.


    2014-08-26-USDJPY wkly 20

    The latest, which started around the first of the year, hit a wall — or, rather, a floor.  The BOJ has aggressively defended the 101 level — negating the damage to both the red and grey channel damage done over the past several months.  Due to the wonders of the USDJPY carry trade, this has put a floor under stock prices as well.

    2014-08-26-USDJPY wkly

    As the rebound off the last bounce off the floor has accelerated, SPX (purple below) has hit new highs.

    If USDJPY’s pullback picks up steam, stocks should at least take a pause.  Keep an eye on the SMA10, which has held up since Aug 13. Two caveats before shorting anything:

    1. it would be unusual for it to happen in the last few days of the month
    2. most pullbacks in USDJPY have occurred in the overnight markets — leaving less of a mark on US stocks, and less of an opportunity for traders to participate.

    2014-08-26-USDJPY dailyOne last warning…USDJPY’s SMA50 is gaining on its SMA200. A Golden Cross is in the offing if the pair can maintain its momentum for the next week or so.

    GLTA.