Getting a bit of an early start this morning due to traveling…
Friday saw the repercussions of USDJPY continuing to operate below the SMA100 as our analog predicted. USDJPY itself hasn’t fully given in to the downside. The .618 at 118.02 remains the most obvious target. It’s not much of a drop, but the potential implications for the yen carry trade are huge.
Unfortunately for bears, CL continues to take up the slack — propping up stocks with no difficulty.
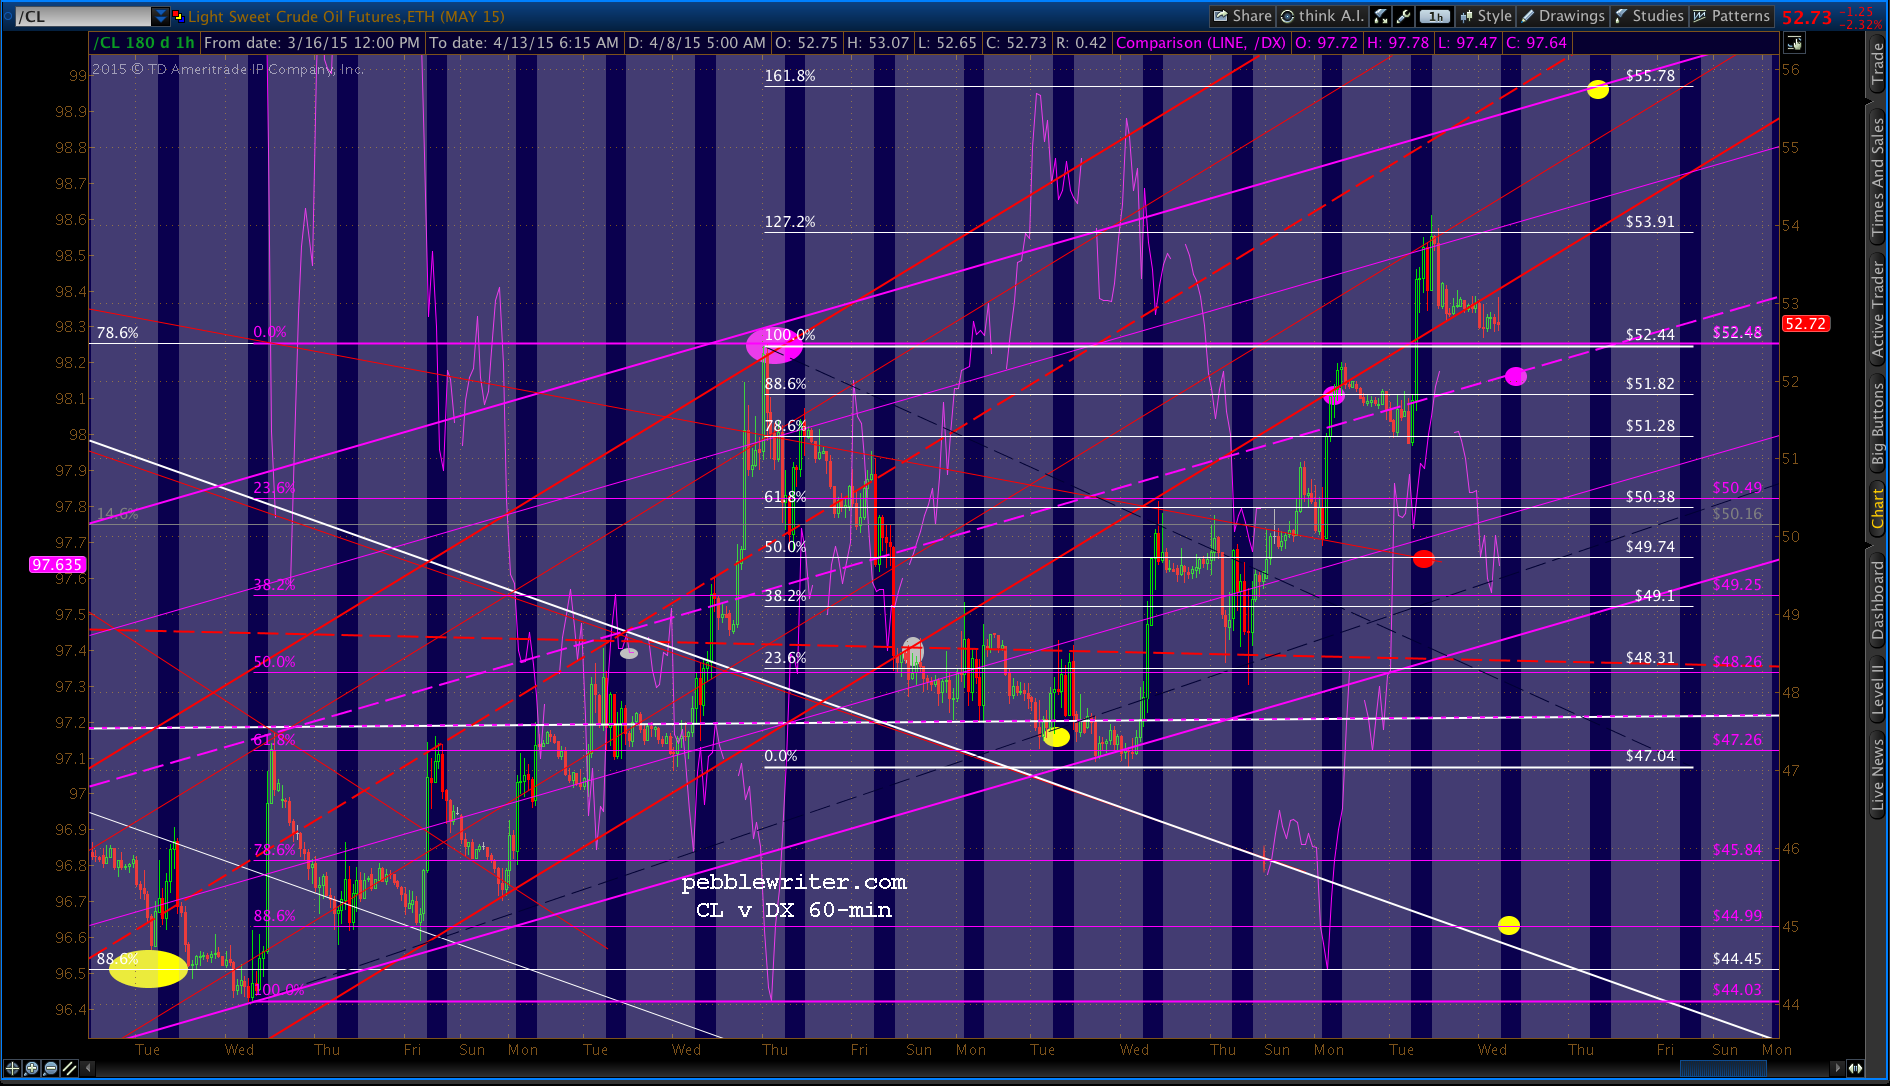
Friday saw a decline below the 1.272 at 57.43, but the ramp job in the past 24 hours, as usual, has driven futures higher. The 60 min chart:
VIX and TNX continue to play footsie with bearish chart patterns — hinting but not committing. TNX can’t seem to get below 1.85ish…
…and, while VIX popped higher on Friday, it hasn’t even broken out of the falling gray channel.
The big news yesterday was CL tagging our upside target during the session. It was enough to prop up SPX, but not break through the former high.
CL spiked even higher overnight to keep the futures in check, but is now backtesting the red 1.618 with an eye toward moving lower.
The daily chart shows the bounce off the mid-March lows.
It has been necessary in order to offset the weakness that would otherwise be inflicted by a sputtering USDJPY — which closed below its SMA for the second time yesterday.
UPDATE: EOD
USDJPY loitered around the channel bottom all day, managing to close below the SMA100 (119.23) yet again.
The only thing that kept SPX from tanking was — yep, you guessed it — another ramp job in CL.
So, if you notice it takes a few more bucks to fill up the Family Truckster this weekend, at least you can take solace in the fact that you helped the S&P 500’s losses remain tiny at only 1.64 pts.
CL is now 30.4% higher in the past month, 14.6% in the past week alone — all in the face of daily news blurbs heralding huge excesses in production and storage supply. Gotta love an unrigged market…
On the surface, it looks like SPX bounced at the 10, 20 and 50-day moving averages yesterday — a normal and understandable occurrence. But, the bounce came at 2083.24, and the nearest SMA was at 2082. It seemed that USDJPY’s plunge would surely prevail. After all, it’s been a long, cold winter for bears and a rising yen is their best hope for a meaningful thaw.
Unfortunately for the bears, what the yen gaveth, CL taketh away. With yet another rally — this one only 2.7% in a few hours time — CL-fueled algos erased the morning’s red ink and left SPX green on the day.
Likewise, last night’s drop in USDJPY would look promising — if not for another overnight ramp job (2.6% this time) in CL that has taken it back above the white 1.272.
It’s yet another example of the “heads I win, tails you lose” scheme that’s setting stock prices lately. Drops in USDJPY that might have driven stocks lower only a few months ago are now offset by rises in CL — transmitted by the relatively lower US dollar that joins them at the hip.
The only real risks to the set up are the euro and the carry trade unwind. So far, the euro has been propped up well enough to keep the dollar on the defensive. That will change if it resumes its decline to our .9898 target.
The carry trade unwind is a potentially more serious problem for bulls should the yen’s tumble be over. But, judging from the past few months, keeping USDJPY going “sideways” seems to work nearly as well as keeping it on the rise. And, in the end, Abe and Kuroda will ease even more. They truly have no other choice.
What if the euro tumbles more, the yen strengthens and oil can’t be propped up anymore? Do bears have a chance? Odds are TPTB will simply fall back on VIX, treasury and index futures manipulation to achieve their rallies. How cool is that!?
Bottom line, our analog should continue to play out as expected. Sadly, I see nothing on the (artificial) horizon to upset it.
UPDATE: 12:00 PM
CL just nailed our intermediate target of 55.78. If it reverses here as it should, then USDJPY will have to pick up the slack in levering SPX higher.
At the moment, though, USDJPY is looking rather sickly. And, the euro ain’t helping much. Maybe we’ll get a dip after all?
Look for SPX to run into a brick wall at 2106.95 or so. From there, it should be downhill.
The culprit, as anticipated when this analog first became apparent: USDJPY. [see: A New Analog Mar 27.]CL, however, continues to mitigate USDJPY’s effects. Remember, the yen can weaken only as long as CL remains under control.
Conversely, a strengthening yen will allow CL to rebound (and the dollar to weaken) — as long as the euro also strengthens — which it has since hitting the .886 we discussed yesterday.
Our price targets for SPX remain in place, with the most likely timing either today or tomorrow.
It’s pretty interesting that today — one day before the expected cyclical low of our USDJPY-based analog — is the day that Abe’s close advisor Koichi Hamada chose to announce that the yen should increase in value to 105 to the dollar versus the current 120ish. For more on Hamada’s views, check out THIS VIDEO.
The USDJPY’s reaction was swift and unambiguous — though, just as quickly, the pair popped right back to the yellow .618 at 120.11. Is it just a backtest, or something more troubling for Abe and friends?
The futures reacted mildly, but what if carry-traders should get the idea that Abe intends to end the free ride? Would they meekly ride off into the sunset, or would they stand their ground?At the end of the day, who really controls the USDJPY? This is a question the “market” will decide for us. And, given that all of the currency pairs we chart are at important inflection points, it will be a very interesting next couple of days.
If I loaned you $100 with the understanding you would only have to repay me $75, would you take that deal? What if I charged only 1/10th of 1% interest? What if I threw in an investment vehicle where you could put that $100 and be guaranteed by the government never to lose any money?
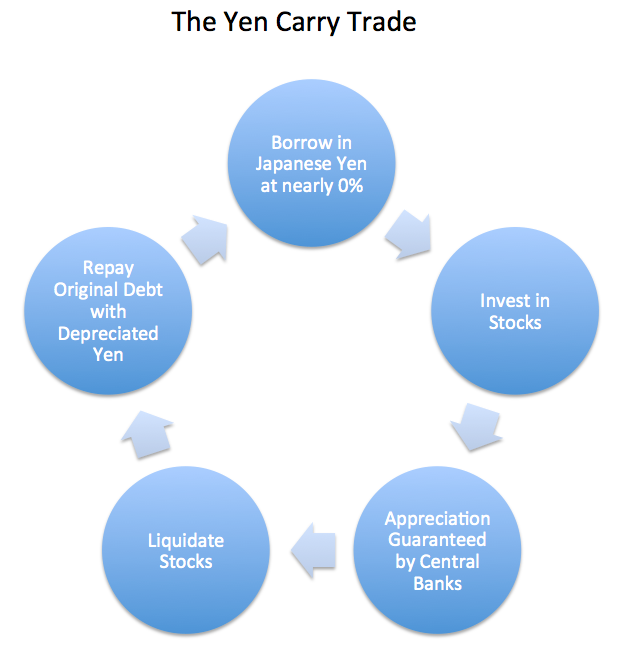
Meet the yen carry trade — the primary driver of higher equity prices since at least October 2011. We’ll take a look at how it works, and how it has distorted both equity and debt markets worldwide.
Basics of a Carry Trade
Generically speaking, a carry trade is an arbitrage that involves borrowing cheap and investing rich. In the old days, it usually meant borrowing at a low interest rate (e.g. yen) and investing at a higher interest rate (e.g. US dollars.)
One major risk, of course, was that the currency in which one invested would depreciate — resulting in a higher cost when the time came to repay the borrowing. Given how quickly currency markets move, it could turn a profitable trade into an unprofitable one in a heartbeat.
The Bank of Japan eliminated that risk when it repeatedly assured investors that the yen would continue to fall in value relative to the US dollar. A drop, for example, from 75 to 100 yen per dollar (expressed as an increase from 75 to 100 in USDJPY) represented a major opportunity for investors.
A SIMPLE EXAMPLE:
borrow $100 million in yen (7.5 trillion yen) at essentially 0%
reinvest in T-bills at 10 bps
the T-bills mature in a year, returning $100MM and interest of $100,000
repay the 7.5 trillion yen, which now costs $75 million in US dollars
pocket the $25 million (plus the $100,000 interest!)
A $25 million return on a $100 million investment (25%) ain’t too shabby. It’s downright enormous when the initial investment is a loan collateralized by treasuries or other securities you already own. If the collateral impairment were 5%, for example, the annualized ROI would clock in at 400%.
If a 25% gain seems unlikely, consider that USDJPY rose over 60% between 2011 and 2014. In fact, it rose nearly 25% between Nov 2012 and May 2013 alone.
Most investors would be very satisfied with a 25% return, let alone a 400% return. But, that’s just the tip of the iceberg. Suppose that, instead of investing that $100 million in T-bills at a 10bps guaranteed return (plus the enormous currency benefit), an investor put that money into stocks.
Not Your Father’s Market
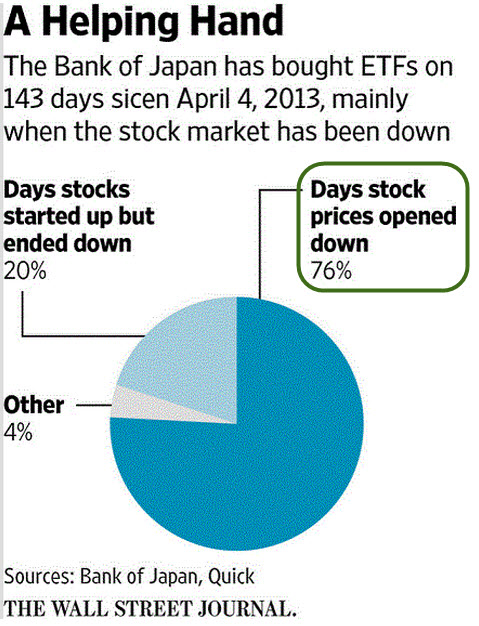
I know what you’re thinking: “what about the risk? Stocks go up…but, they also go down!” Don’t worry. The world’s central bankers have got you covered. The Bank of Japan, for instance, puts nearly 5% of its $720 billion in annual quantitative easing into stocks. It’s not a steady stream — just when the “market” needs a boost.
Don’t take my word for it. According to those tin foil hat-wearers at the Wall Street Journal, 97% of the days the Bank of Japan “invested” money into stocks were days that the market either opened lower, or reversed to close lower after initially opening higher. The Plunge Protection Team at your service.
Last October, the government decided to up the ante, increasing the share of equities in its $1.2 trillion employee pension plan (the GPIF — the largest in the world) to 25% for Japanese stocks and 25% for international stocks. Note that this is money which retiring Japanese public employees might want to use some day to, you know, retire.
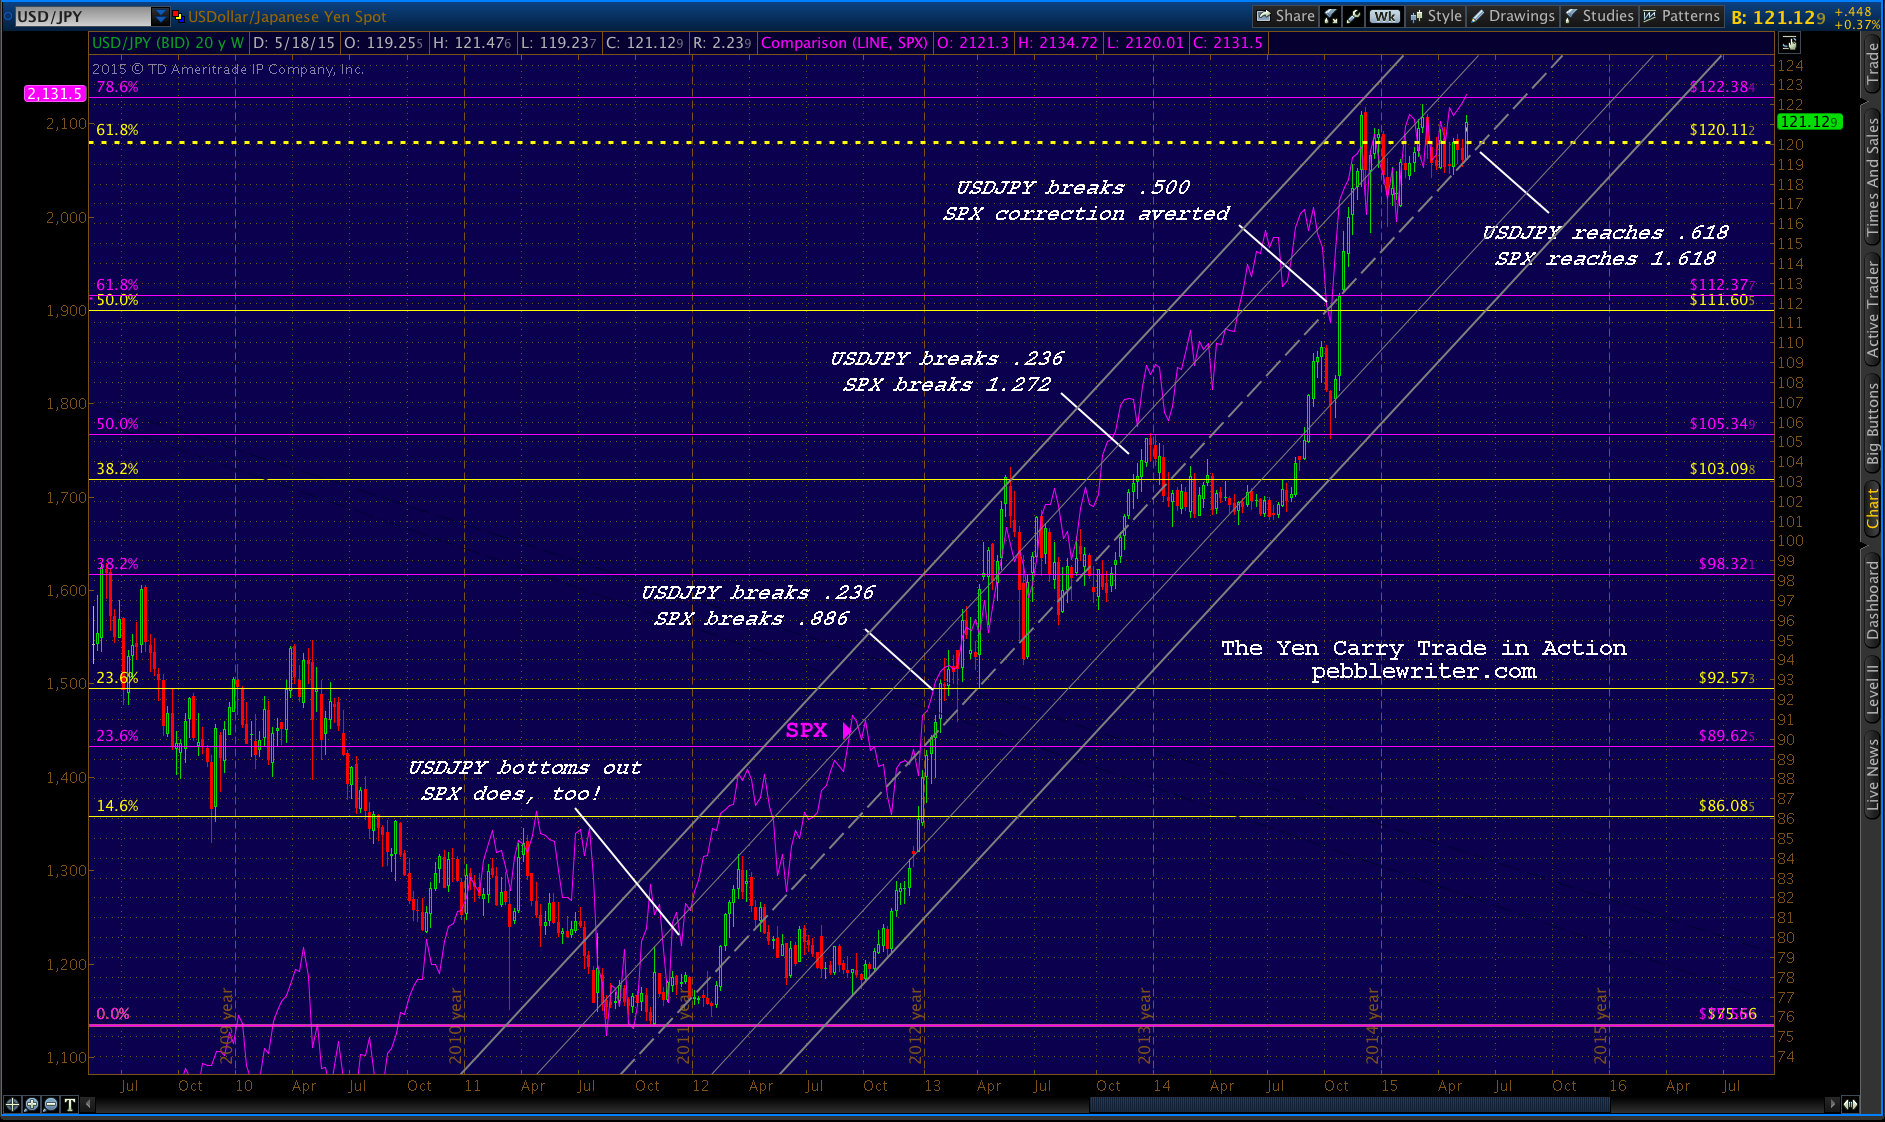
What effect has it had? Judge for yourself…
USDJPY v SPX / updated May 20, 2015
The Downside
If the yen carry trade seems like a win-win, look at it from the standpoint of the Japanese. As a small, island nation that imports much of what it consumes, Japan is quite sensitive to changes in the price of imported items like raw materials, food and oil.
Ceteris paribus, a drop from 75 to 125 yen per dollar would increase the price of oil (traded in US dollars) by a whopping 66%. Knowing this, it’s not so hard to figure out why oil prices crashed beginning in August 2014 — at exactly the same time that USDJPY shot up through long-term resistance.But, that’s another story…
The fact is that continued depreciation of the yen will cost the Japanese people as well as those corporations which rely on imported goods. So, the next time the BOJ clobbers the yen, it does so with the knowledge that for every winner, there are many, many losers. There is no free lunch.
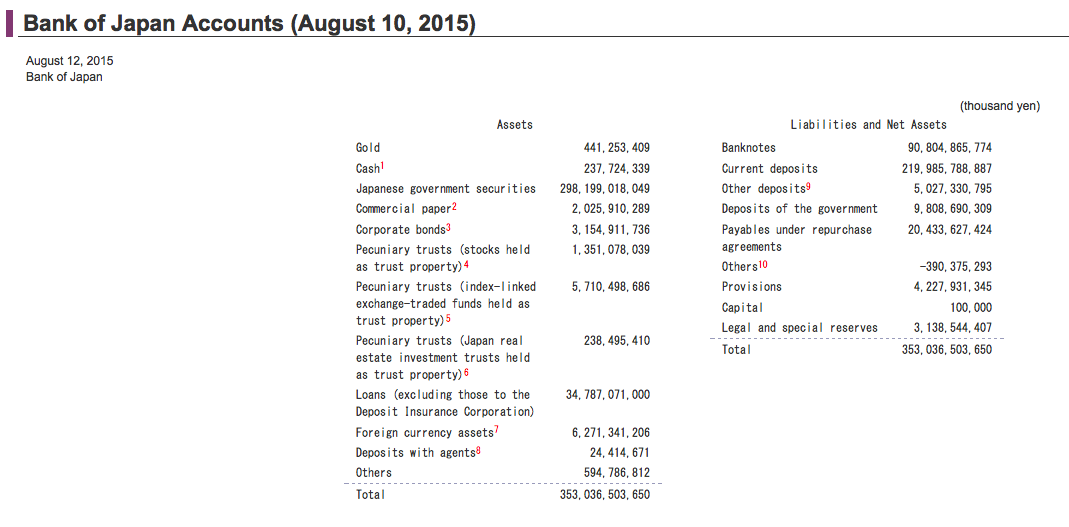
If that’s the case, why not just stop? The most recent data shows the BOJ owns almost ¥7 trillion in stocks. The ¥140 trillion Government Pension Investment Fund has allocated 50% of its assets to stocks. Let’s round it off and say the bank/government of Japan has a heavily-margined (note their tiny capital position below) position of ¥80 trillion ($666 billion) in equities.
First, note that this almost exactly the amount of annual easing that was announced in last October’s QQE expansion.
More importantly, it leaves Japan in a must-win situation. At its lows yesterday, August 24, the Nikkei 225 was off 9.5% from Friday’s close. It’s off a full 18% in less than 2 weeks.
If all of that $666 billion were in the Nikkei, the last two weeks’ exposure to equities would have cost them $120 billion — 2.4% of GDP!
Sure, some of it’s on the books of the pension plan, and the rest is presumably not going to be realized anytime soon. But, the data illustrate just how vulnerable Japan is since it: (1) put that much money into stocks; and, (2) is doing so in such a leveraged fashion.
At the end of the day, taking on this much risk smacks of desperation. With over 40% (and growing) of its borrowings going to pay interest on existing borrowings, and 250% of its GDP in debt, don’t expect things to change anytime soon. And, don’t expect the BOJ to sit idly by and allow the equity spiral to grow out of control.
They will increase QQE and/or devalue the yen again, and soon.
We’ve noted over the past several weeks that only a decline in EURUSD would permit both CL and USDJPY (and hence equities) to sell off at the same time. So yesterday’s failure of EURUSD’s rising purple channel is potentially significant.
To recap, USDJPY’s rallies almost always drive stocks higher — whether or not they last, and despite the fact that they are entirely and openly manipulated by the BoJ and other central banks — not to mention large HFT traders/hedge funds.
CL has joined the algo game over the past several weeks — also driving stocks higher when it rallies. But, it is very highly negatively correlated with the USD dollar.
So, a rally in CL drives DX lower which, everything else being equal, should drive USDJPY lower — unless it’s propped up, which it usually is. Result: rising stock prices.
A decline in CL drives DX higher, which — all else equal — drives USDJPY higher. Result: higher stock prices.
When EURUSD declines, however, DX can strengthen even while the yen strengthens (USDJPY falls.) This sets the stage for CL and USDJPY to fall at the same time, and take ES/SPX with them.
Only a trading halt prevented a truly ugly close and a slip back below the moving averages. Funny how often that happens, and so rarely when stocks are rallying sharply…
This morning, USDJPY remains above the falling red channel, CL remains above the white .786 Fib and SPX remains above its 10, 20 and 50-day moving averages. So, no harm done — yet.
Another day, another central banker propping up the markets…
So, Dudley isn’t so sure that the recovery is exhibiting the strength necessary to allow the Fed to raise rates? What a huge surprise — except to our regular readers (not so sure about the irregular ones…)
The Fed can’t afford a rate increase any more than they can a rebound in oil prices, a slump in the dollar, normalization of stock valuations, requiring banks to markU securities to market, etc.
CL ran out of room at the .886 as expected……though USDJPY was happy to take up the slack. Unfortunately, it has also run into overhead resistance — at the yellow .618 at 120.11.Futures are maintaining yesterday’s CL-driven rally highs, but weren’t able to break through the TL from October. Together with USDJPY and CL topping out, not a great sign for bulls…One potential ray of hope comes from across the pond.