Posts

  • Oil Spikes on Iran War Worries

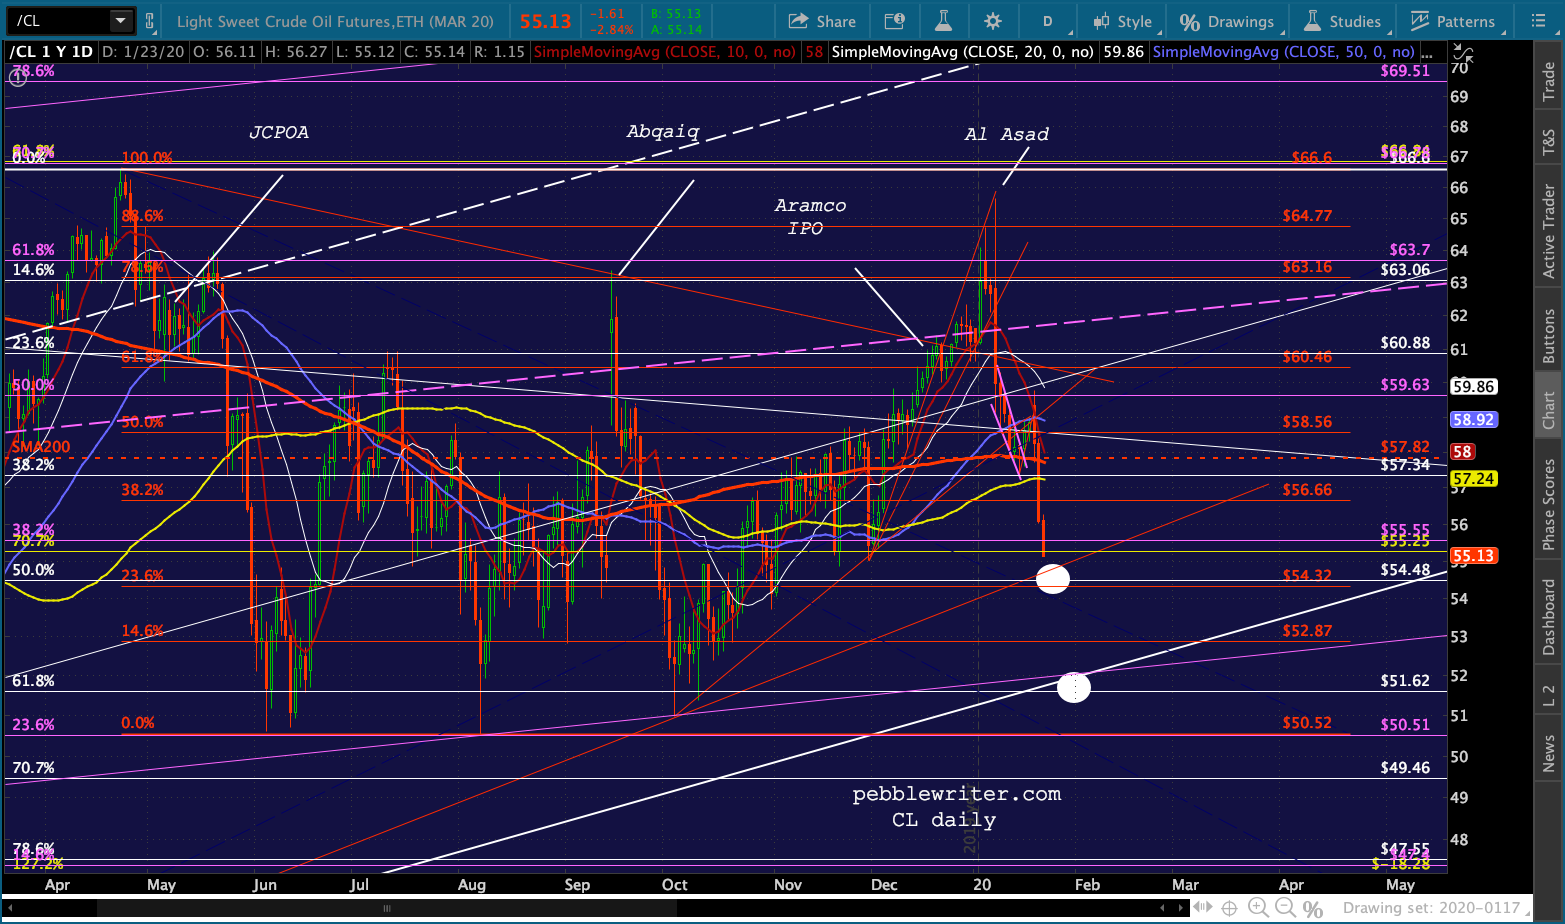
    WTI futures spiked nearly 5% overnight in the wake of a US drone strike on Baghdad Airport which killed Iranian military commander Qasem Soleimani.  It is a dangerous escalation in the US conflict with Iran which broadened when Trump alarmed US allies by pulling out of the Iran nuclear deal last May.

    We argued at the time, as did many, that Trump’s actions put the US on the path to a potential shooting war. The assassination of Soleimani clearly amplifies the risks. So far, oil prices have pushed only slightly above the levels reached after the nuclear deal pullout and the Saudi Aramco plant was attacked in September.  But, this is obviously a more serious geopolitical development. From an economic standpoint, a sharp rise in the price of oil further complicates the already thorny inflation problem facing markets – setting up a showdown between Fed hawks and doves in January.

    continued for members(more…)

  • Update on Gold: Jan 2, 2020

    In our Aug 28, 2019 Update on Gold I noted that although GC had just reached our 1560 target, ZN had also reached our 132’100 target.  The picture was further muddled by the fact that DXY and GC had been moving in unison – an unusual occurrence, to say the least.

    ZN’s resistance could put the brakes on, meaning rates would rise and GC would theoretically fall.  But…I expect ZN’s pullback to be modest — possibly only 3-4% — suggesting GC’s pullback would also be fairly modest.

    As it turned out, GC and ZN both reversed.  Although DXY made a half-hearted effort to break out, it was limited to 1.5% and GC’s reversal was limited to 1446.

    DXY’s rally stopped making any sense at all once FOMC members began hinting at additional rate cuts. When the Fed resumed QE (QE-not as we like to call it), the market knew what to do: DXY has been steadily selling off and GC has climbed back to within $30 of its August highs.

    Does this mean more upside ahead?

    continued for members(more…)

  • And Then?

    With futures up 18 points and the S&P 500 closing 17.37 points below last week’s all-time highs, we should know pretty quickly which way the winds will blow today.  As is often the case, VIX has been driving the algos with shots across the bow as needed — three so far.  It’s enough to establish an obvious trend line which could easily be broken.

    We got the test of the SMA200 we expected on Friday, and the subsequent very precise test of the red channel bottom from Nov 2017 at 8AM this morning. At this time, however, the key will be whether that little red TL from the overnight lows can hold.

    continued for members(more…)

  • Taking a Breather?

    When Phase One was announced, stocks established a new steeply rising channel that aimed straight to 3300. When the channel was repeatedly tested, a new, steeper channel was established. Watching Peter Navarro this morning on CNBC, I hear that Phase One is really, truly, definitely, almost, pretty much sort of in the bag.  Or will be soon. The more relevant factoid is that the end of the year is finally here.

    The algos, having produced some pretty impressive numbers, can take a breather. From the looks of VIX, USDJPY and CL, they will.The question is: Might it turn into more than that?

    continued for members(more…)

  • The Most Important Chart

    One of the more interesting price cycles I’ve worked on over the years is that of oil. Oil and gas have proven to be lucrative trading vehicles, and their price movements have been extremely helpful in forecasting interest rates, currencies and inflation.

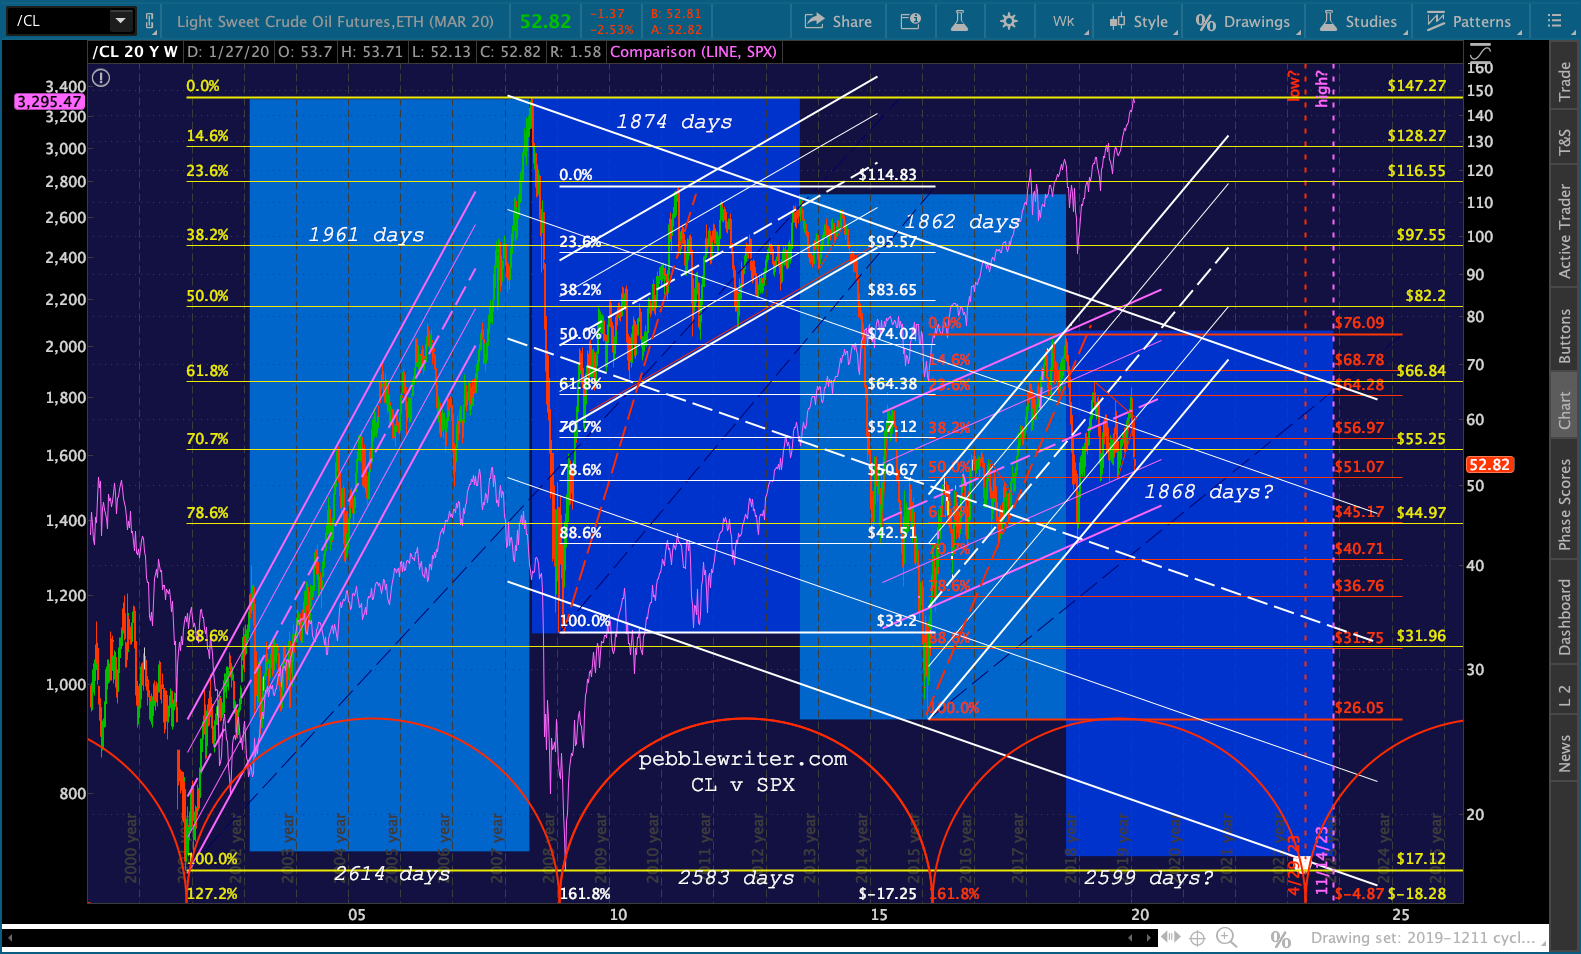
    The most fascinating cycle I’ve discovered is the periodic peaks and crashes in WTI.  The chart below shows that important highs (highlighted) have occurred like clockwork.

    2003 – 2008:    1961 days
    2008 – 2013:    1874 days
    2013 – 2018:    1862 days

    The last three important lows have been just as consistent and illustrate the on-again, off-again correlation between oil prices and equities. [The strong, positive correlation was marred by a significant divergence between June 2014 – Mar 2015.]

    The chart begs some very important questions: will the cycle continue and, if so, will equities follow suit?

    2001 – 2009:    2614 days
    2009 – 2016:    2583 days
    2016 –  ???

    In my opinion, this is the most important chart to watch over the next year or two.

    continued for members(more…)

  • Merry Christmas

    Wishing everyone a very, Merry Christmas and a New Year of peace and prosperity.

  • Do You Hear What I Hear?

    The fourth of December’s five gasoline price readings hit EIA’s website yesterday. The average stands at 2.47, 9.1% above 2018’s December reading.  Unless another large component of CPI takes a nosedive this month, CPI could top 2.3 or even 2.5%.  This is a level not seen since Oct 2018 (the shaded area below) when the 10Y averaged 3.15%.  It’s currently at 1.95%, so something is clearly out of sync.The Fed has been saying they’re going to allow inflation to run a little hot.  And, it has, with Core CPI running 2.3-2.4% since August. The 10Y has responded, rallying from 1.43% in September to its current 1.95%.

    All year long, YoY declines in oil and gas prices have kept headline CPI below 2%.  It finally crept above 2% in November.  December will represent a very substantial departure, with a YoY increase adding to rather than throttling back Core CPI.  Is the bond market ready?  Are investors listening?

    continued for members(more…)

  • Anyone Home?

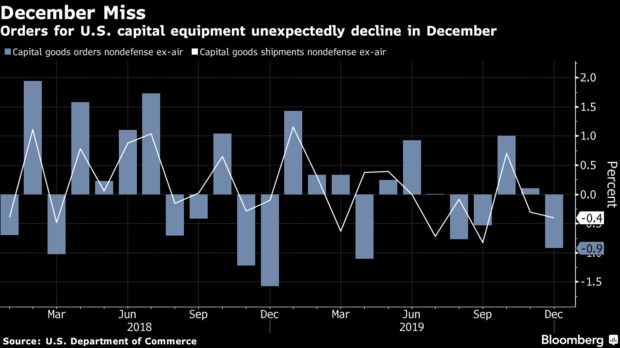
    Traders have disappeared from sight this morning.  Volume is about as low as it could be, despite a big miss (which didn’t even make the front page of CNBC.com) in Durable Goods new orders: -2.0% vs +1.2% expected.  YoY, the drop was 5.7%, the worst since Jul 2016.

    Futures plunged all of 4 points which, of course, sent VIX to the rescue with a compensating plunge.

    continued for members(more…)

  • Charts I’m Watching: Dec 20, 2019

    One of the market’s favorite tricks is to close right below resistance and blow through it the following morning on the “strength” of the overnight ramp in the futures.  SPX came within 0.67 of our next upside target yesterday, suggesting a potential downturn, but will blow right through it on the open.  This morning’s ramp job is brought to you by VIX which, despite not making lower lows, has timed its daily collapse perfectly.

    The only downside of such maneuvers is that they frequently result in a “pop and drop” – where stocks backfill the newly created gap. It’s a source of irritation to those who bought the open.

    continued for members(more…)

  • Houston, We Have a Problem

    No, I’m not talking about Philly Fed Index, which at 0.3 versus 8.0 expected and 10.4 prior, is really stinking up the joint.

    instead, I’m talking about the 2s10s breakout which, as we’ve discussed countless times in the past, spells serious trouble for equity markets. This is exactly the scenario we discussed earlier this week and is a direct result of the brewing inflation problem which is also not being discussed in polite company.continued for members(more…)