About a month ago SPX/ES pushed to new all-time highs, suggesting stocks were off to the races. I wasn’t convinced. From our April 29 post:
A move above the Sep highs is technically bullish. So, trend followers will be compelled to go/stay long with the former highs as their stop. Personally, I would be extremely cautious in chasing it, keeping an eye out for rejection and shorting it if/when it drops back through 2940.

We labeled the downside targets and waited to see if the rising wedge would break down. Spoilers…it did.
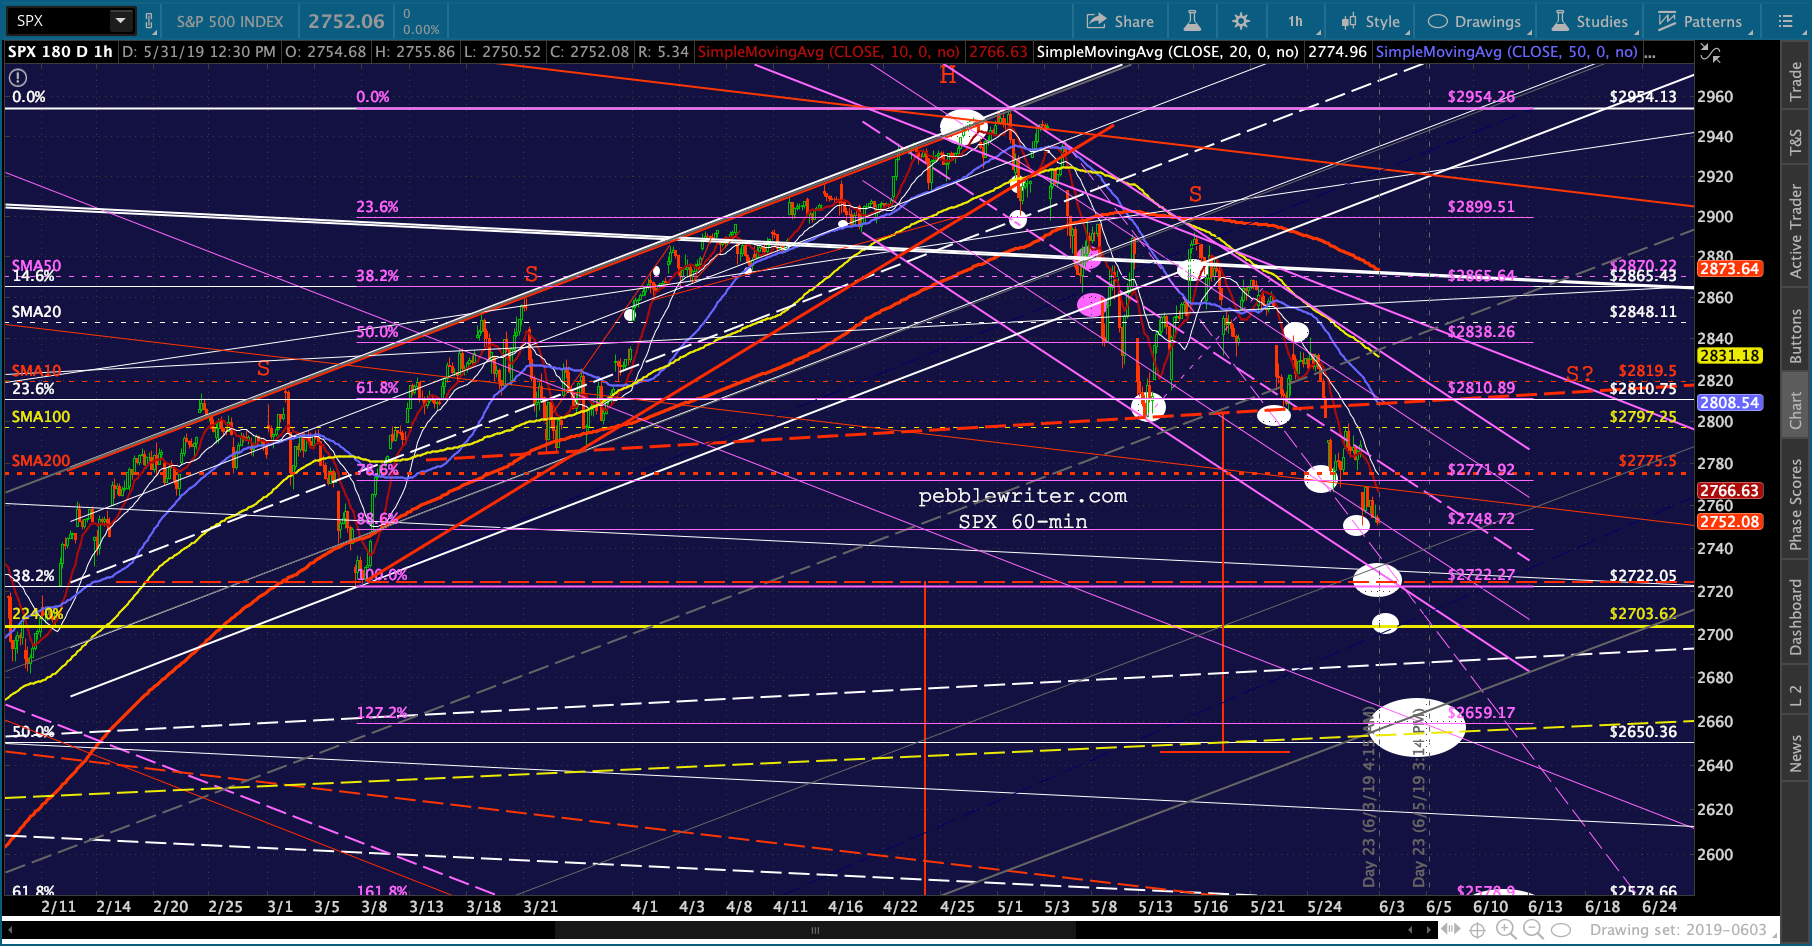
Now, 7.7% later, we’re presented with a new challenge.  ES came within a few points of our 2728 target overnight. Will it get a bounce here or is it susceptible to additional downside?
 According to our bond charts, there’s more pain to come.
continued for members…The SPX version — remember, its 2.24 is way down at 2703.
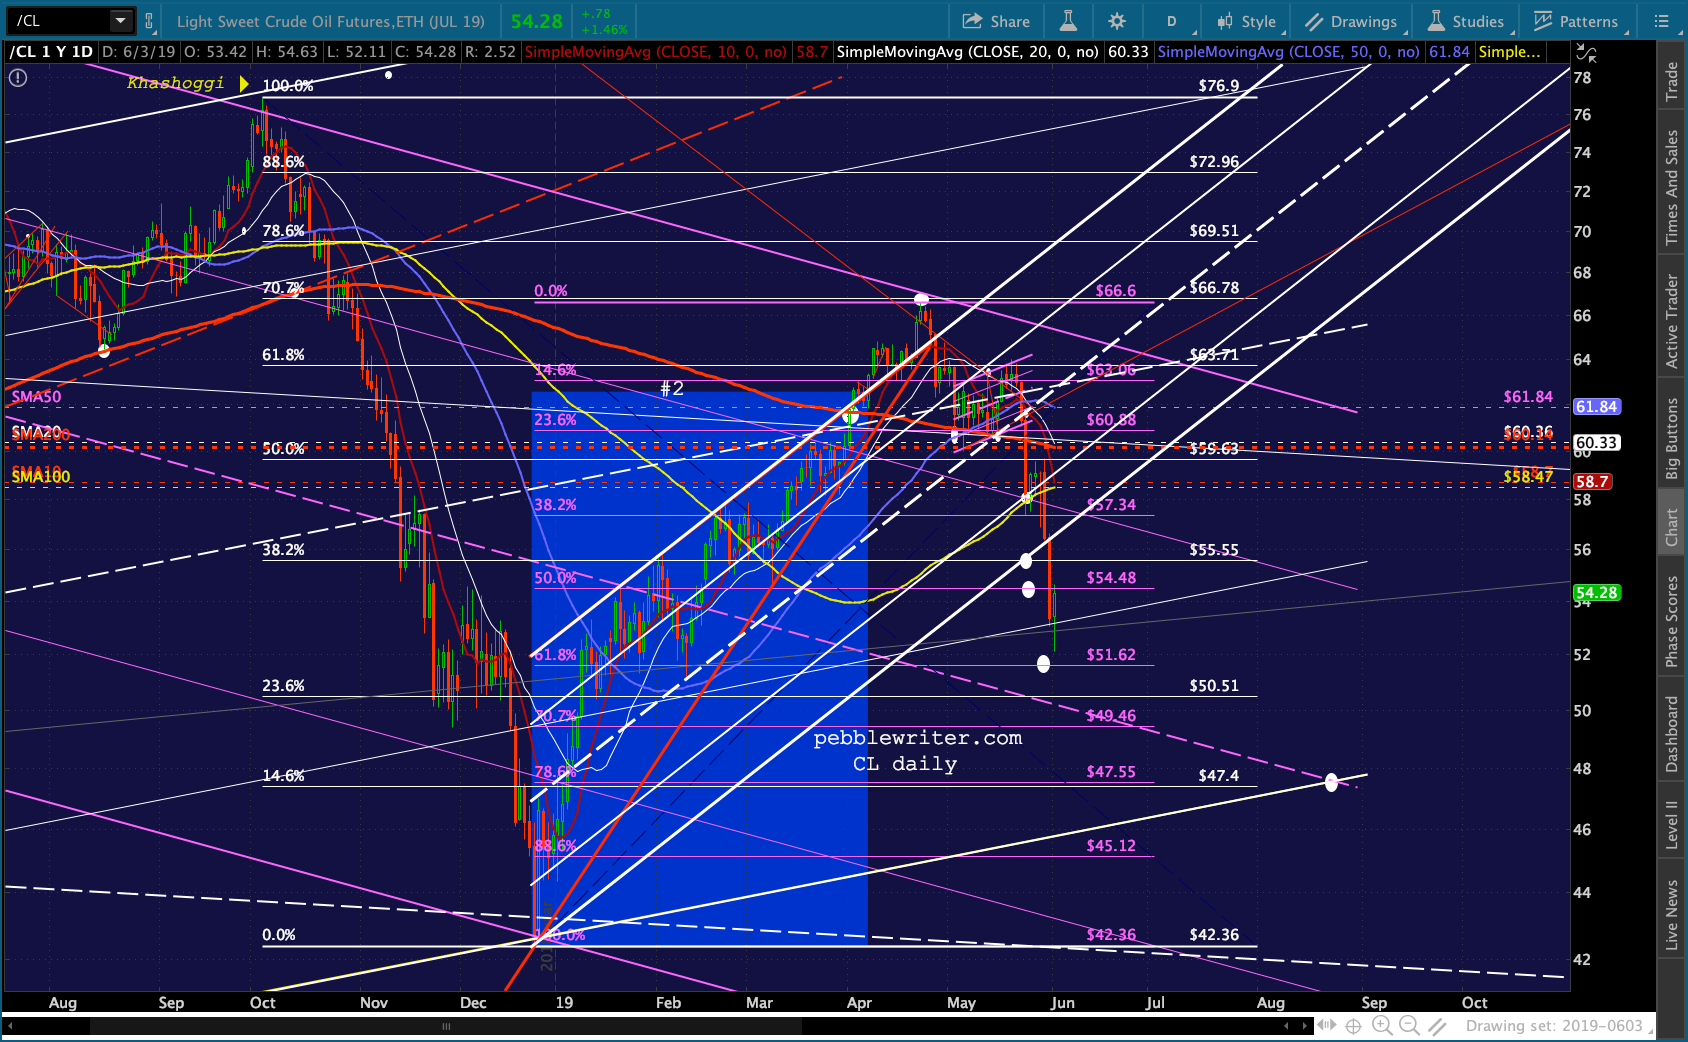
 Our factors are mostly hinting at a nice bounce. RB and CL have a tentative hold on important channel lines: CL on the large purple .236 line…
 …and RB on its rising white channel bottom.
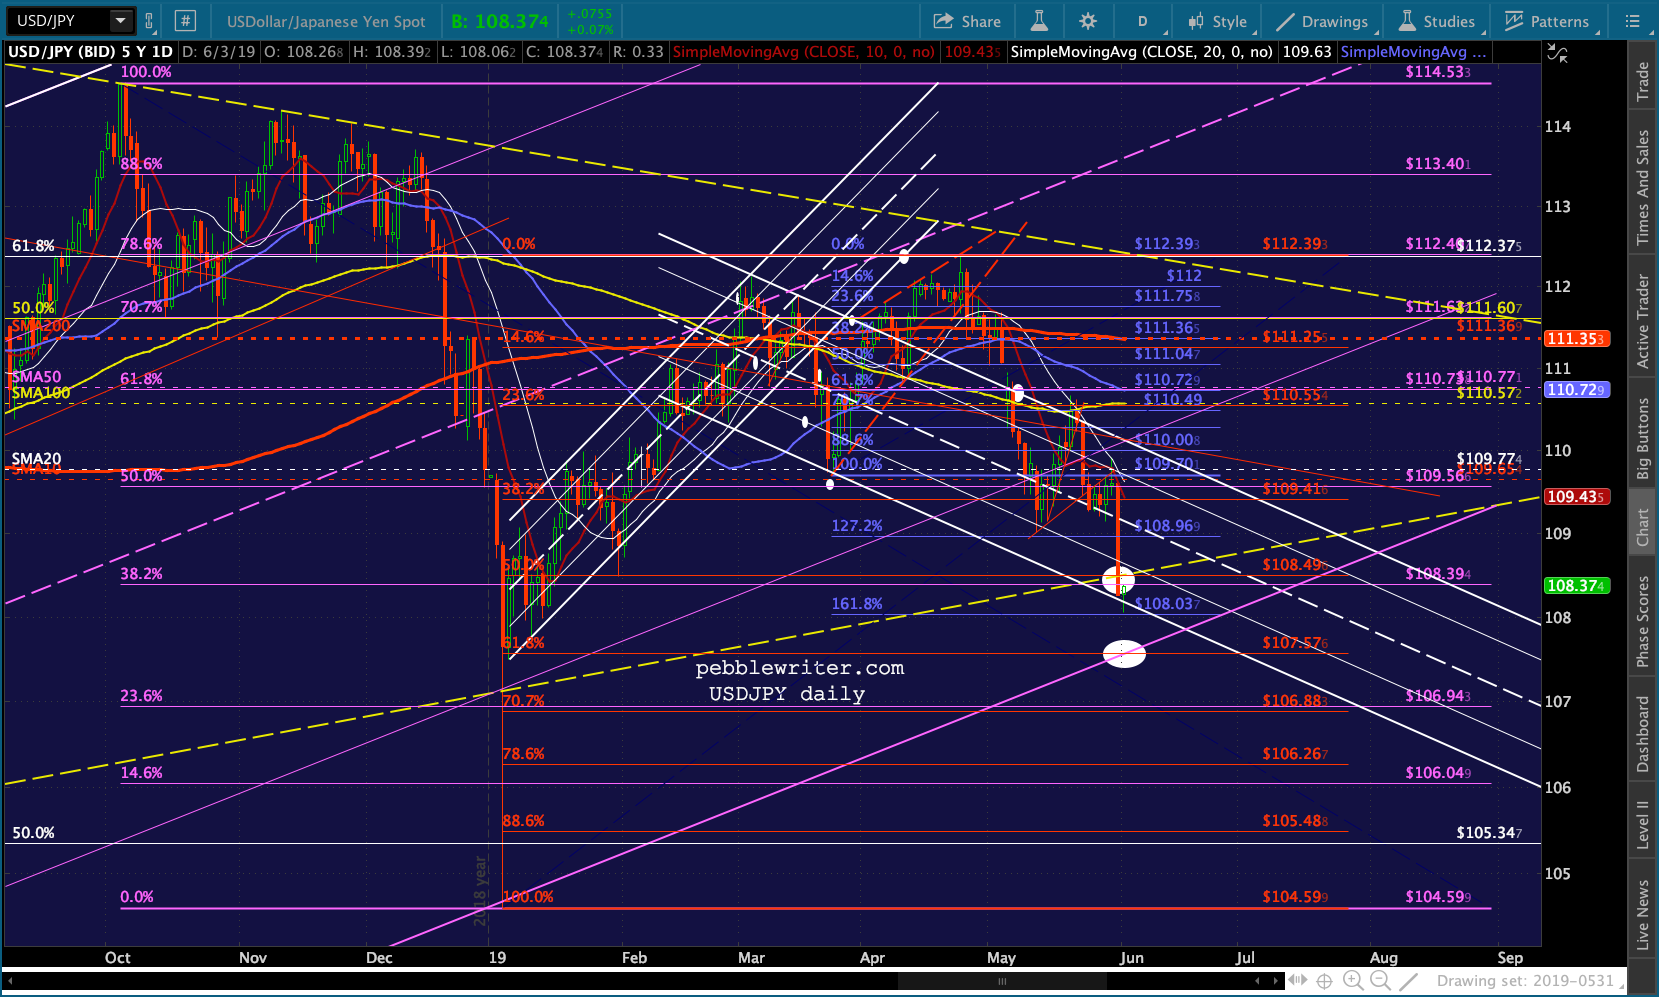
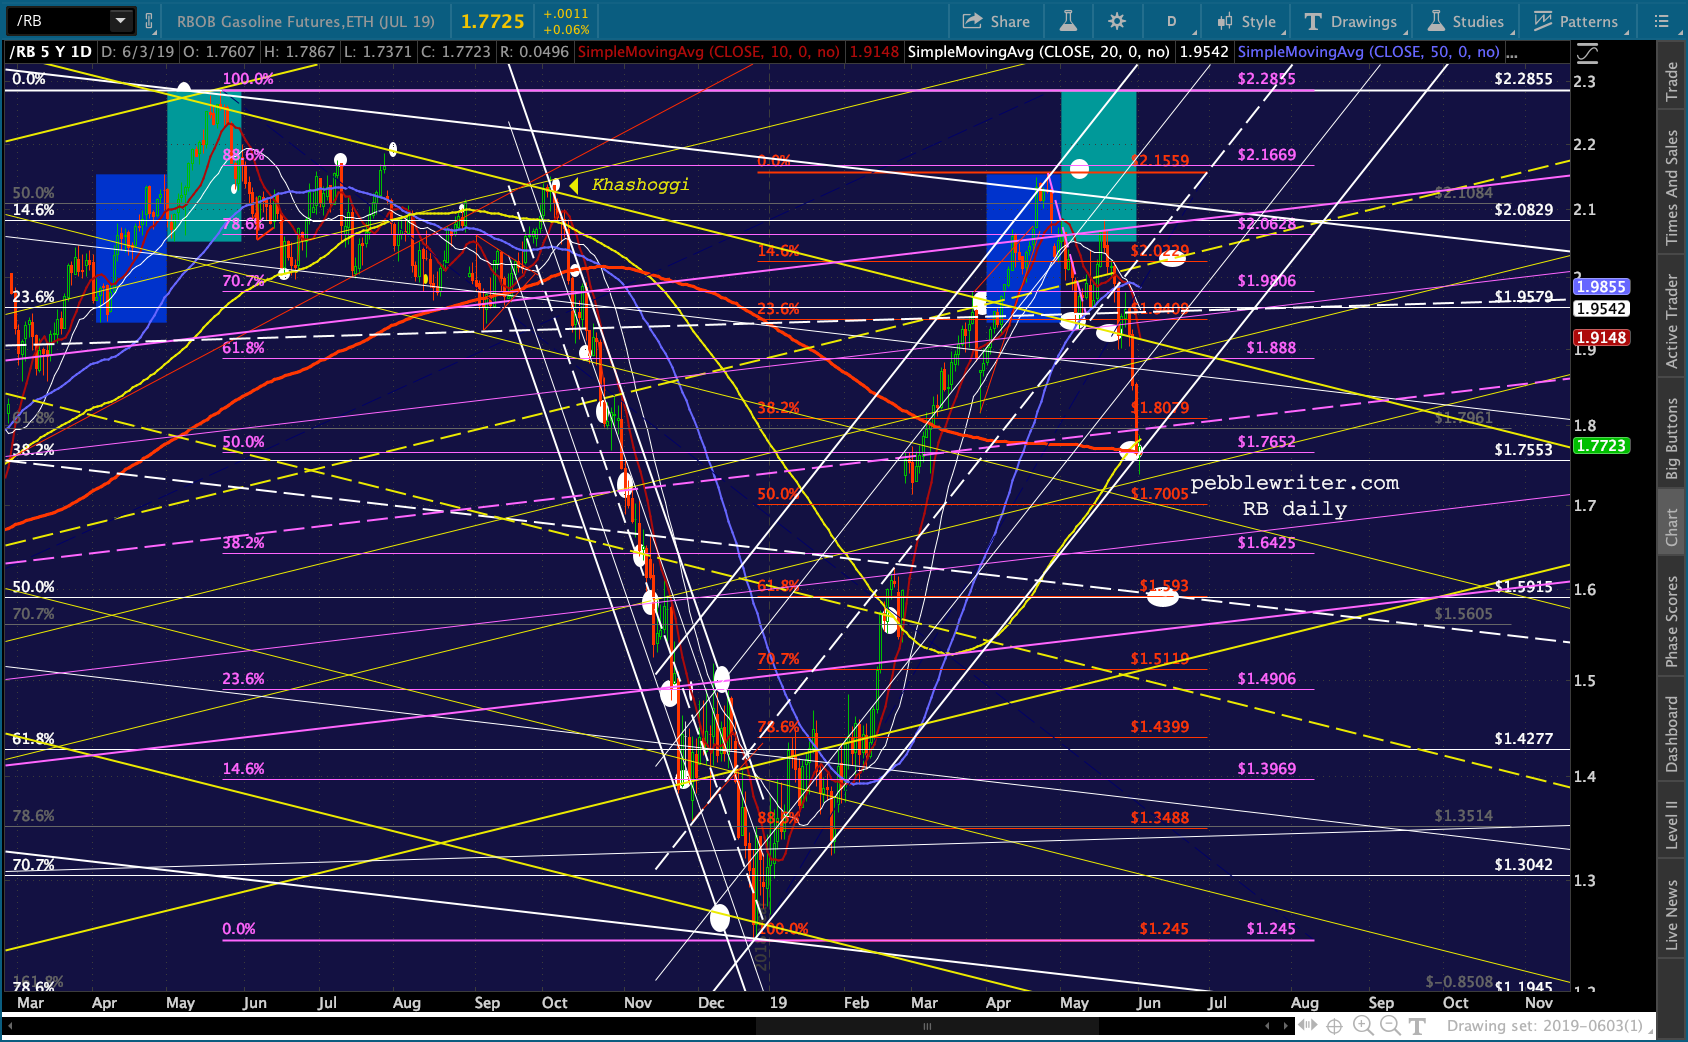 USDJPY is getting a bounce on its falling white channel (a very ugly channel, BTW.)
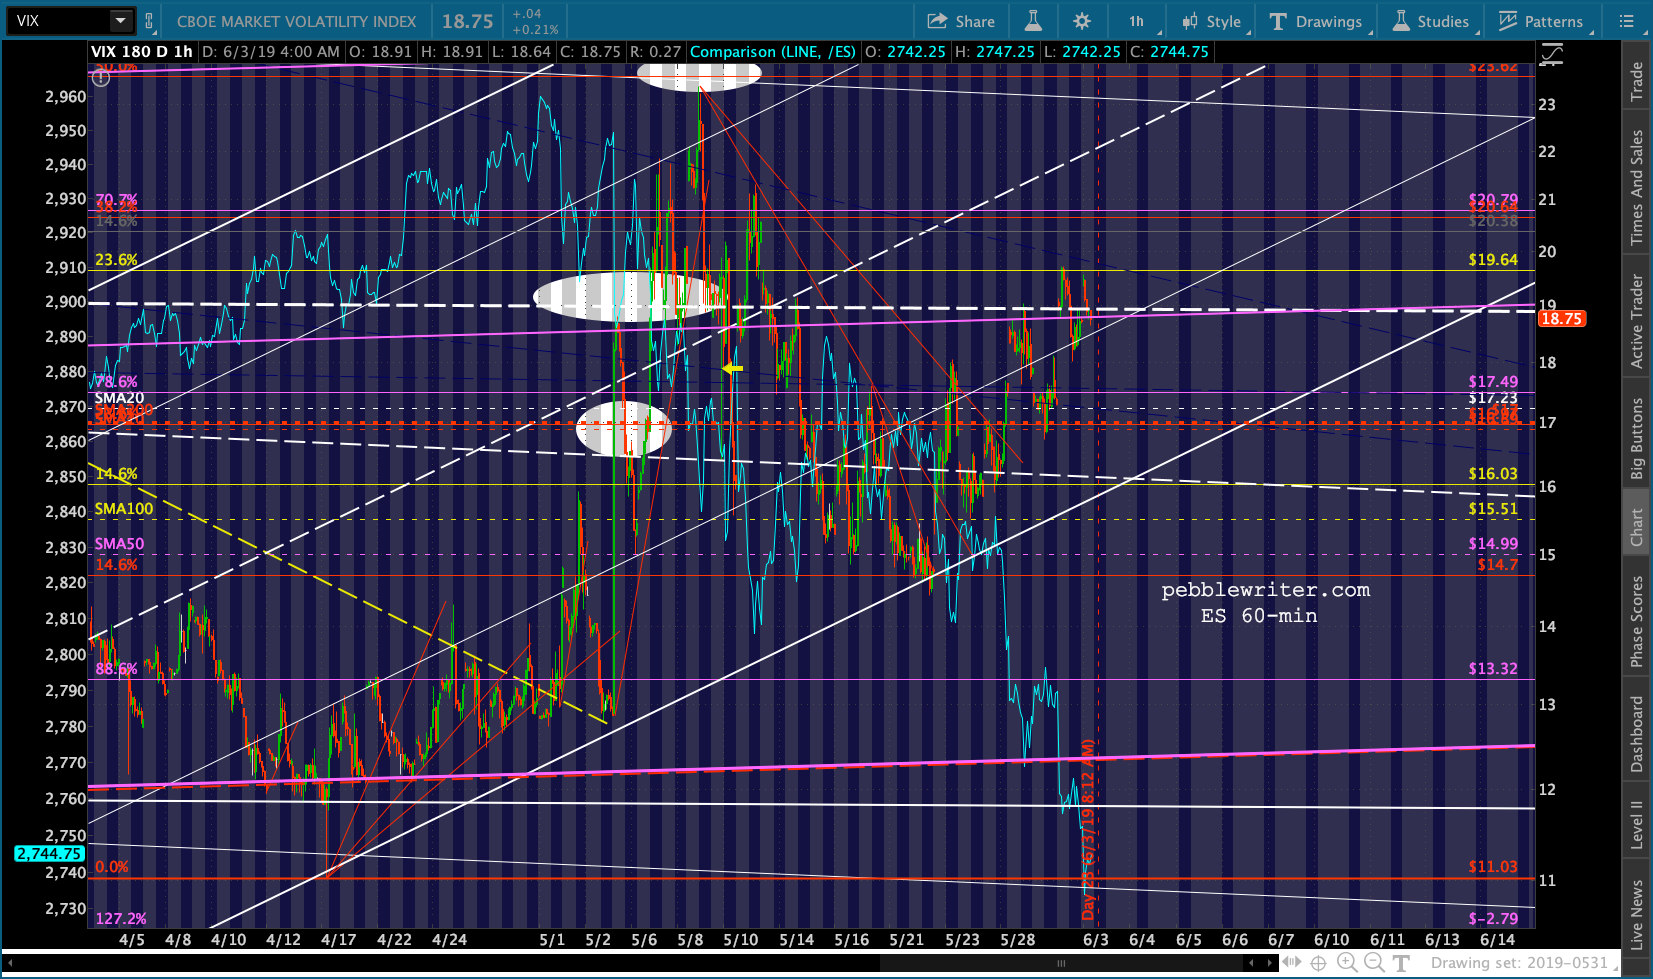
 And, VIX is still ridiculously subdued. It hasn’t even topped its May 9 high, reached when SPX had fallen only about 80 points.
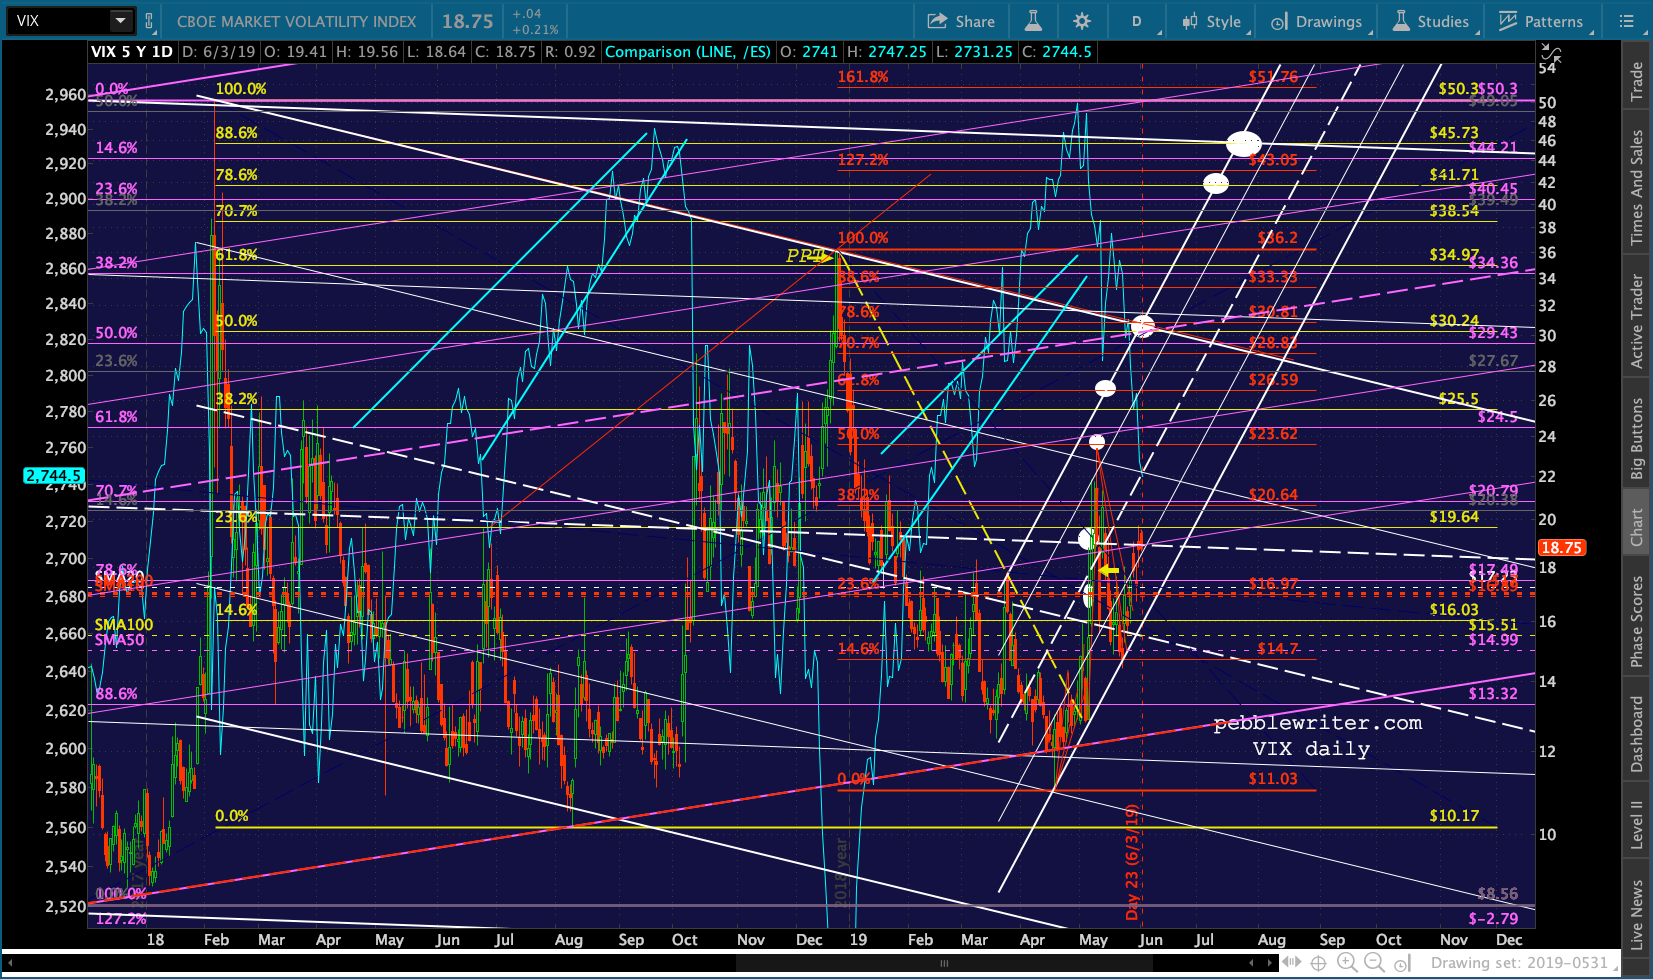
 The 2s10s has had a tremendous bounce — which stocks seem to like, at least initially.
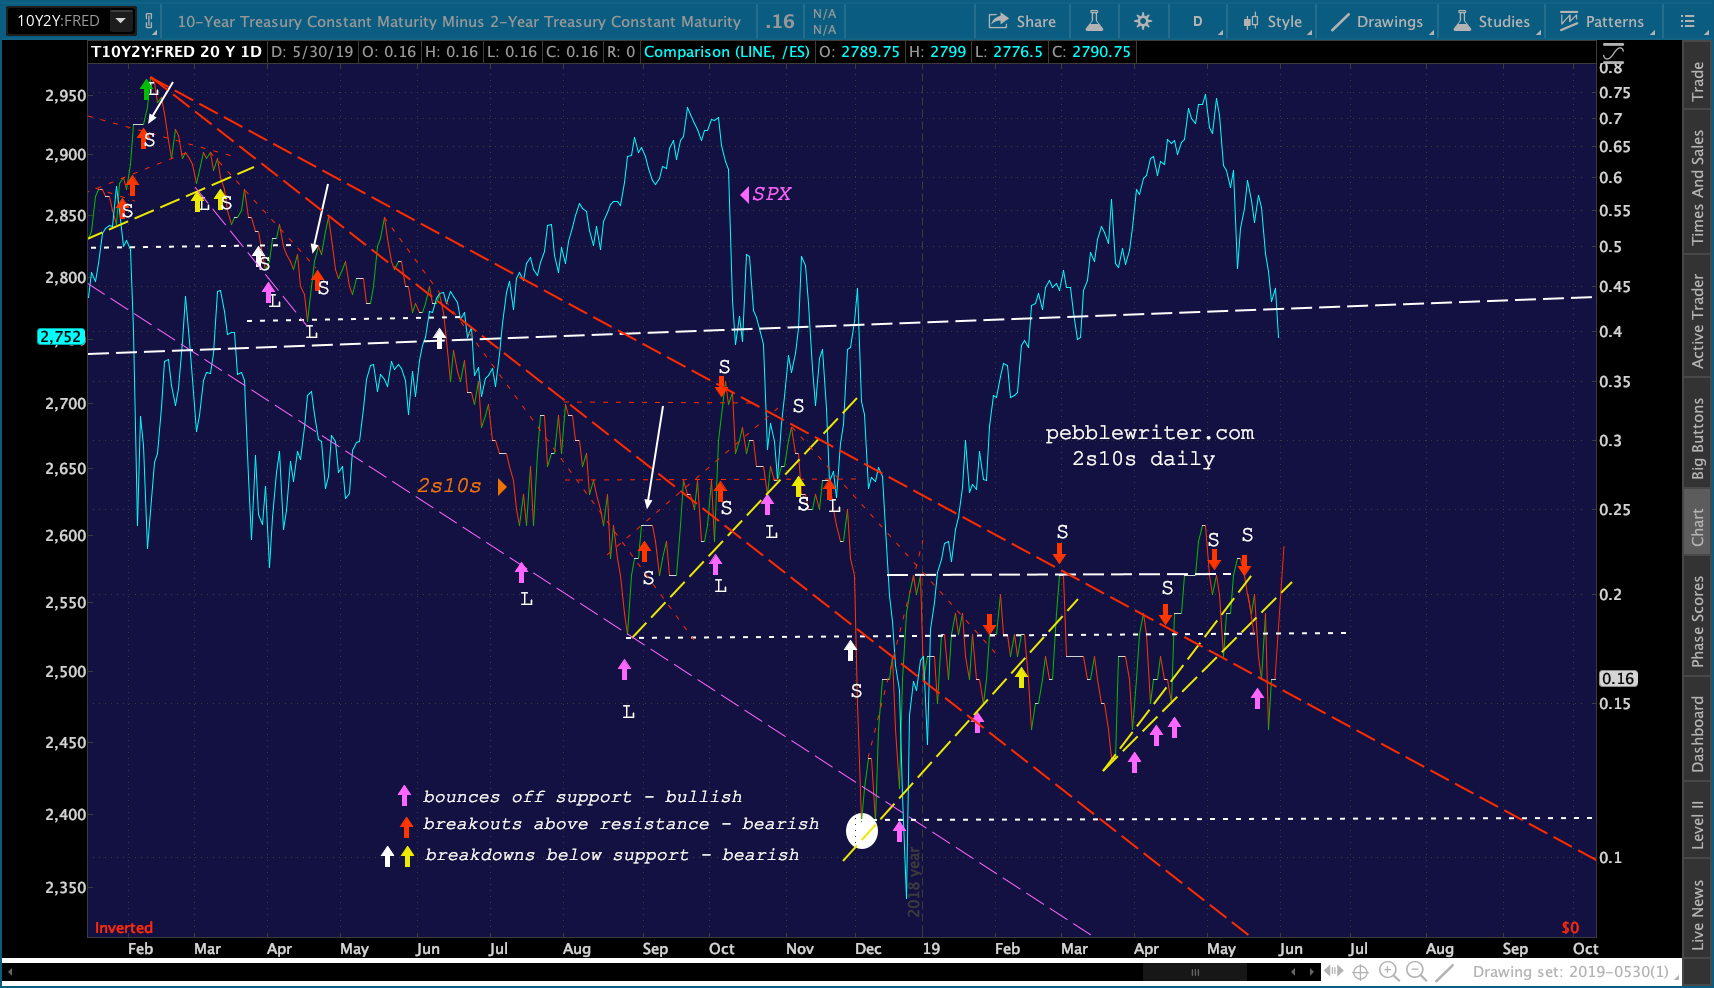 But, there are a number of negatives lurking in the charts — particularly the bond charts. TNX broke down below the purple channel, the .886, and the falling wedge bottom — all very bearish. The purple .618 and double bottom at 20.66 is very important…
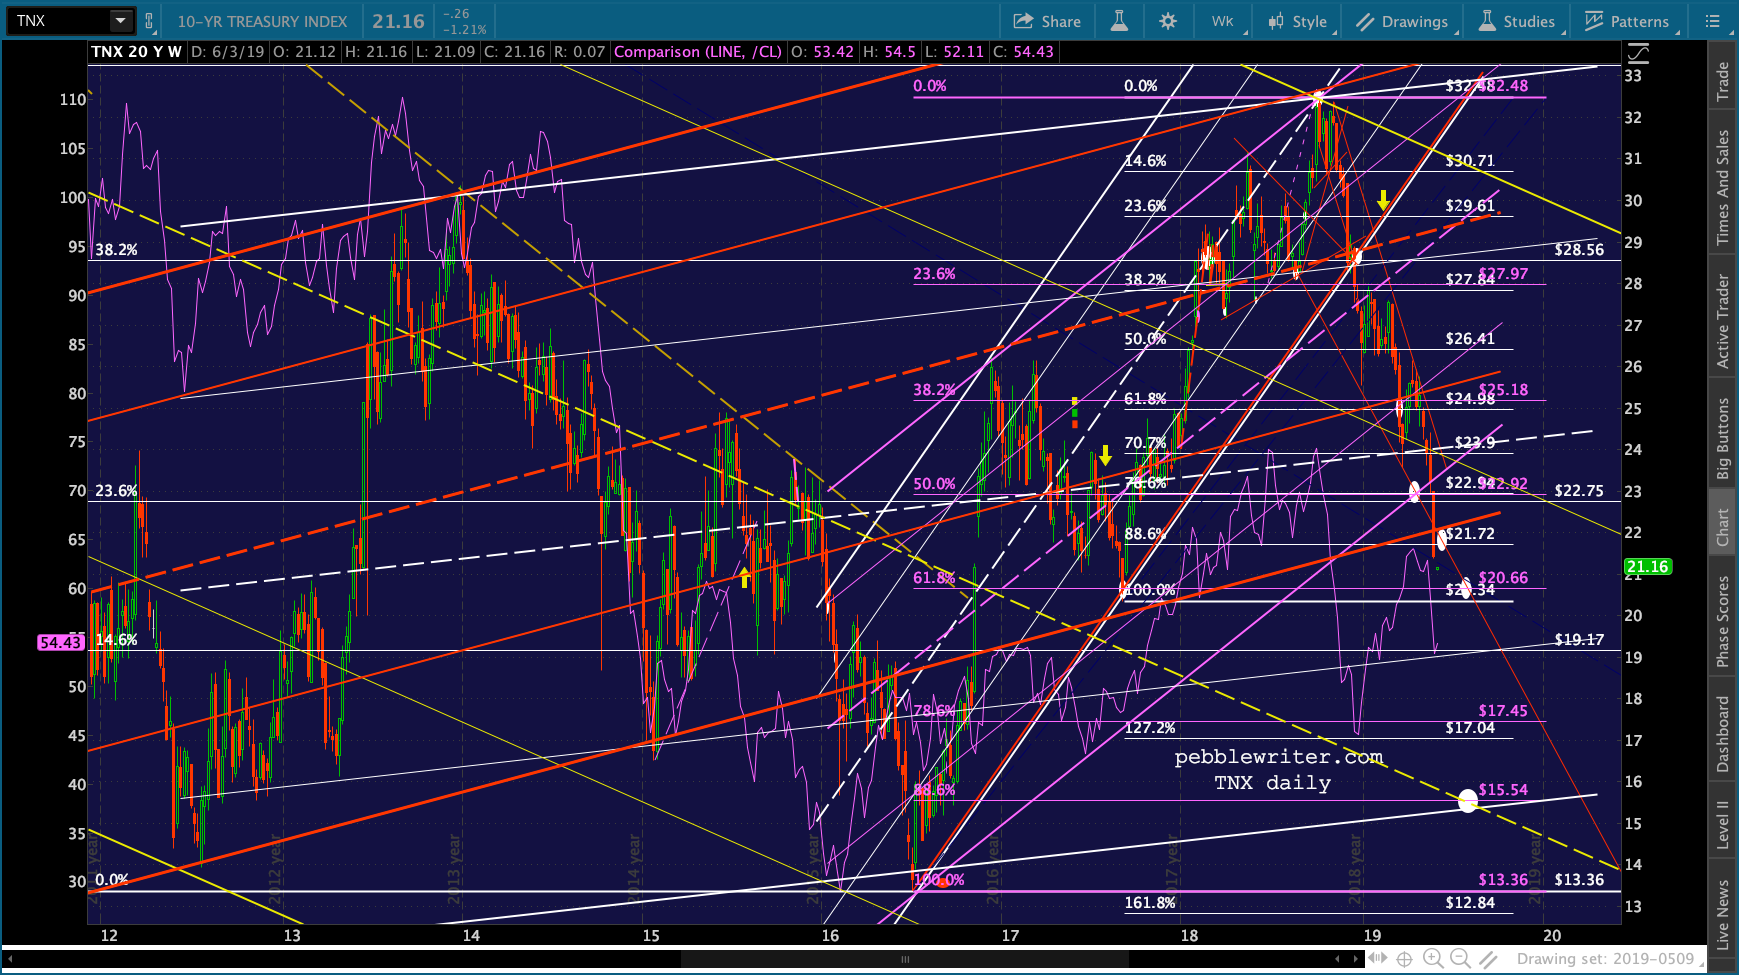
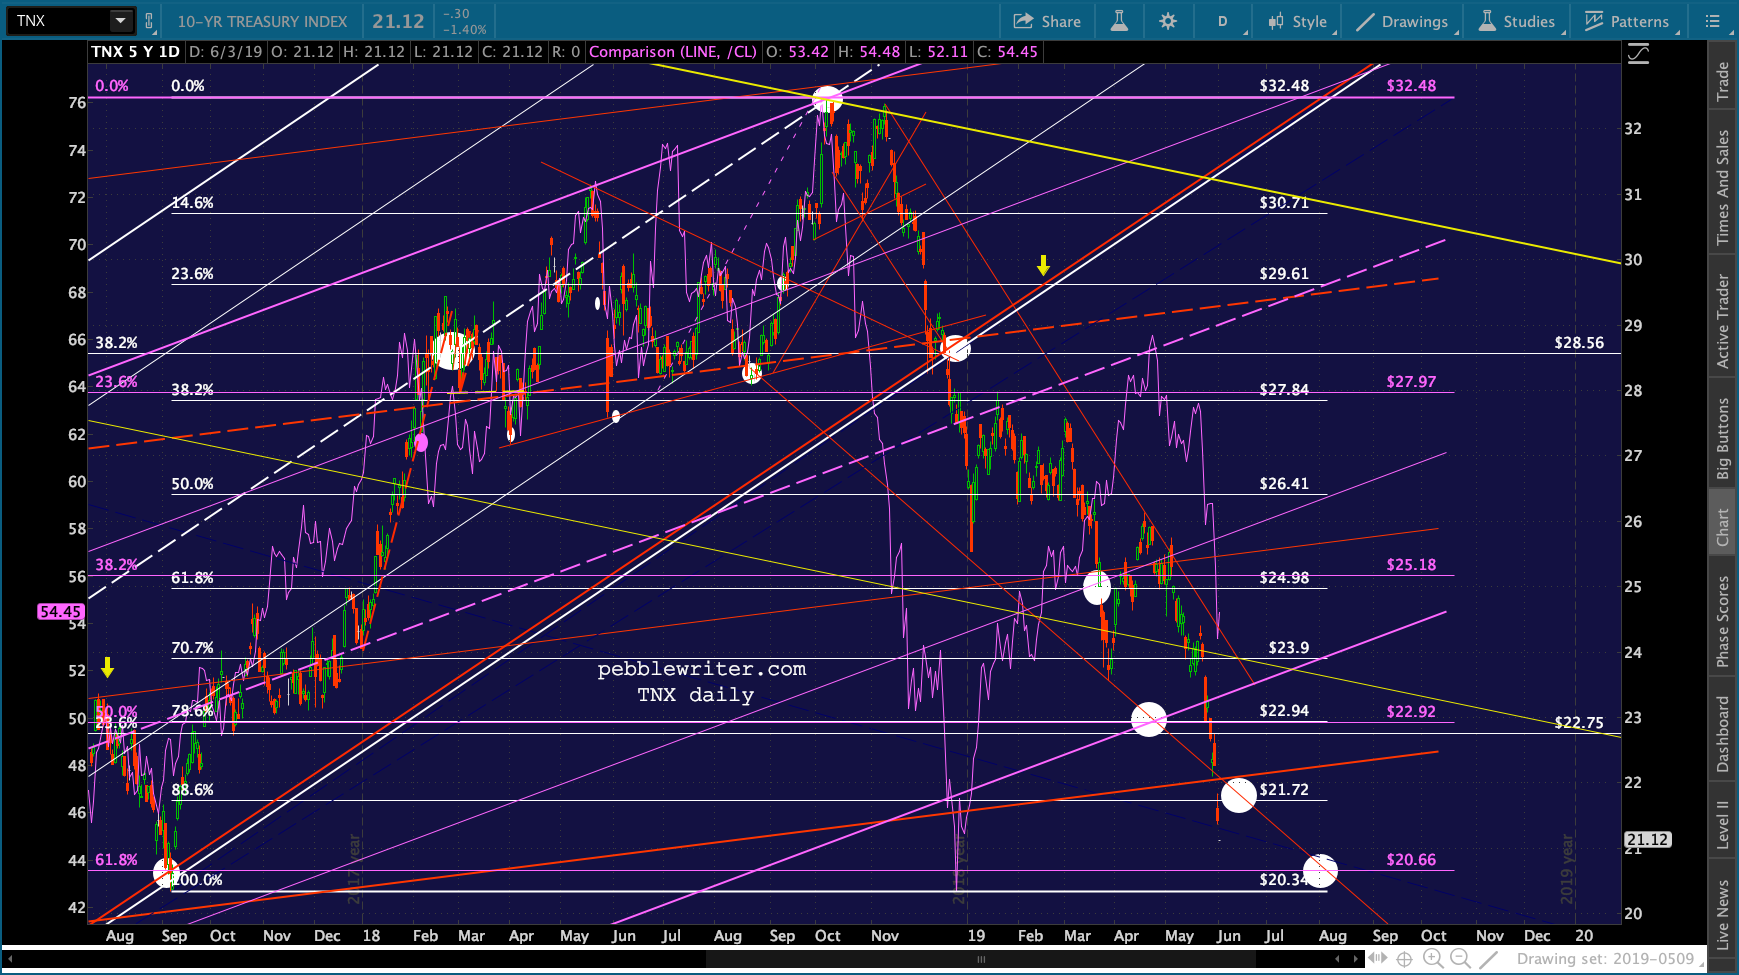 …as can be seen on the weekly chart.
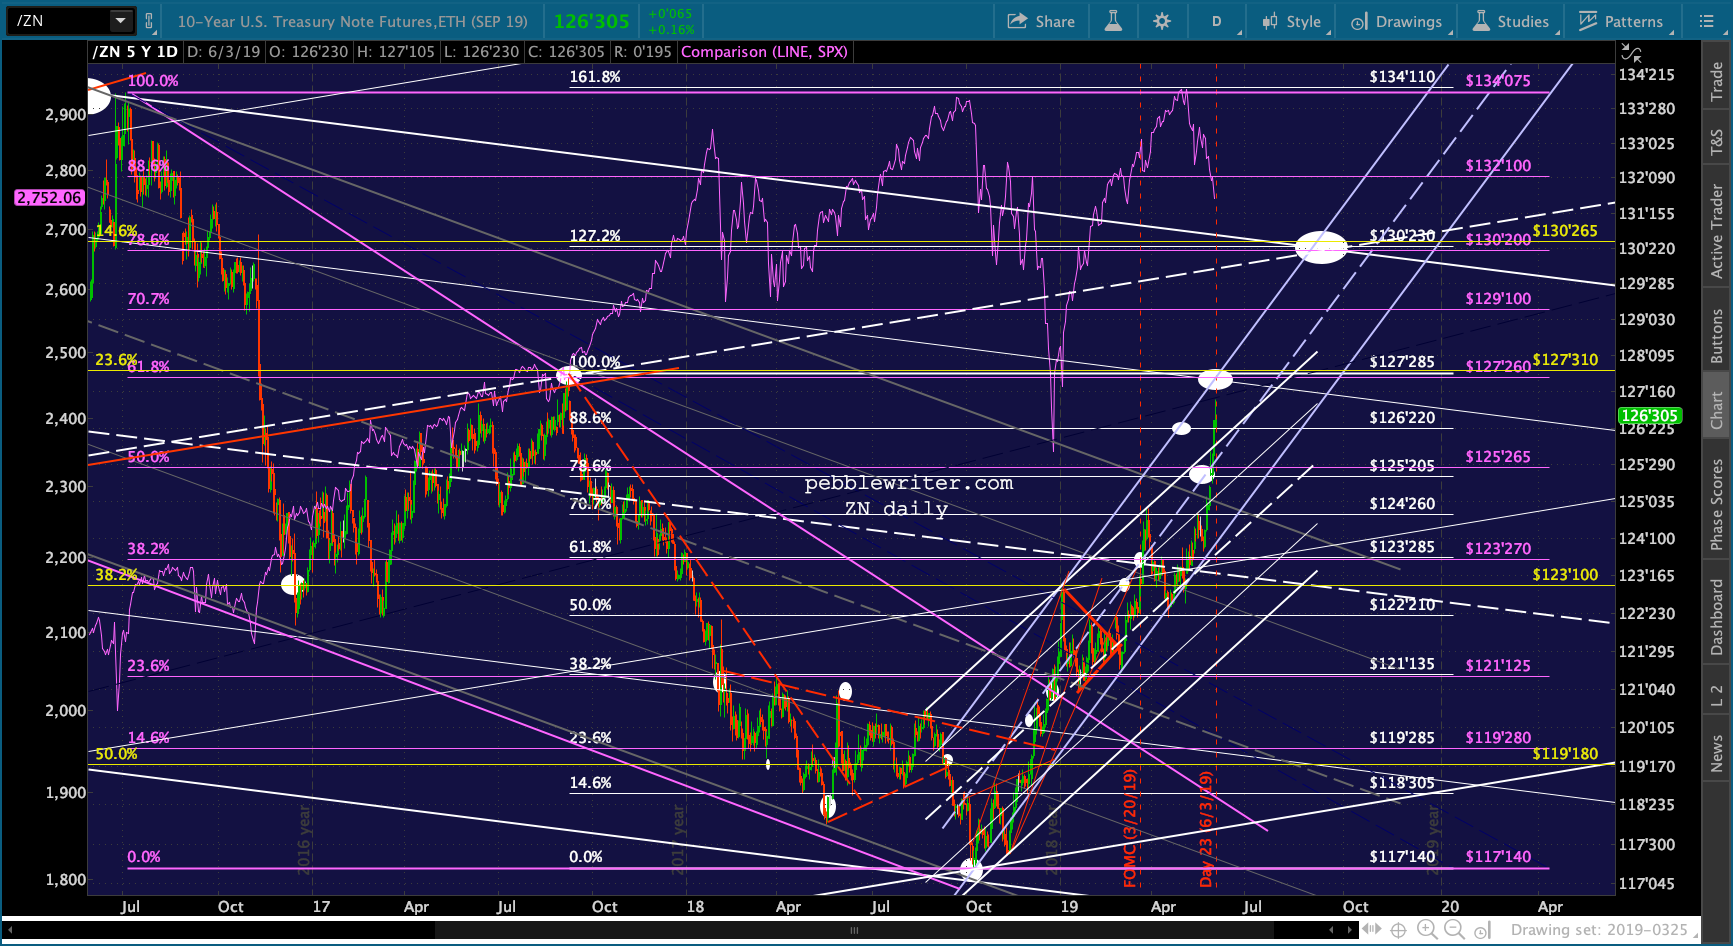
 ZN clearly has more upside potential. If it breaks the purple .618 at 127’260, it has only the former interim high of 127’285 in the way of a spurt to 130’200-130’230 — the 1.272, .786 and white channel top.
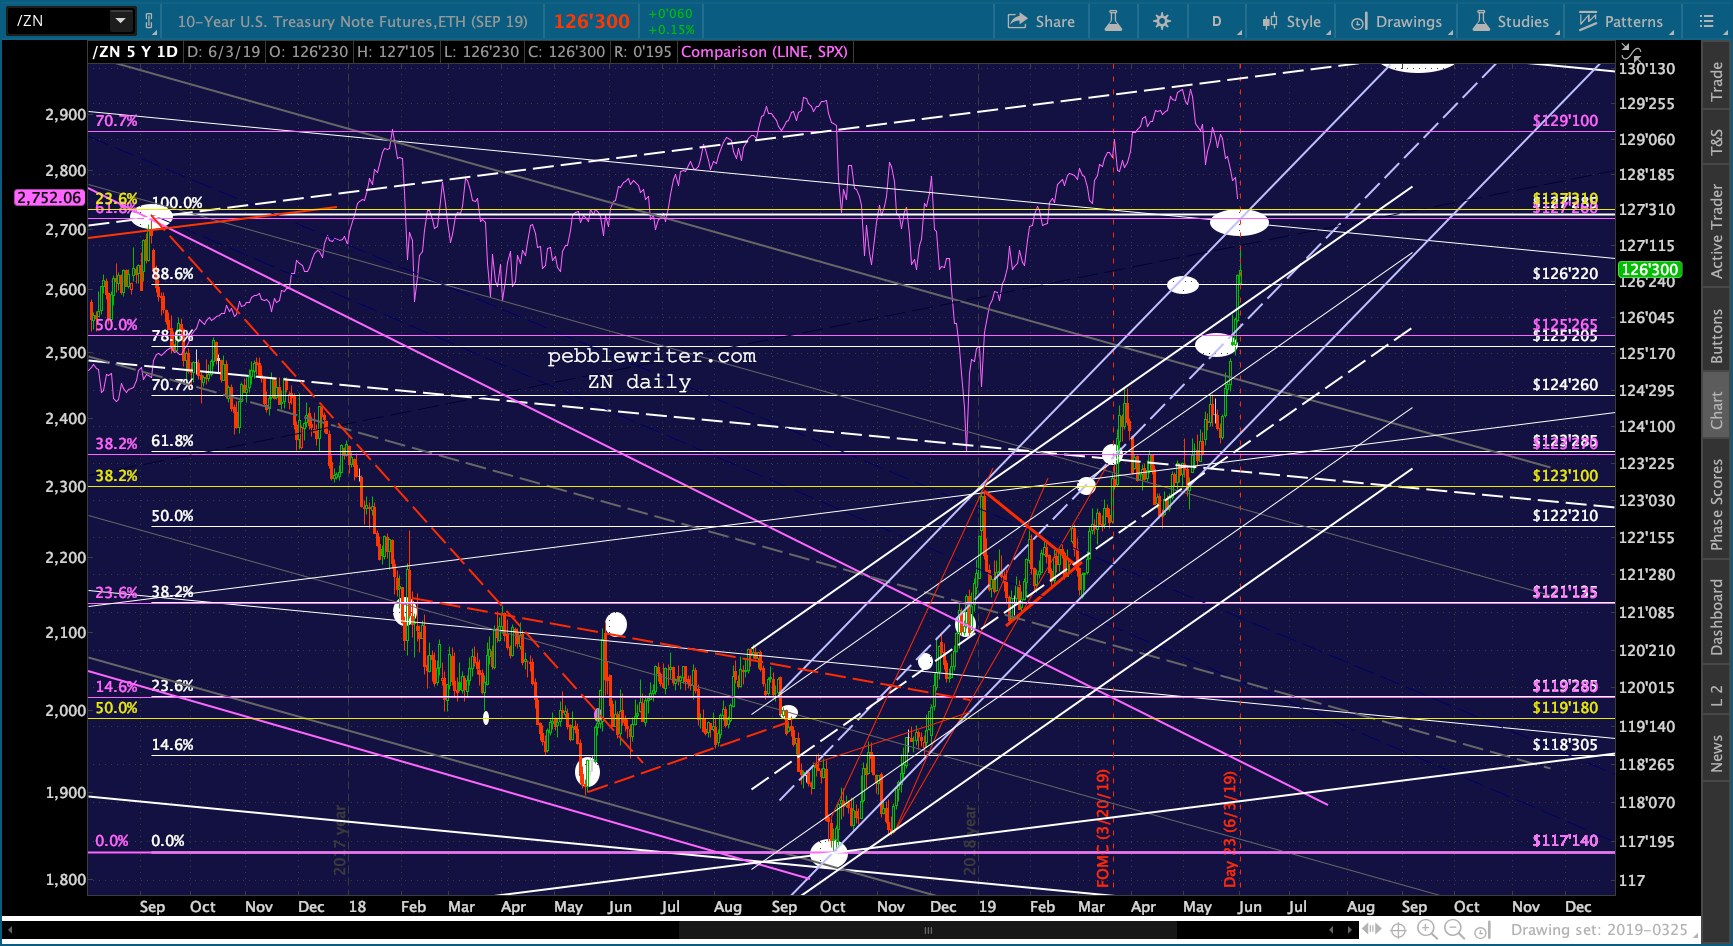
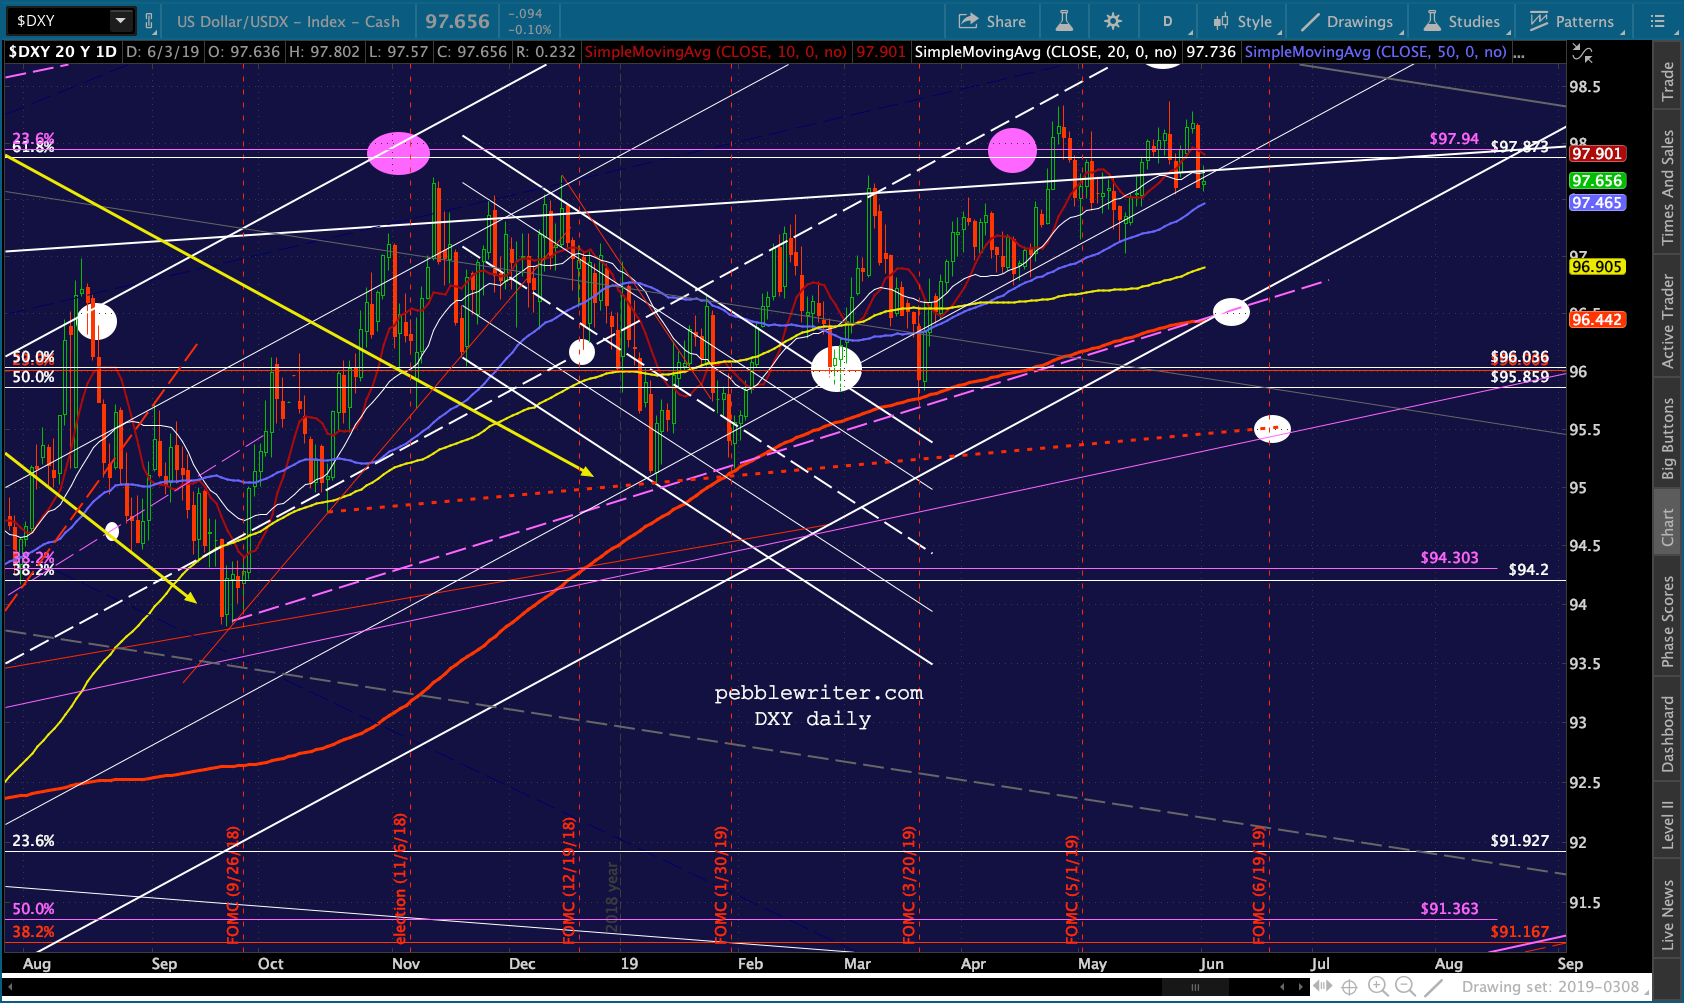
 Other potential downside drivers include DXY, which is (still) setting up for the long-awaited backtest of its rising white channel bottom.
 It’s a move that GC seems to support.
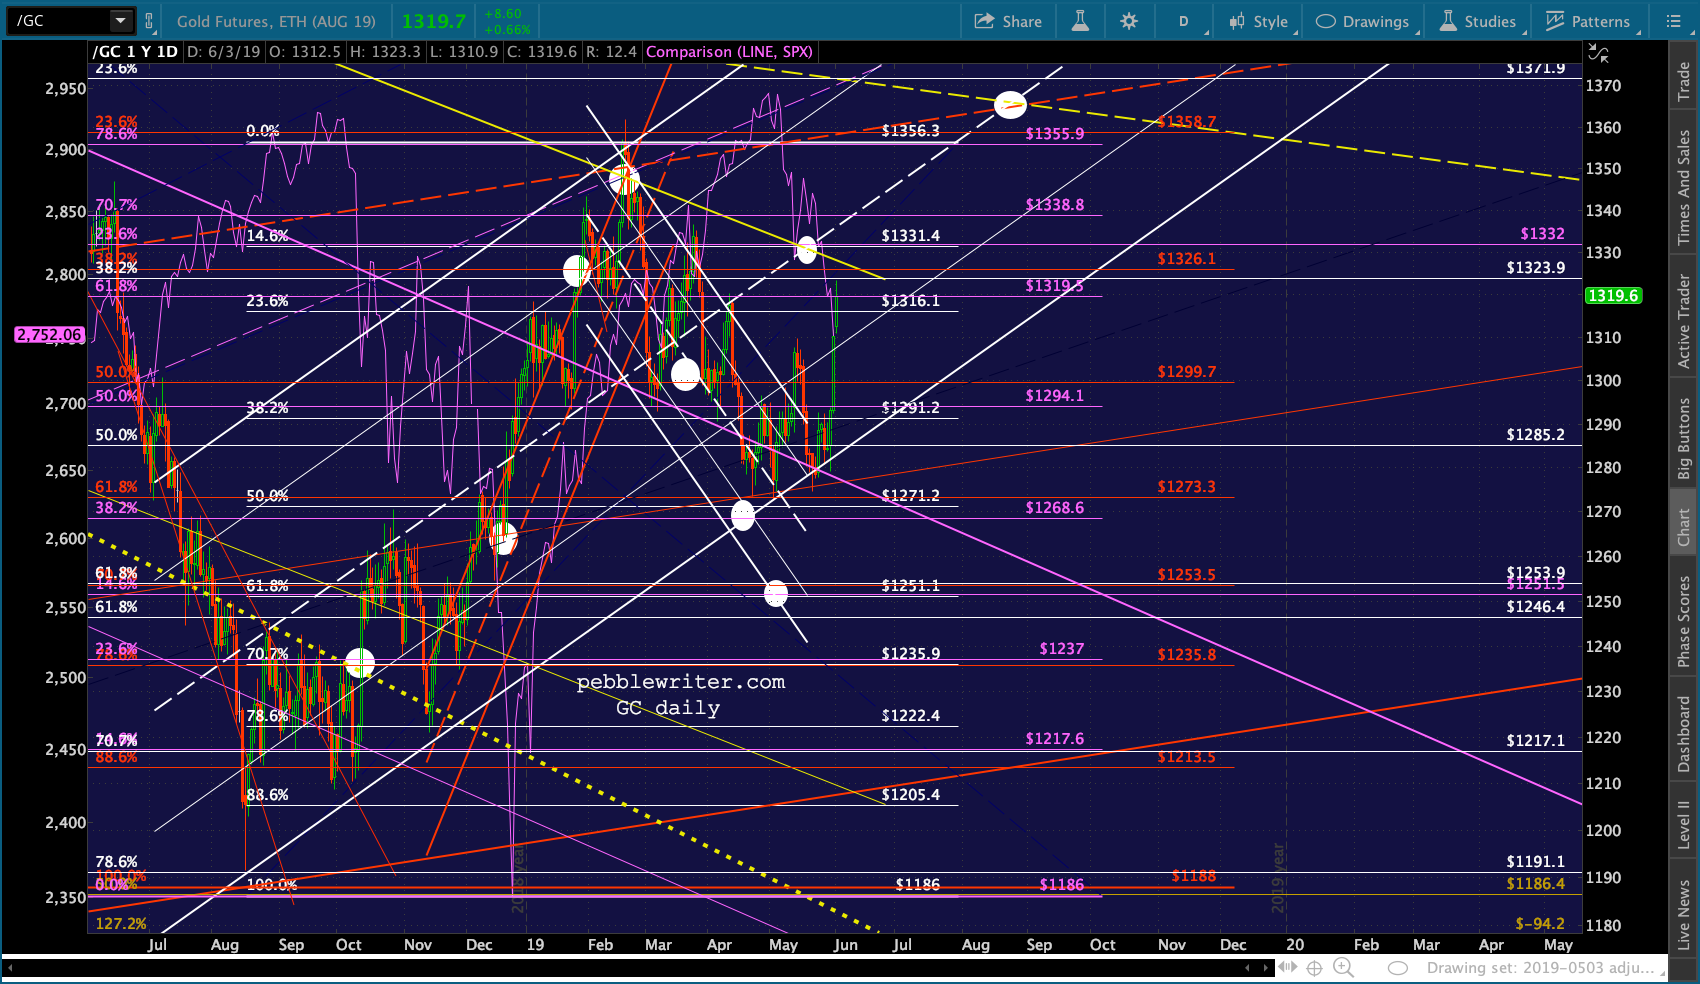 SPX has about 45 points to go to its 2.24 at 2703. That would put ES at about 2700 — well below its own 2.24. A drop through this important support would likely panic the markets — meaning it might take some doing to get it down that low.
ES could easily reach it today, but a day or two delay would allow the falling purple channel to remain intact.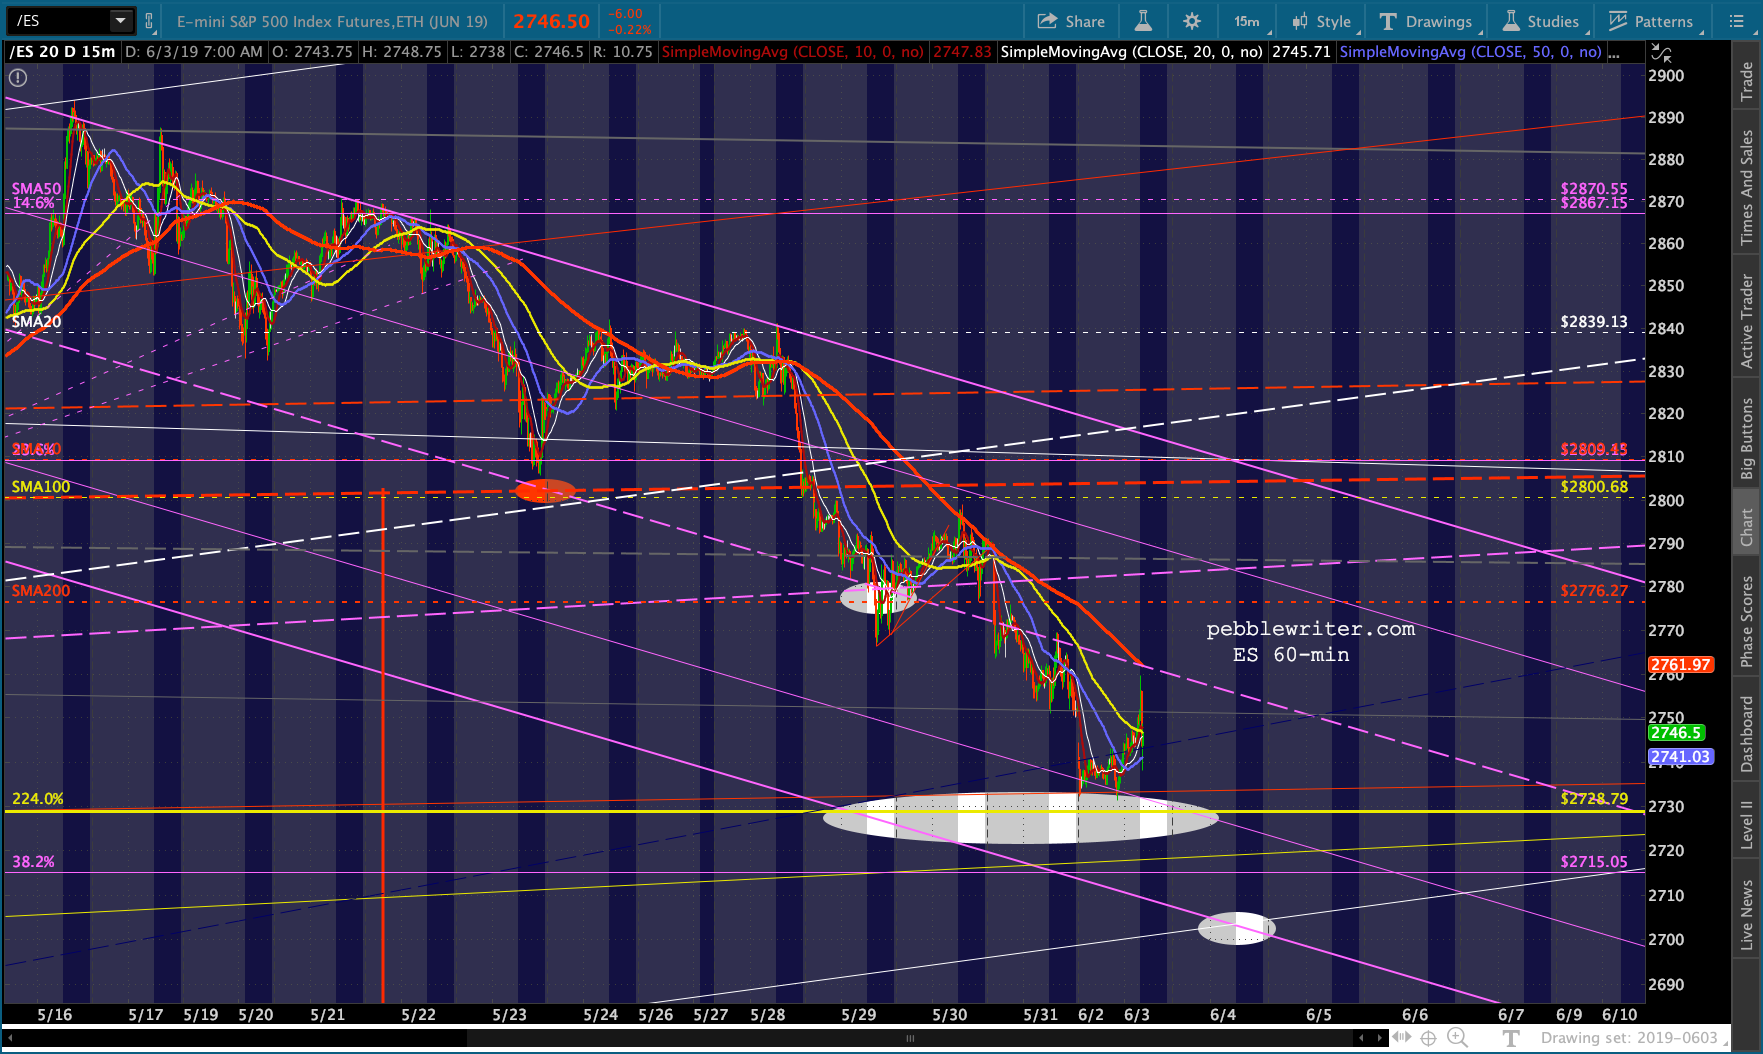 The timing is slightly out of sync with SPX, which would break below its falling purple channel. So, we’ll play it by ear and be prepared for a jolt of some kind.
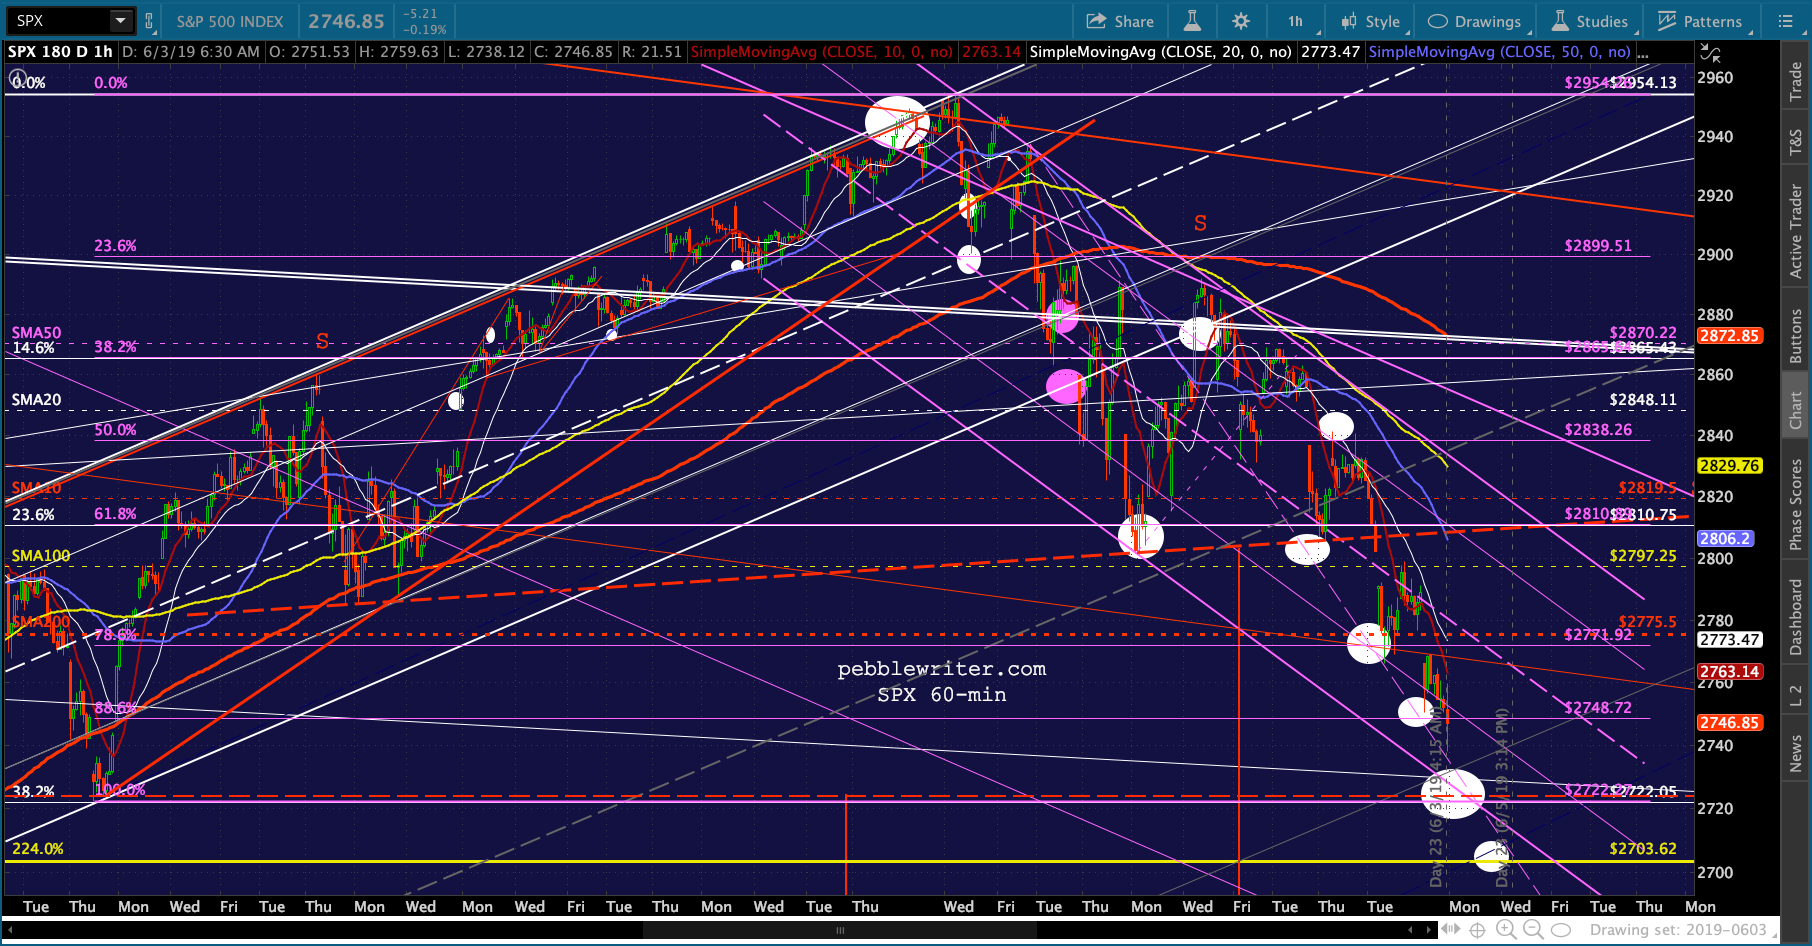 Aside from VIX popping, what could drive such a move? I’d like to see RB’s white channel break down, resulting in a drop to the falling white channel midline and .618 at 1.593. We’re already looking at a big YoY drop in gas prices, which should depress May CPI quite a bit. It should continue to drive interest rates lower — with or without the Fed’s help.
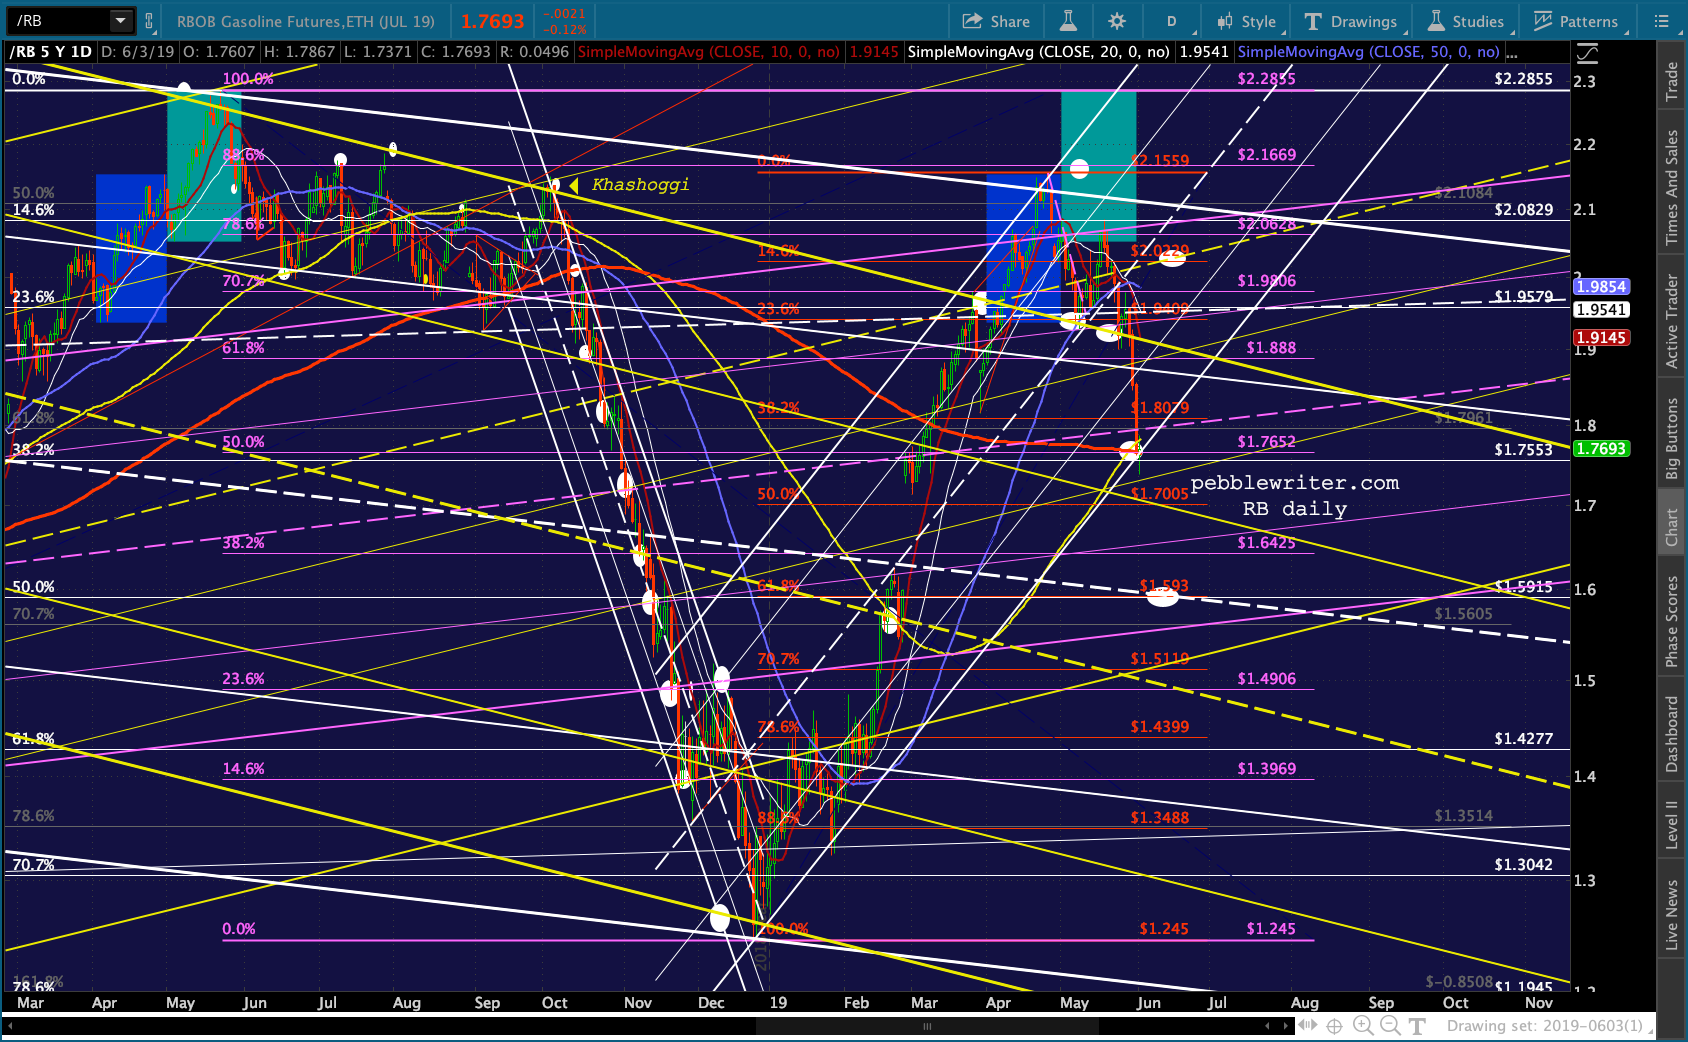 CL’s rising white channel has obviously broken down. Since it didn’t quite reach its .618, we could see another ugly plunge — even intraday — reaching 51.62.
 The USDJPY chart is perhaps the most interesting. The yellow triangle is at risk, with the purple channel bottom just below at 107.576.
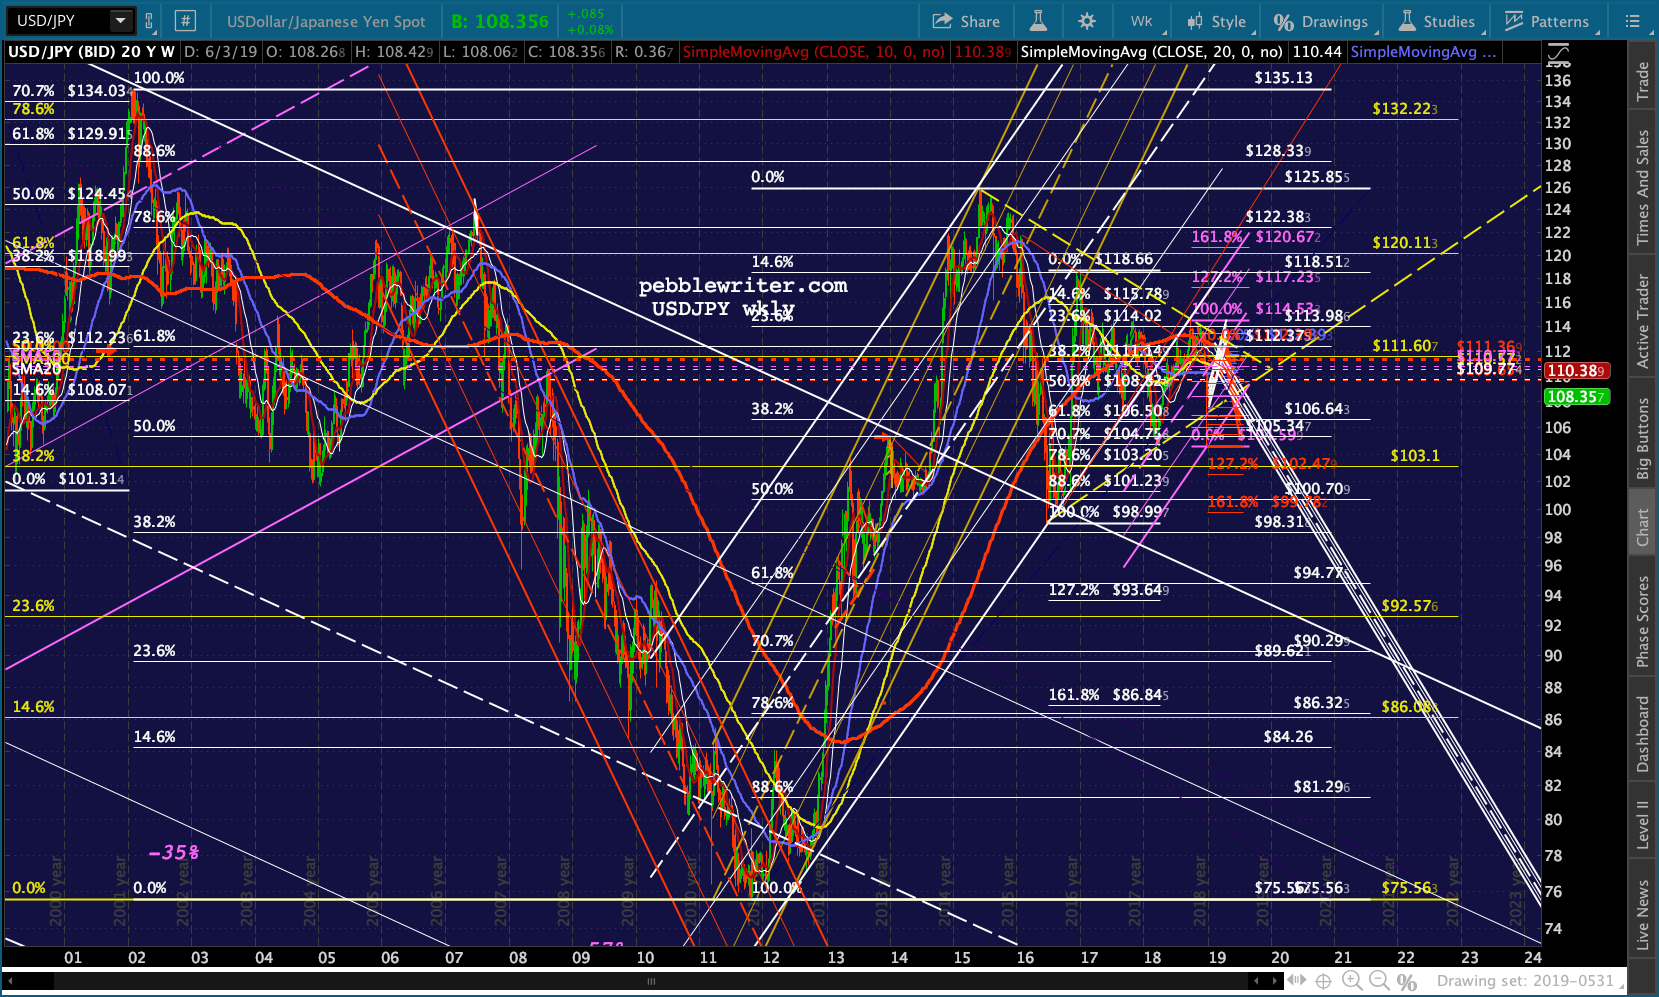
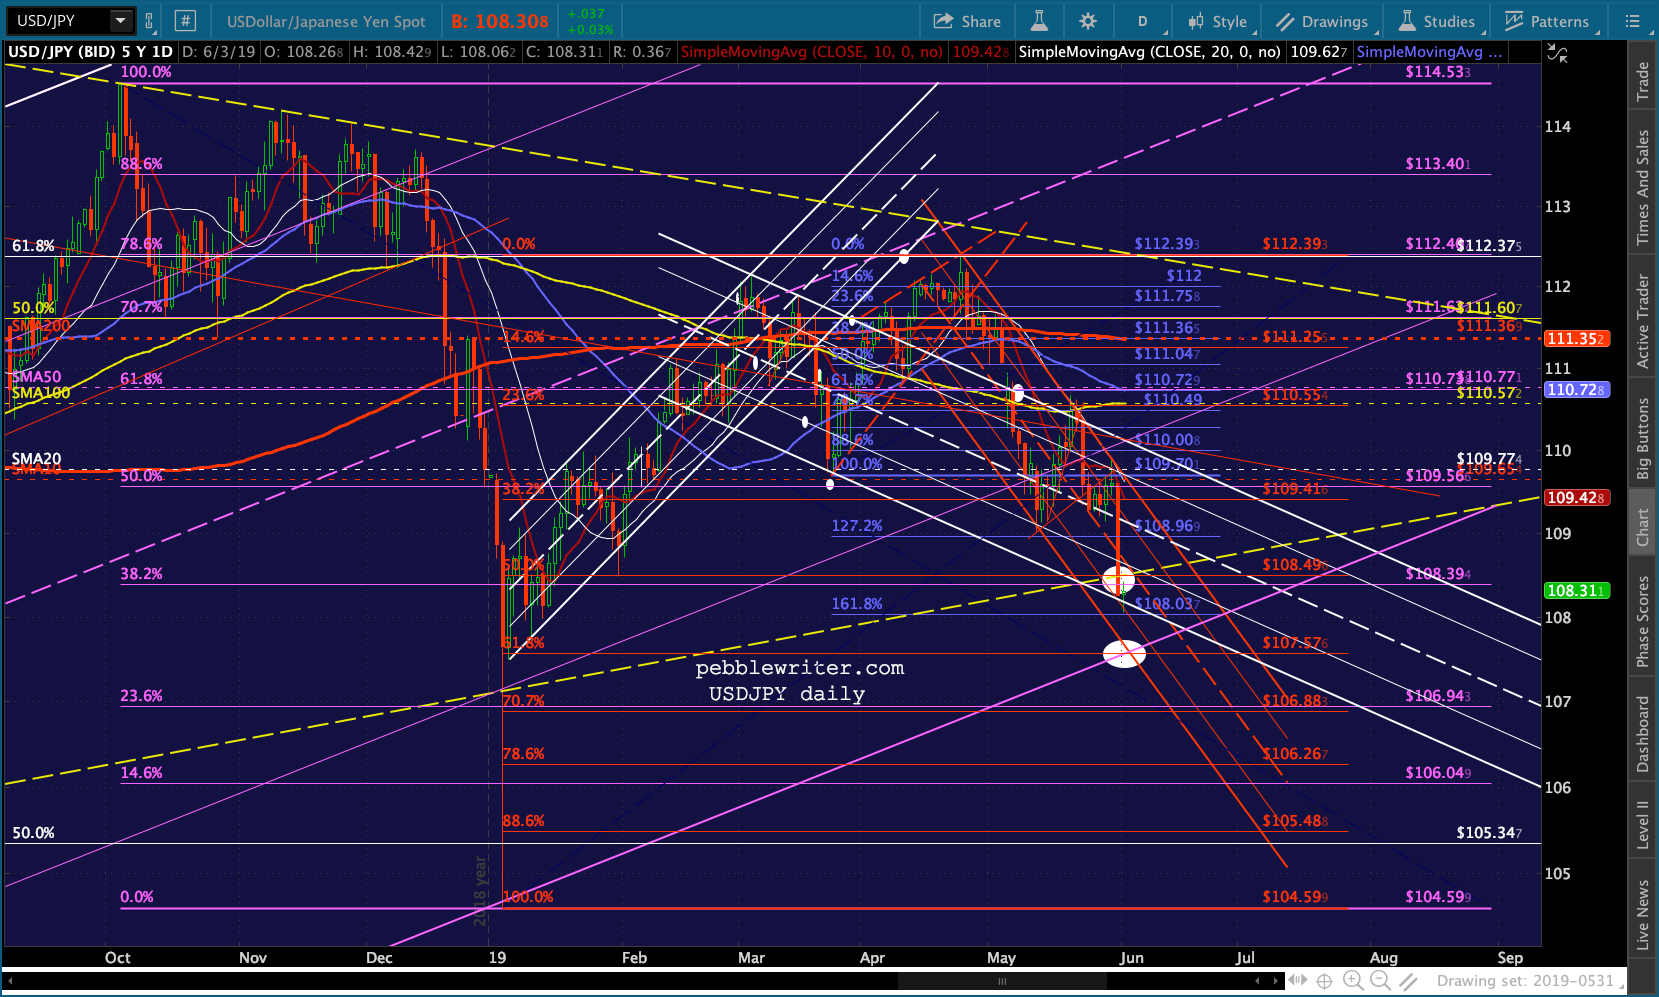 But, remember, the purple channel doesn’t mean all that much. The huge white channel from the 75 lows broke down in Jan 2018, and everything since then (the yellow triangle) has been a backtest.
 UPDATE: 10:43 AM
ES just reached its midline, a natural point of overhead resistance. It it pops any higher, the SMA200 is there to provide additional resistance.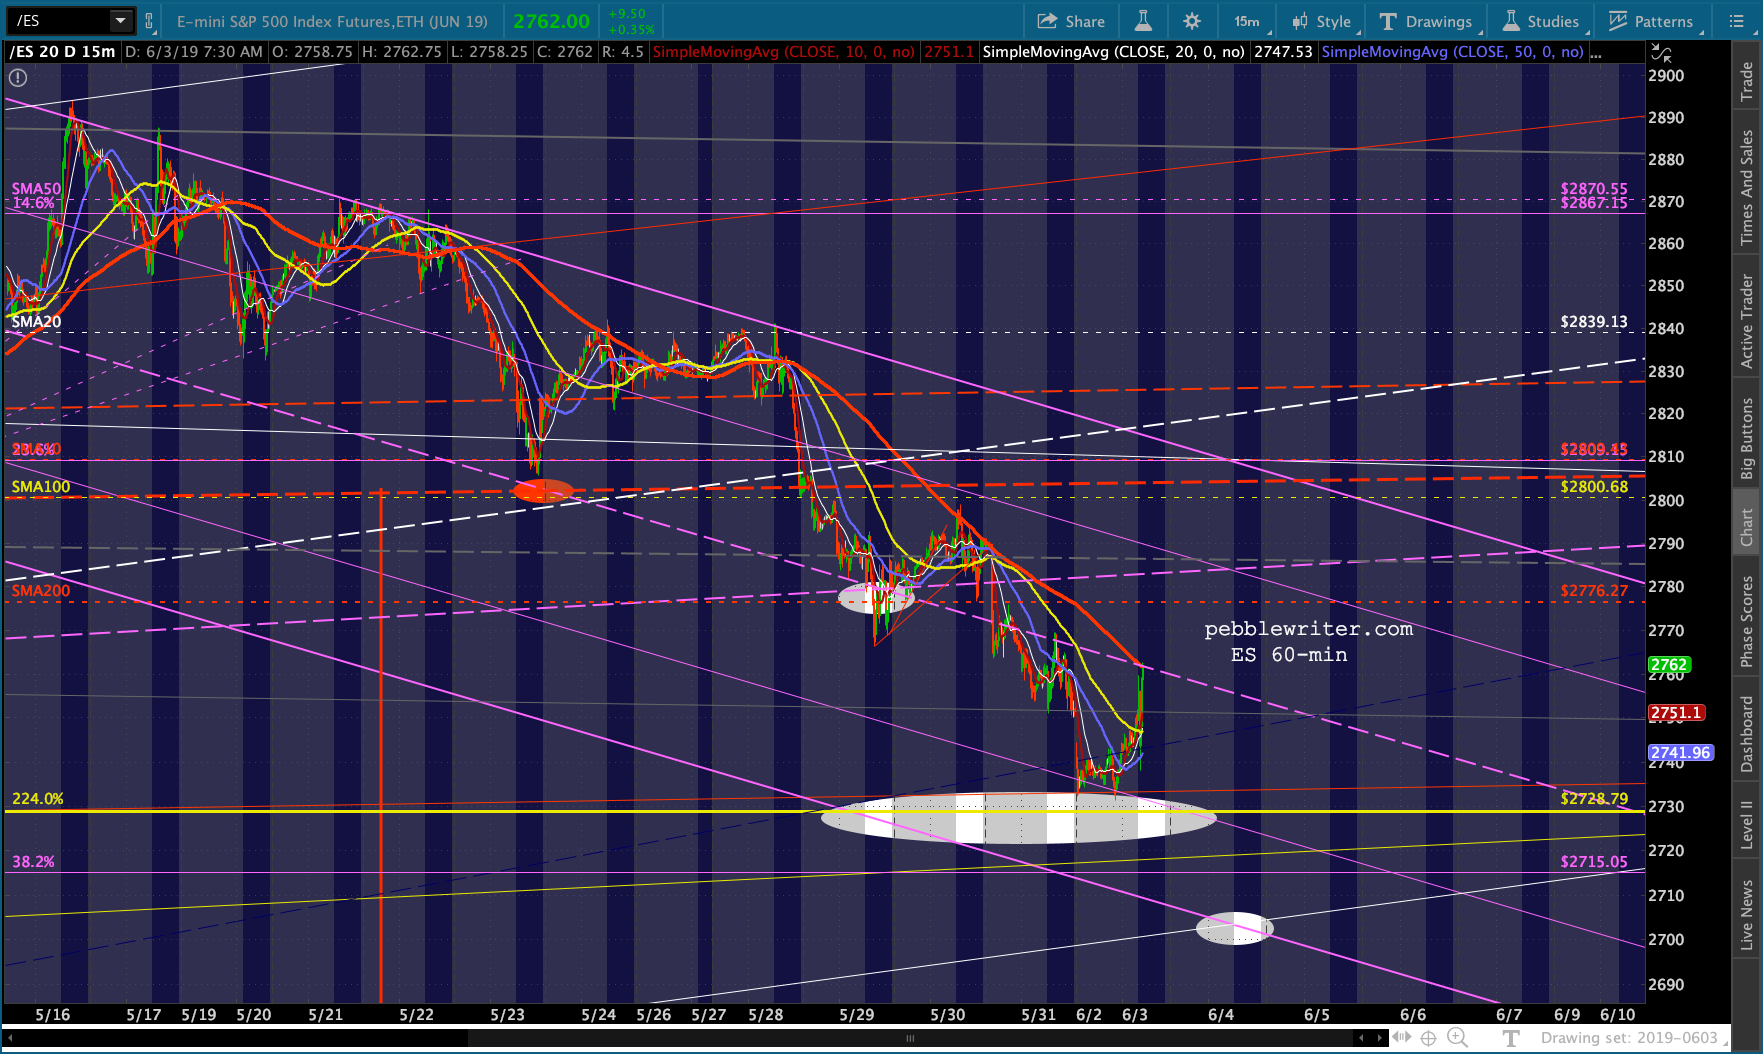 Note that AAPL has also reached its SMA60 100 — which has provided very strong overhead resistance for over a month. Can it get a bounce off the red TL and break out for a change?
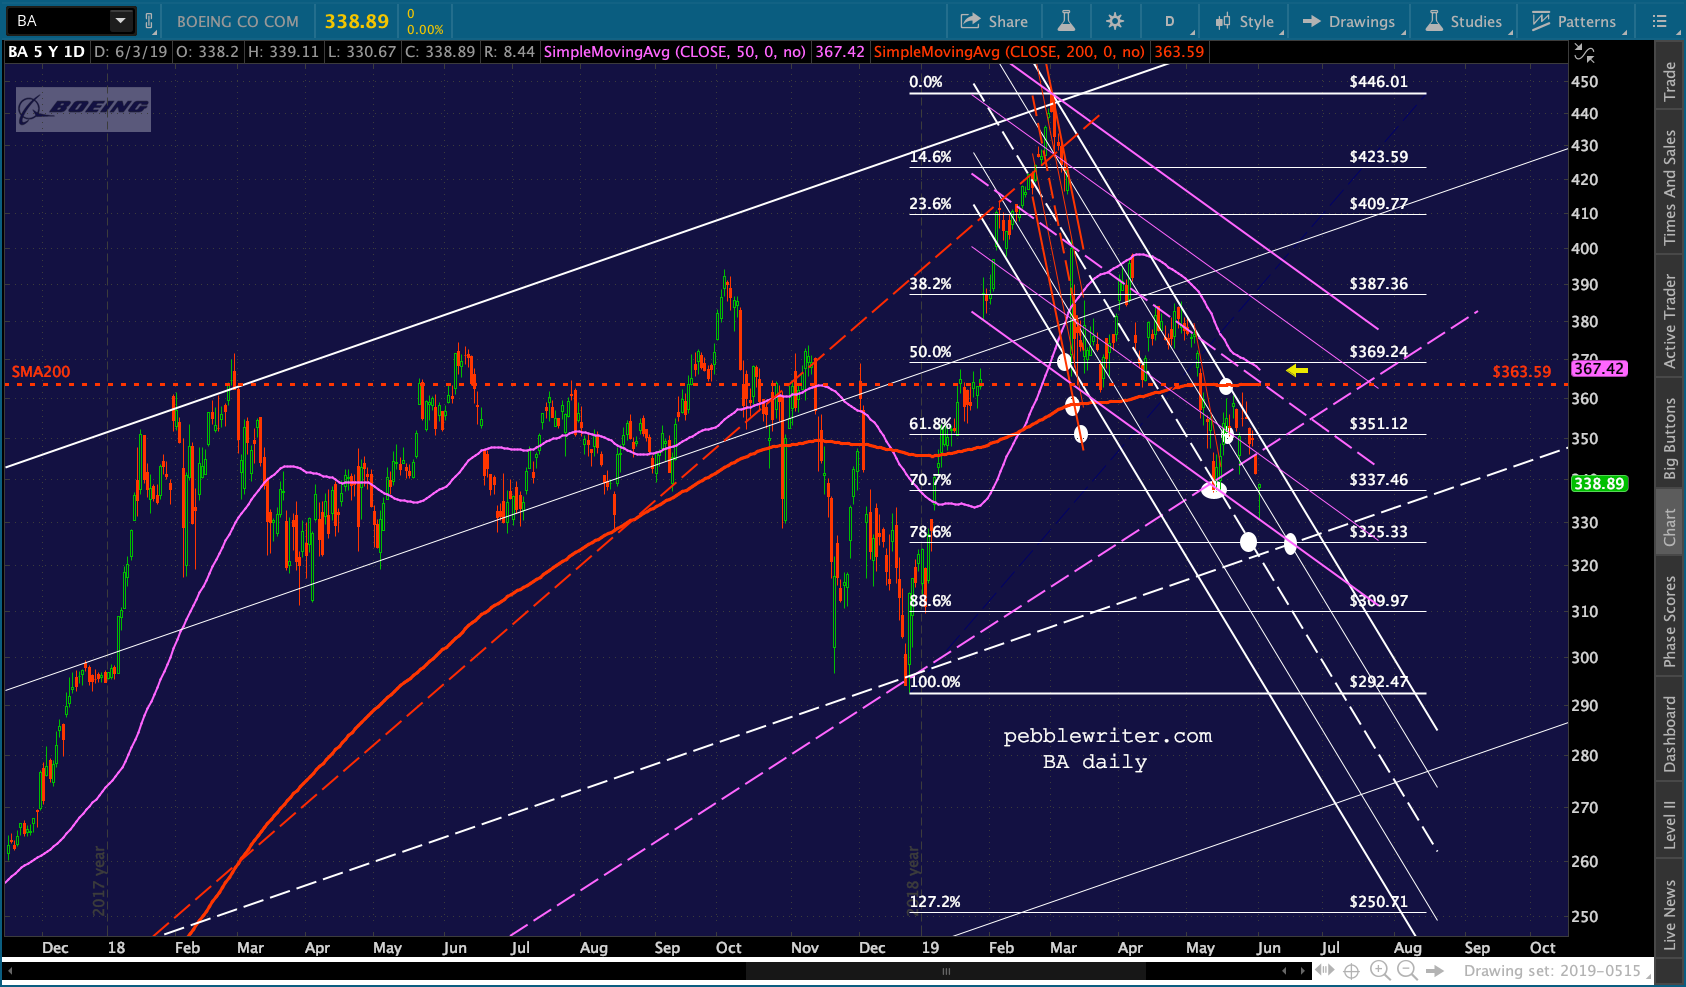
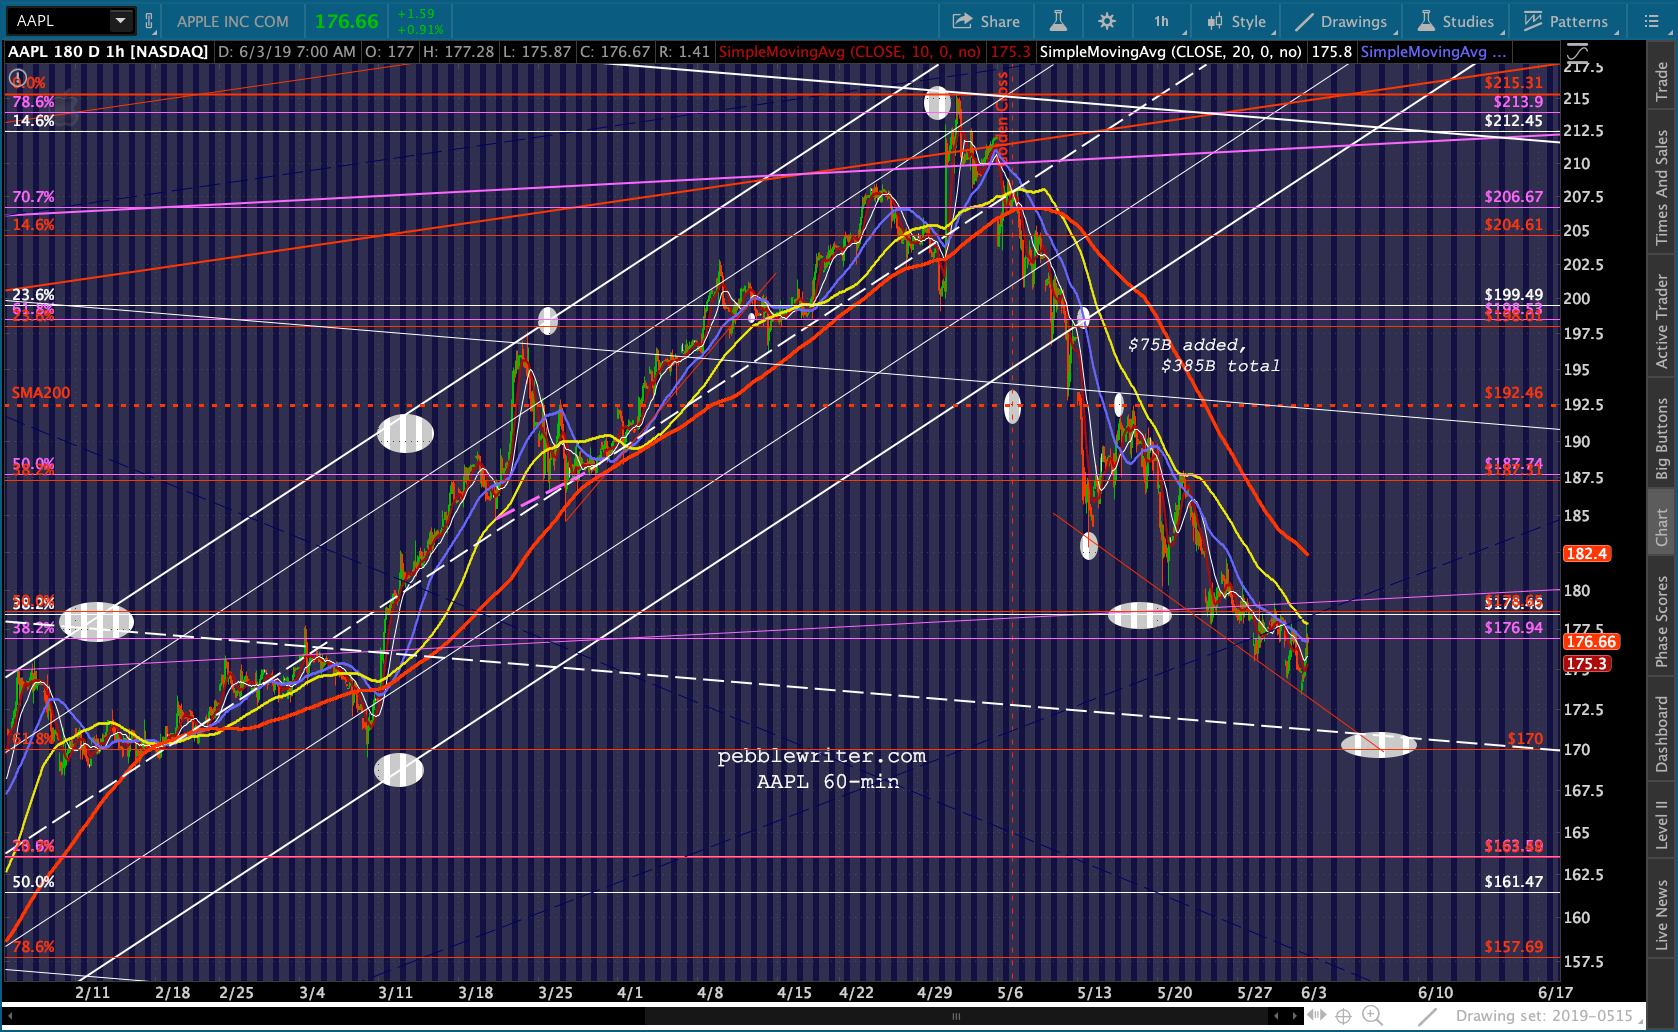 And, BA has put in a nice bottoming candle pretty darned close to our 325 target — not to mention on the bottom of the alternate falling purple channel.