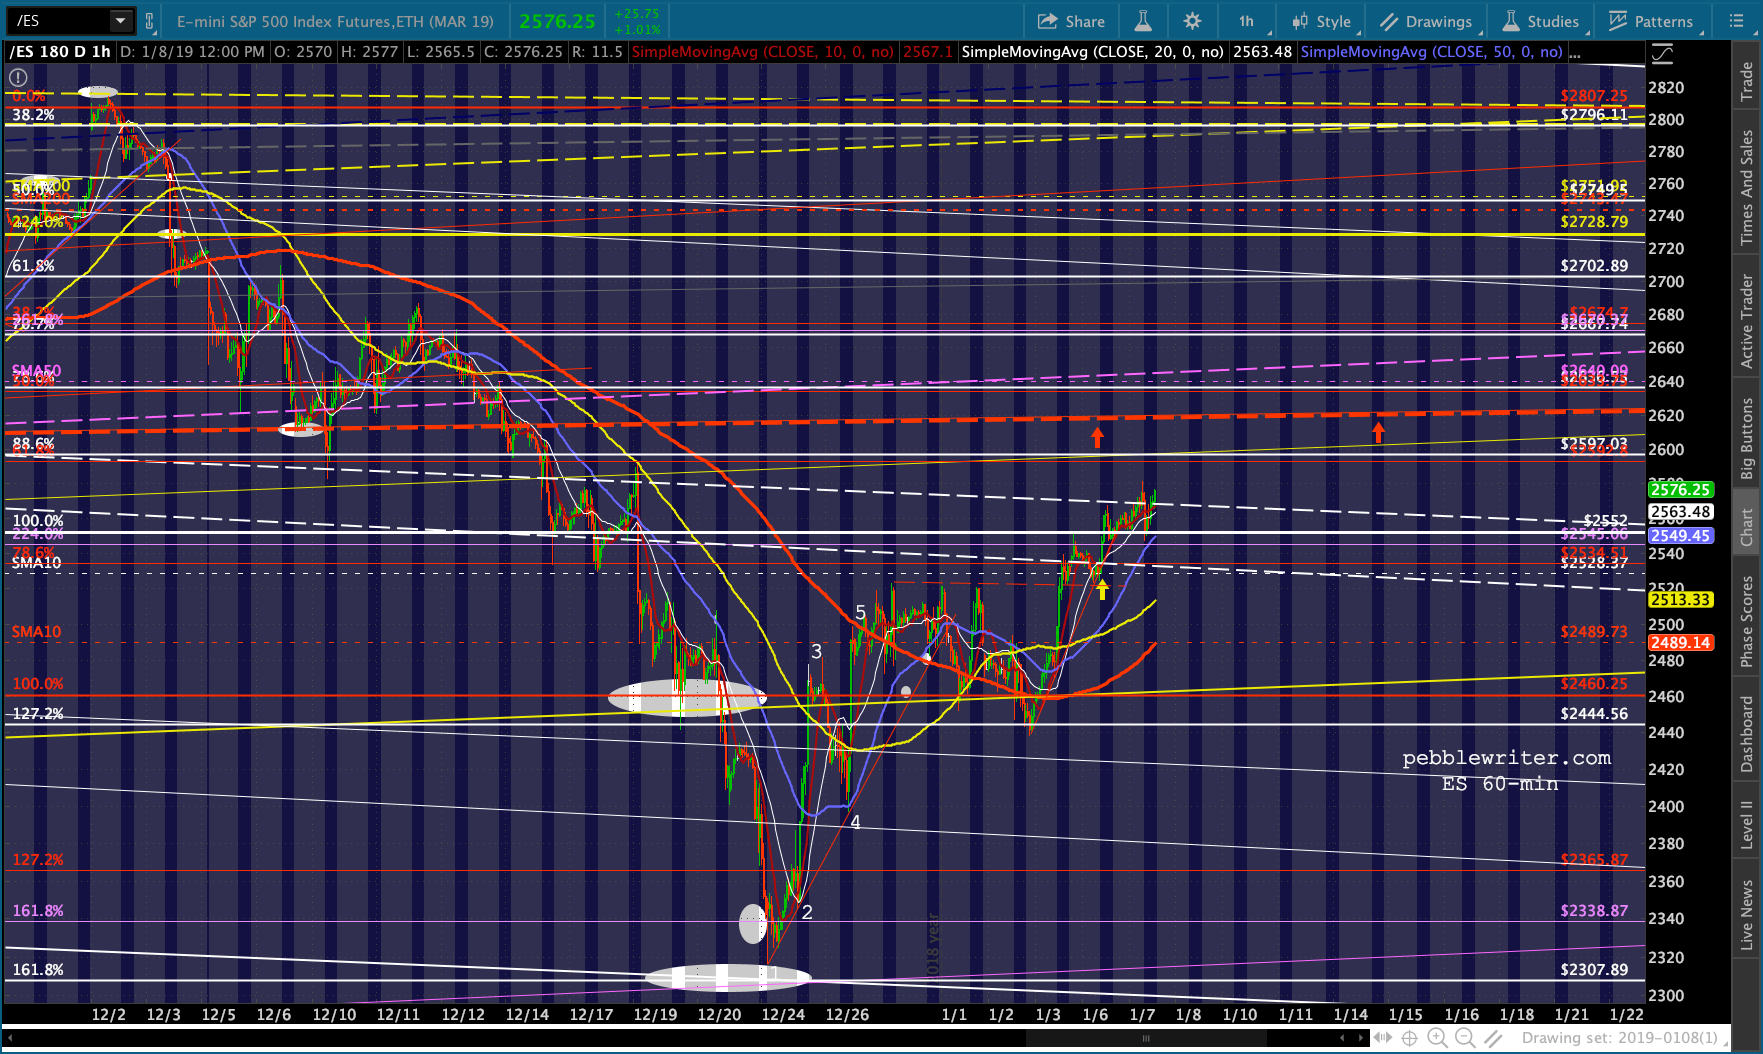
The algo-driven meltup continues, with ES currently showing a 24-pt gain primarily on the back of CL’s bounce off its SMA20 and VIX’s gradual asphyxiation. As ES approaches the neckline of the H&S Pattern it completed and paid off so handsomely, we’re left to wonder whether SPX will ever pay its off.
 continued for members.…
Recall that SPX’s target was well south of ES’. SPX stopped essentially in the middle of nowhere…  …compared to ES, which tagged the .236 line of its purple channel.
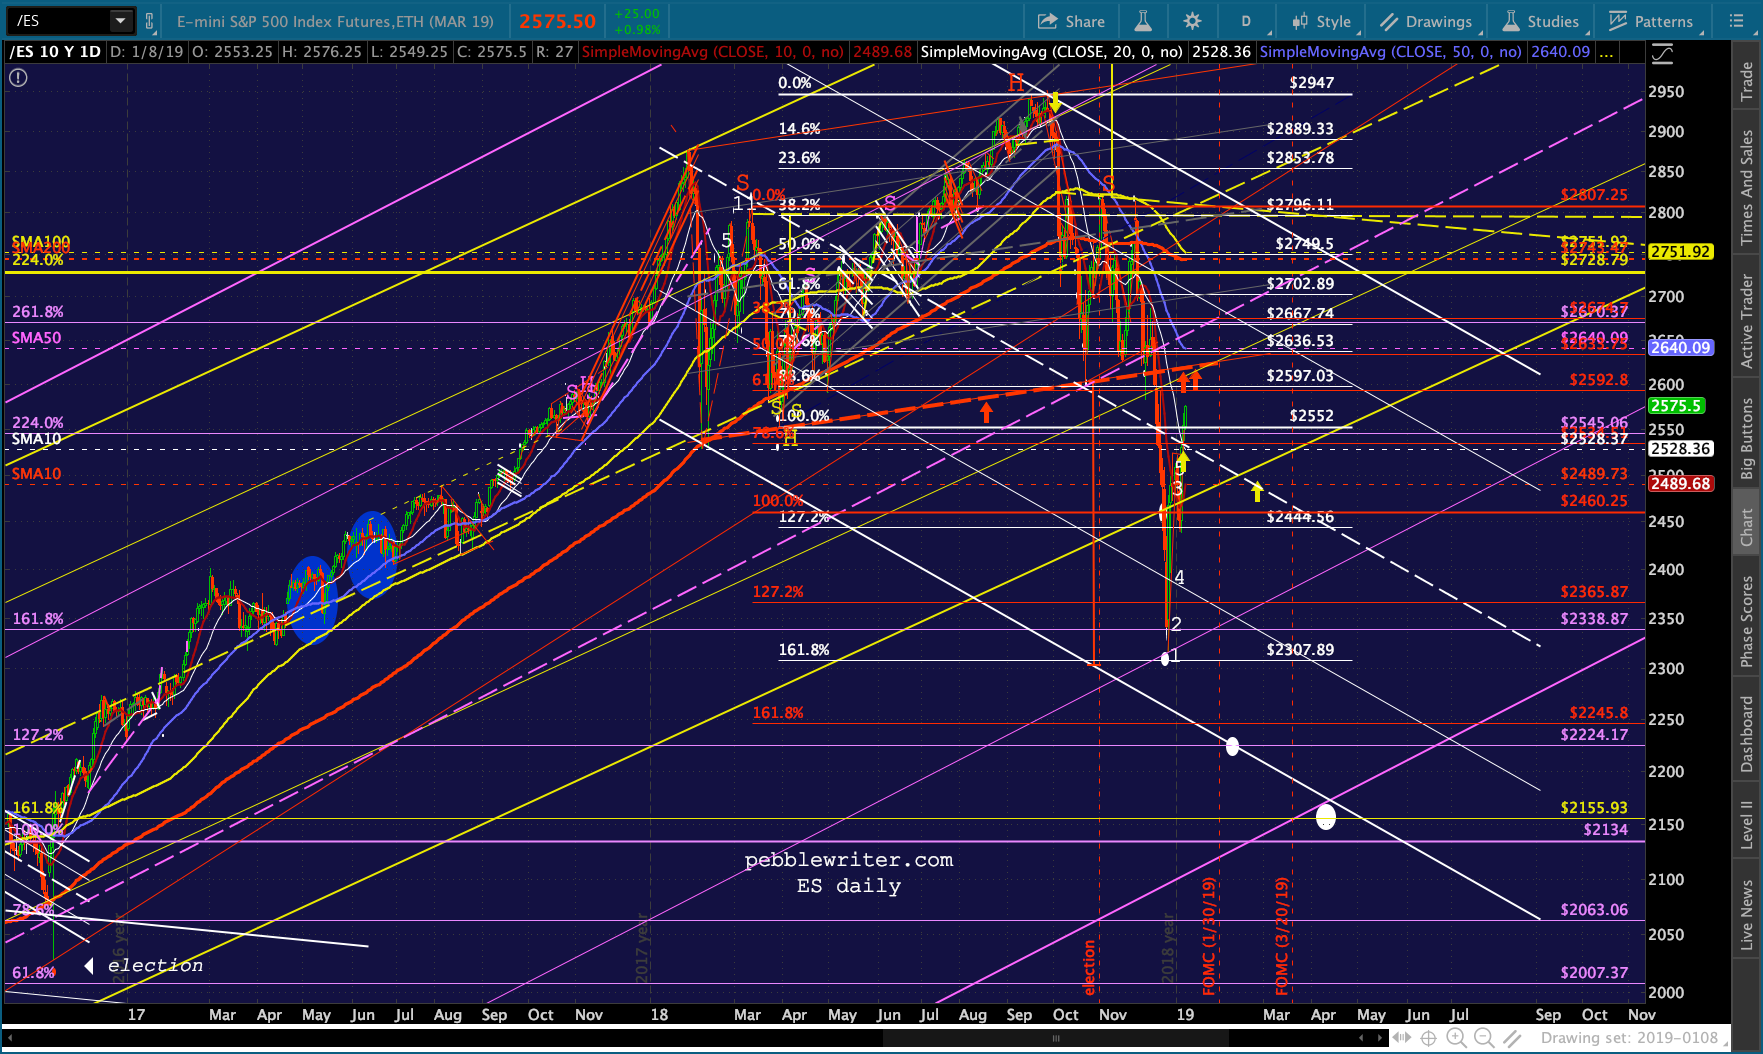 Since both have risen above the midline of the falling white channels which targeted the 1.618s at SPX 2138 and ES 2155, the implication is that those channels and proposed targets are off the table.
It seems like a good time to look at the algo drivers and see whether they have the potential to derail the meltup.
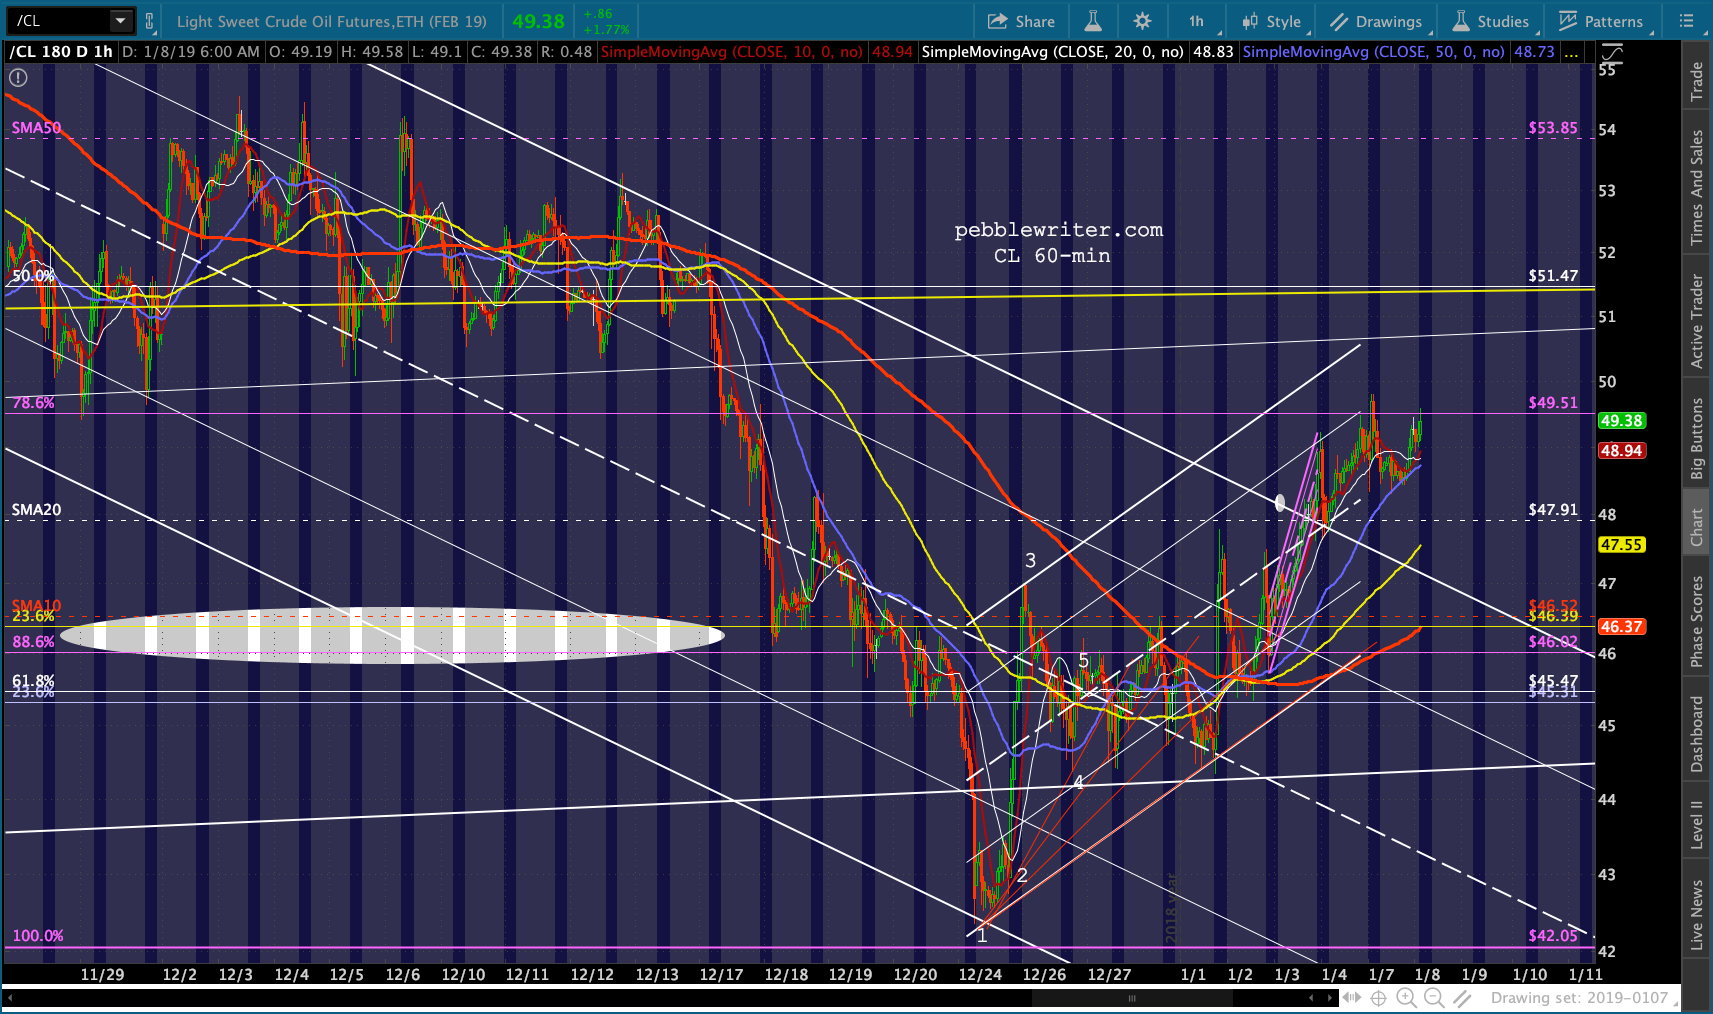
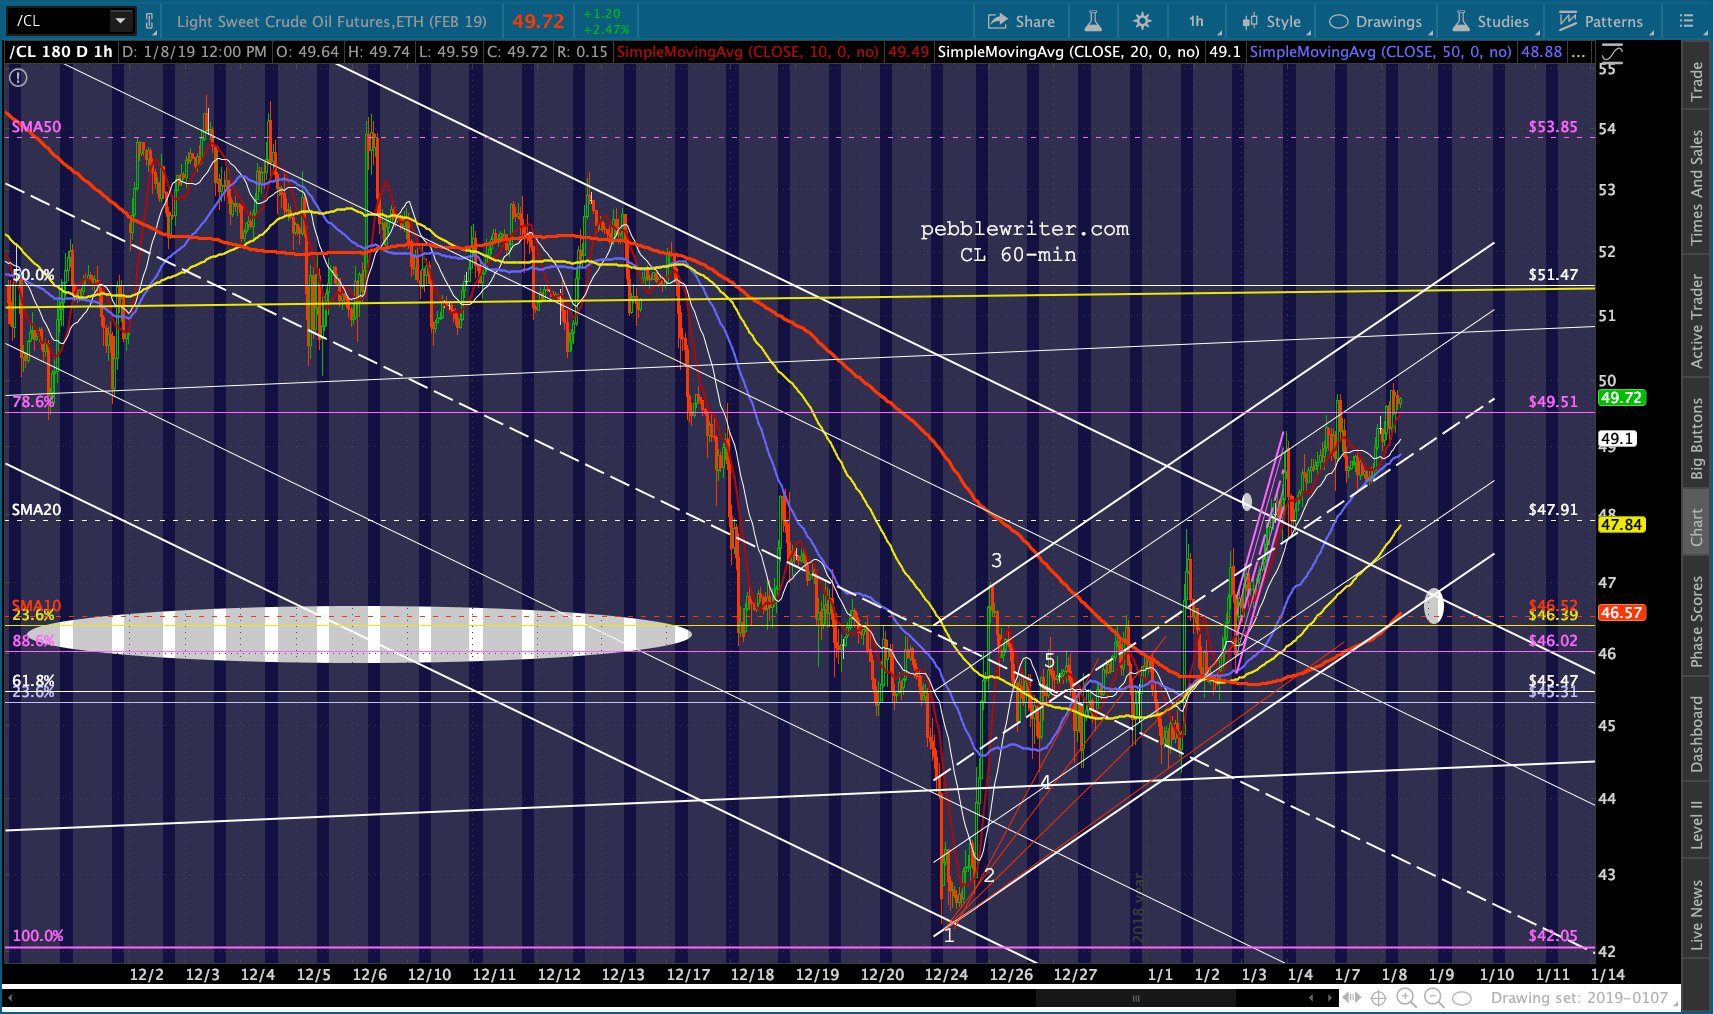
Oil and gas continue to experience their own meltups. CL did a quick backtest of the broken channel and SMA20. I assume it’ll drop down and backtest the SMA10 as it emerges from the falling white channel. The small, rising white channel would accommodate it as early as today.
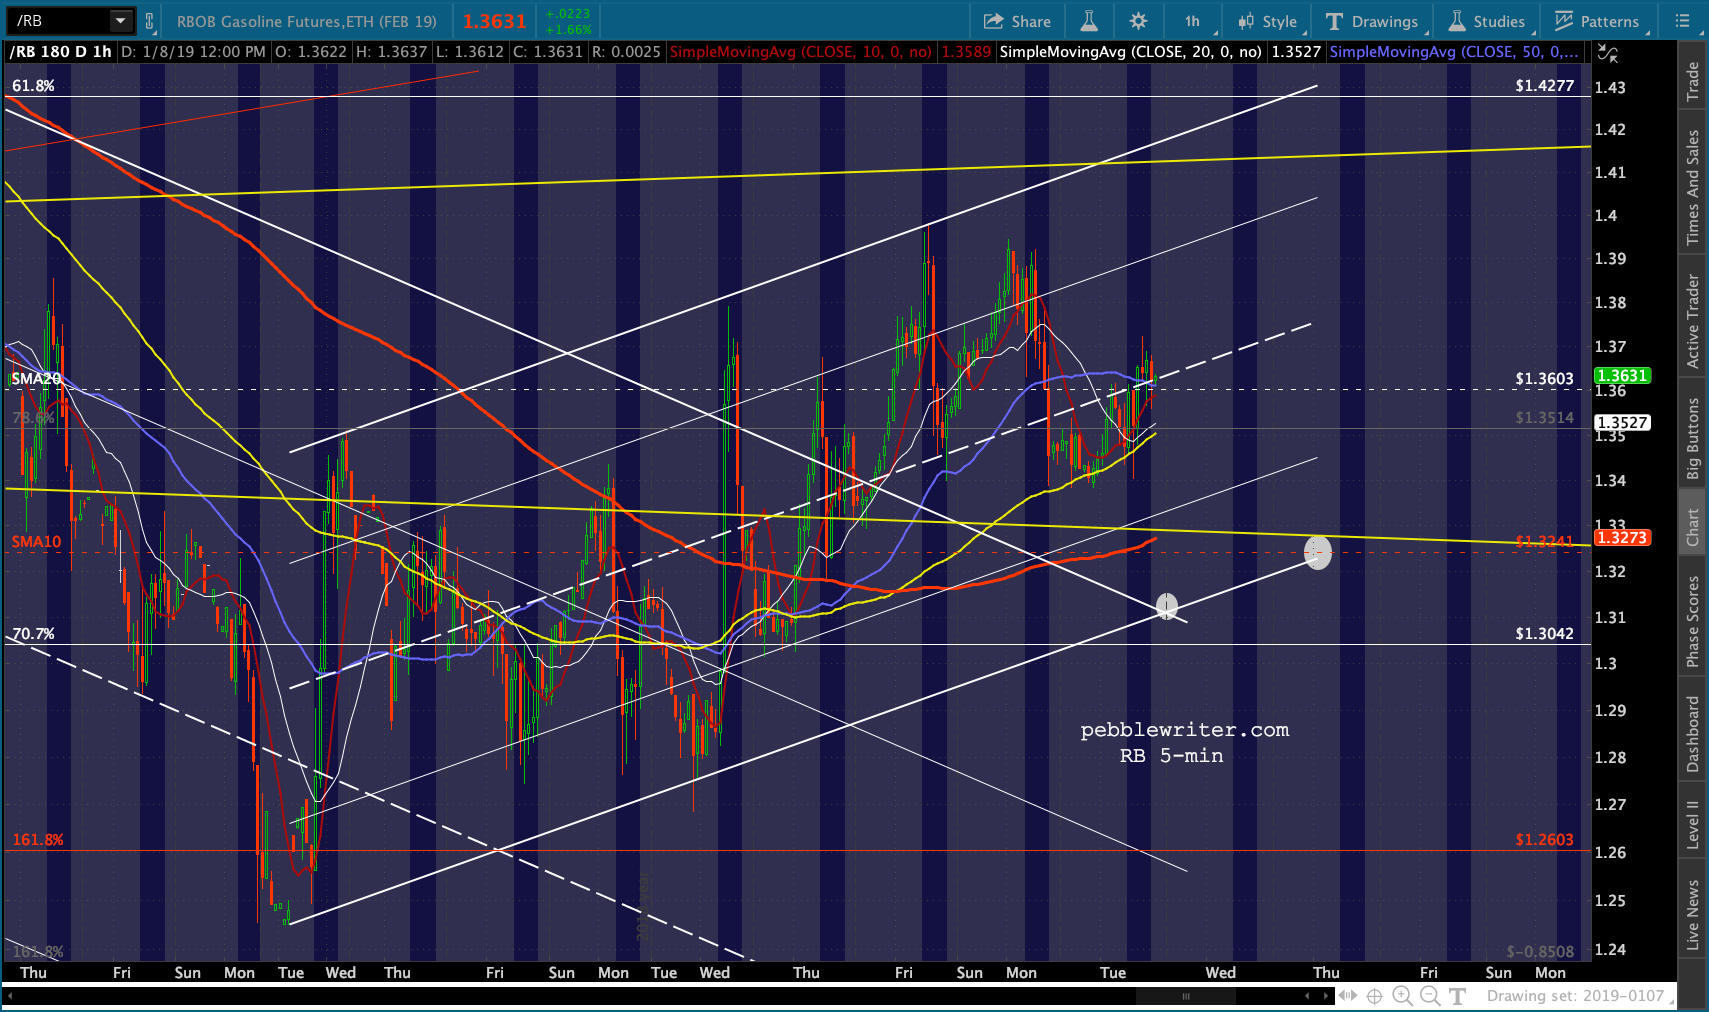
 RB is loitering below its SMA20, with no backtests of any consequence yet. This jibes well with our expectation that while it has likely bottomed, its rebound could be modest – at least until Dec CPI comes out. Like CL, it seems likely to backtest the SMA10 and broken white channel top as early as today.
 While these backtests could take some of the bloom off today’s rally, they shouldn’t derail it — as long as the SMA10s hold. If they don’t, the rally won’t last.
EIA’s first weekly Jan 2019 gas price data point came in yesterday at 2.128 – 13.74% below Jan 2018’s average of 2.467. A negative 13.74% YoY print should put CPI below 2%, which is exactly where it needs to be to keep pressure off the FOMC to hike rates any further.
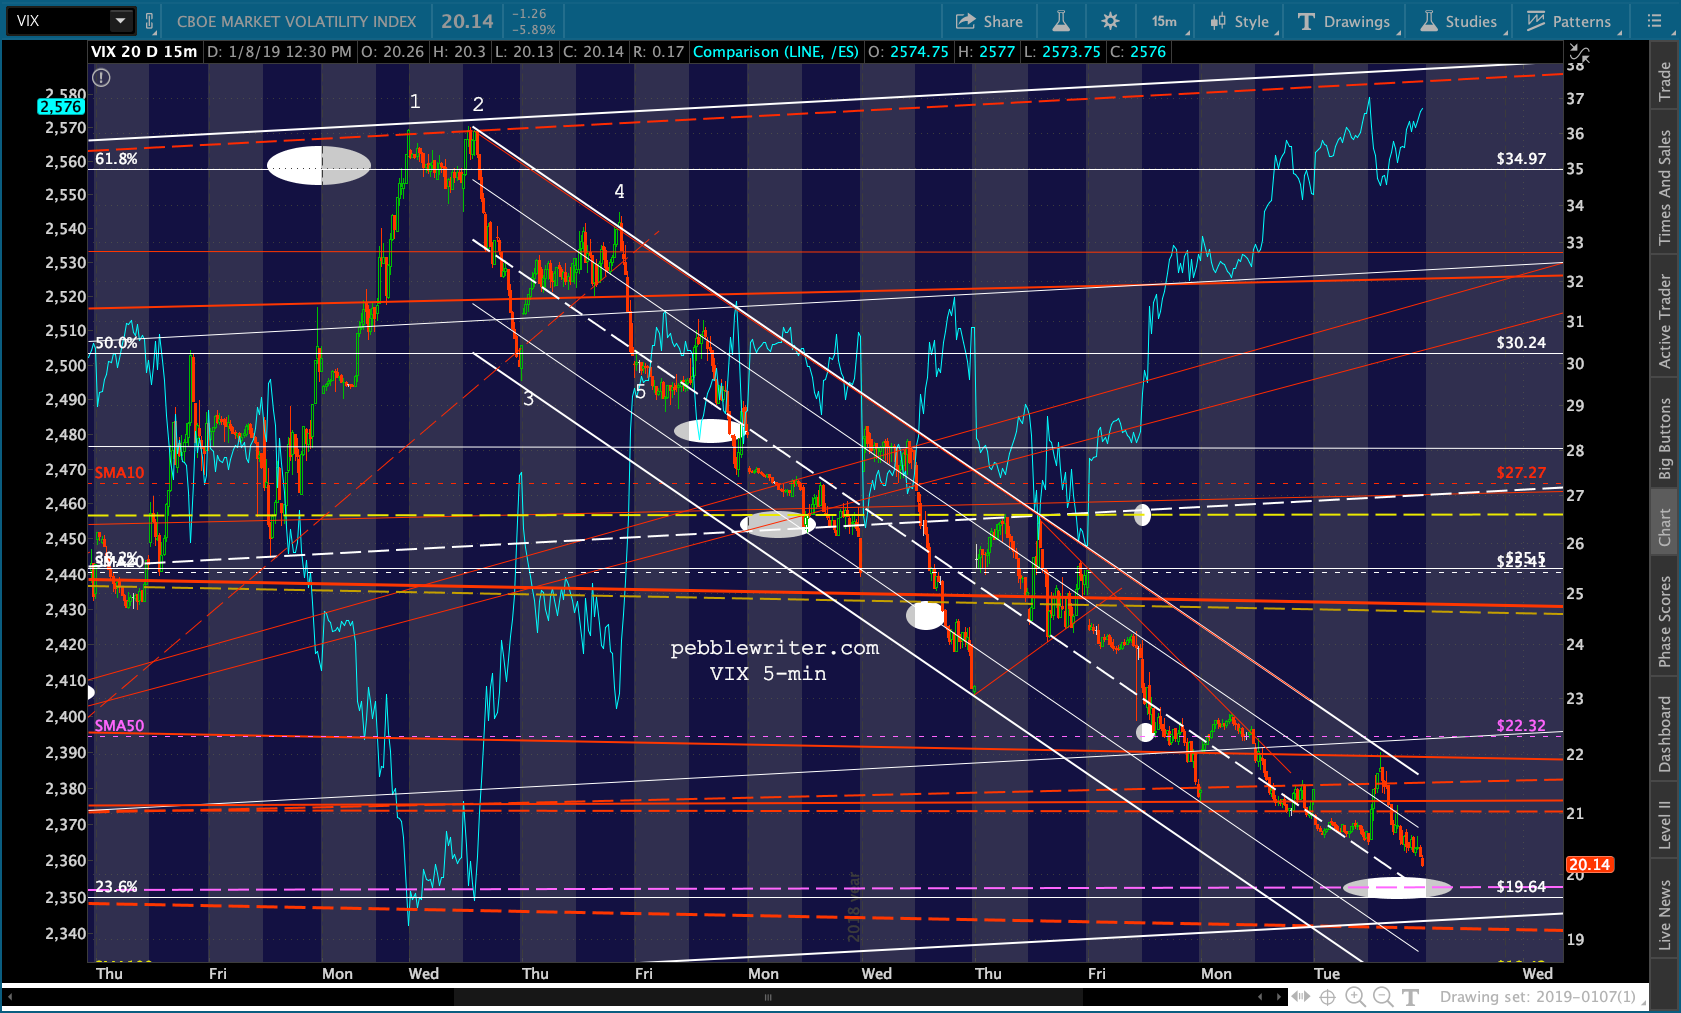
VIX has given up multiple opportunities to bounce – even on volatile days when it should have spiked higher. The bottom of the rising white channel sits at about 19.64 – not far below its current levels.
There are multiple chart patterns which intersect there – meaning potential support. A bounce at 19.64ish would obviously be a big boon for equity bears. But, with VIX, potential support frequently means a stock-boosting breakdown.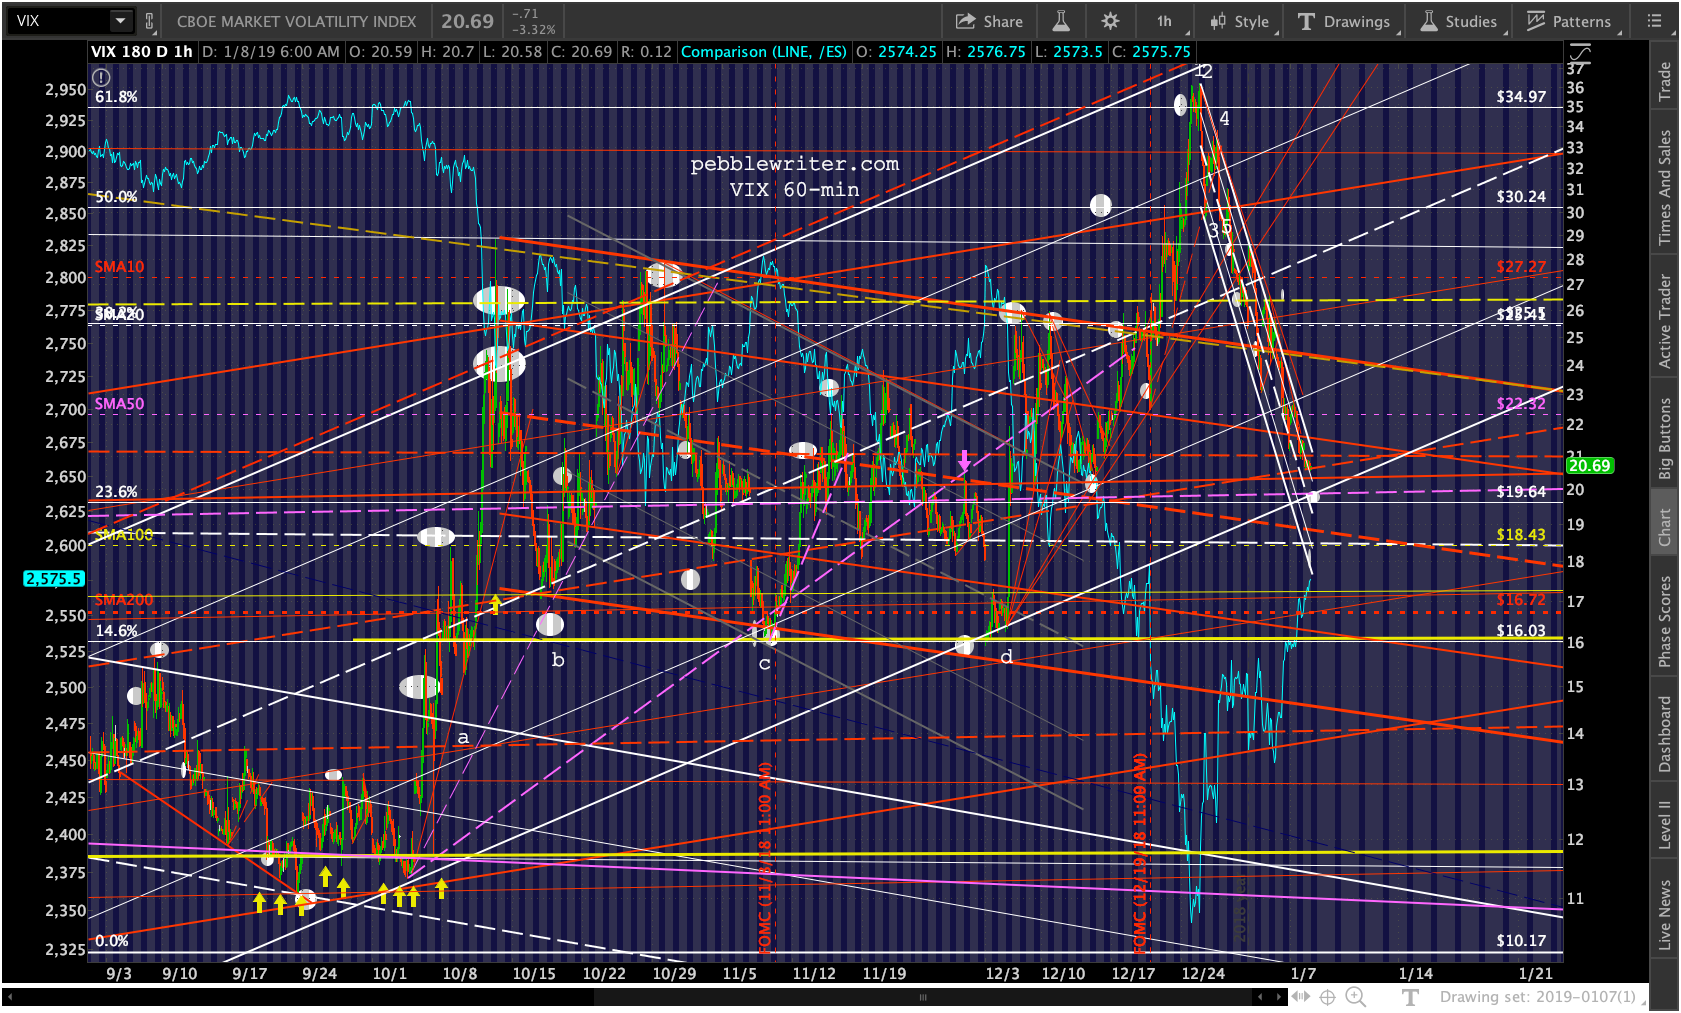 USDJPY is at a very interesting point. It has reached the purple trend line from Dec 14 and the top of a little rising wedge from Jan 2.
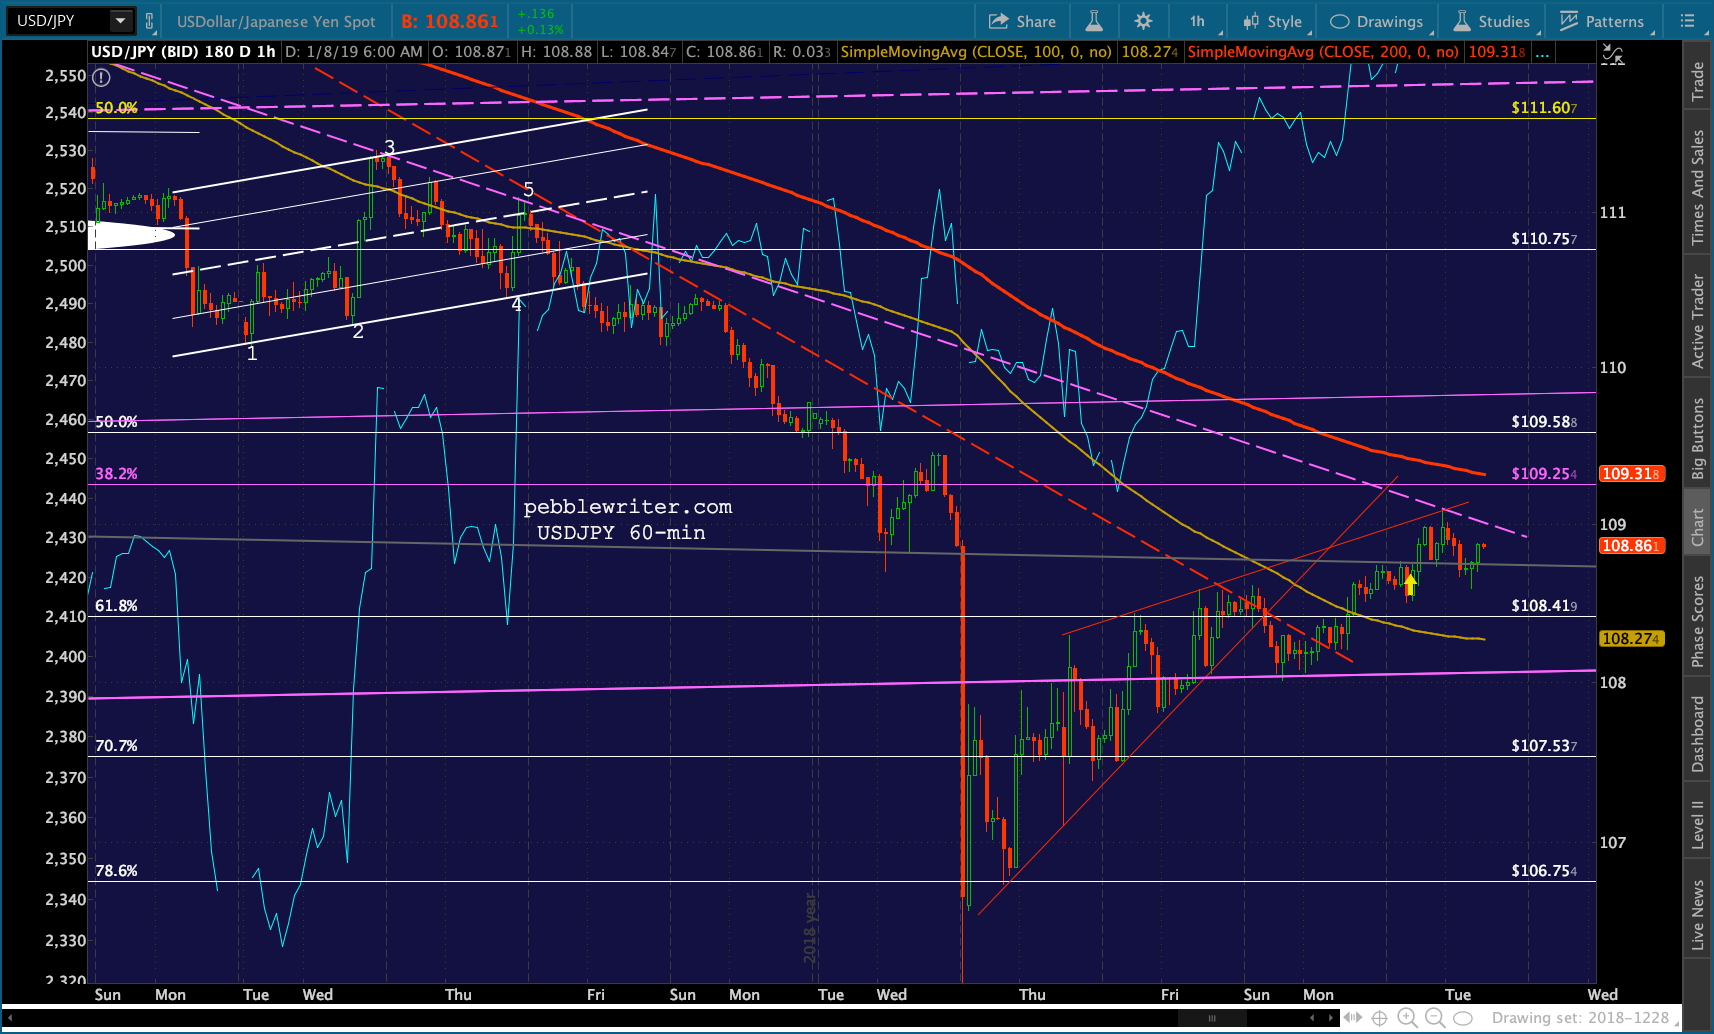 But, potentially more importantly, it has reached the top of the falling gray channel below which it broke down last Wednesday.
 If it fails to break out, this would be quite negative for equities. The fact that it hasn’t should be quite concerning to bulls.
Another concern: our yield curve model. Recall that a reversal off of overhead resistance and a drop through horizontal support are both bearish. Right now, it’s flirting with doing just that. TNX’s bounce these past few days seems completely uninspired, particularly with a very low inflation print coming out in a few days.
 A drop on Friday could further compress the 2s10s spread.
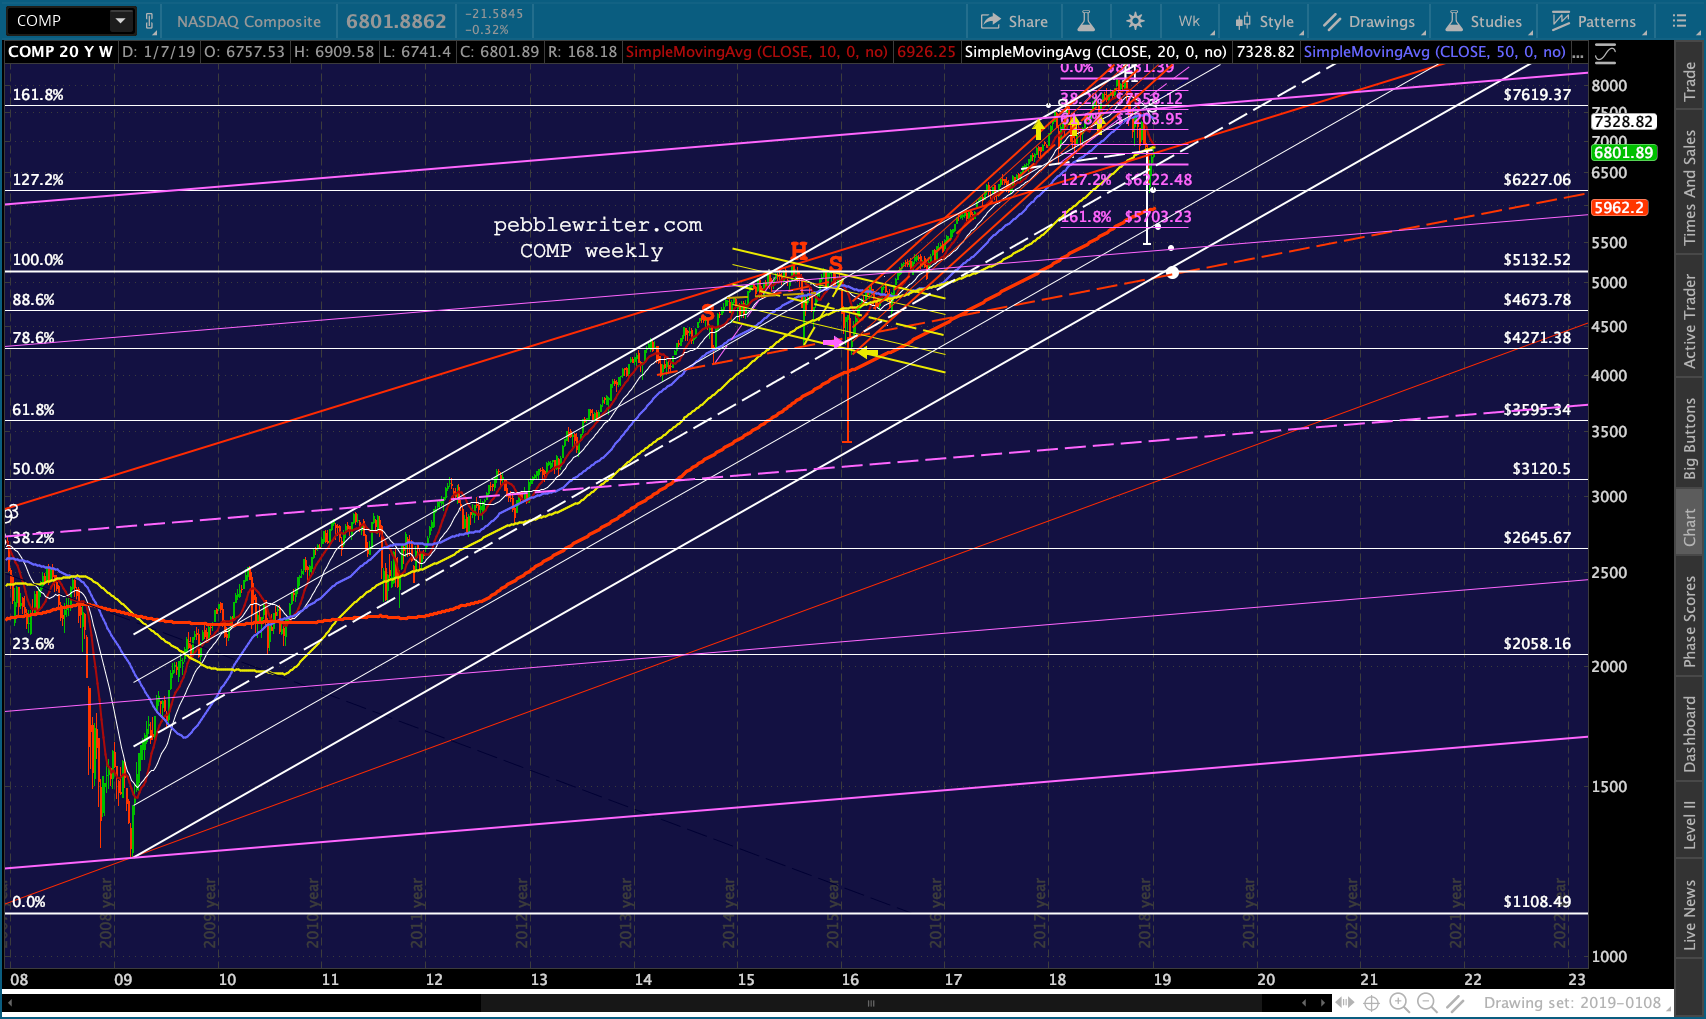
On a positive note, AAPL reversed yesterday’s apparent rollover and is slightly higher on the day. Every day that it doesn’t break down further is a good day for the stock.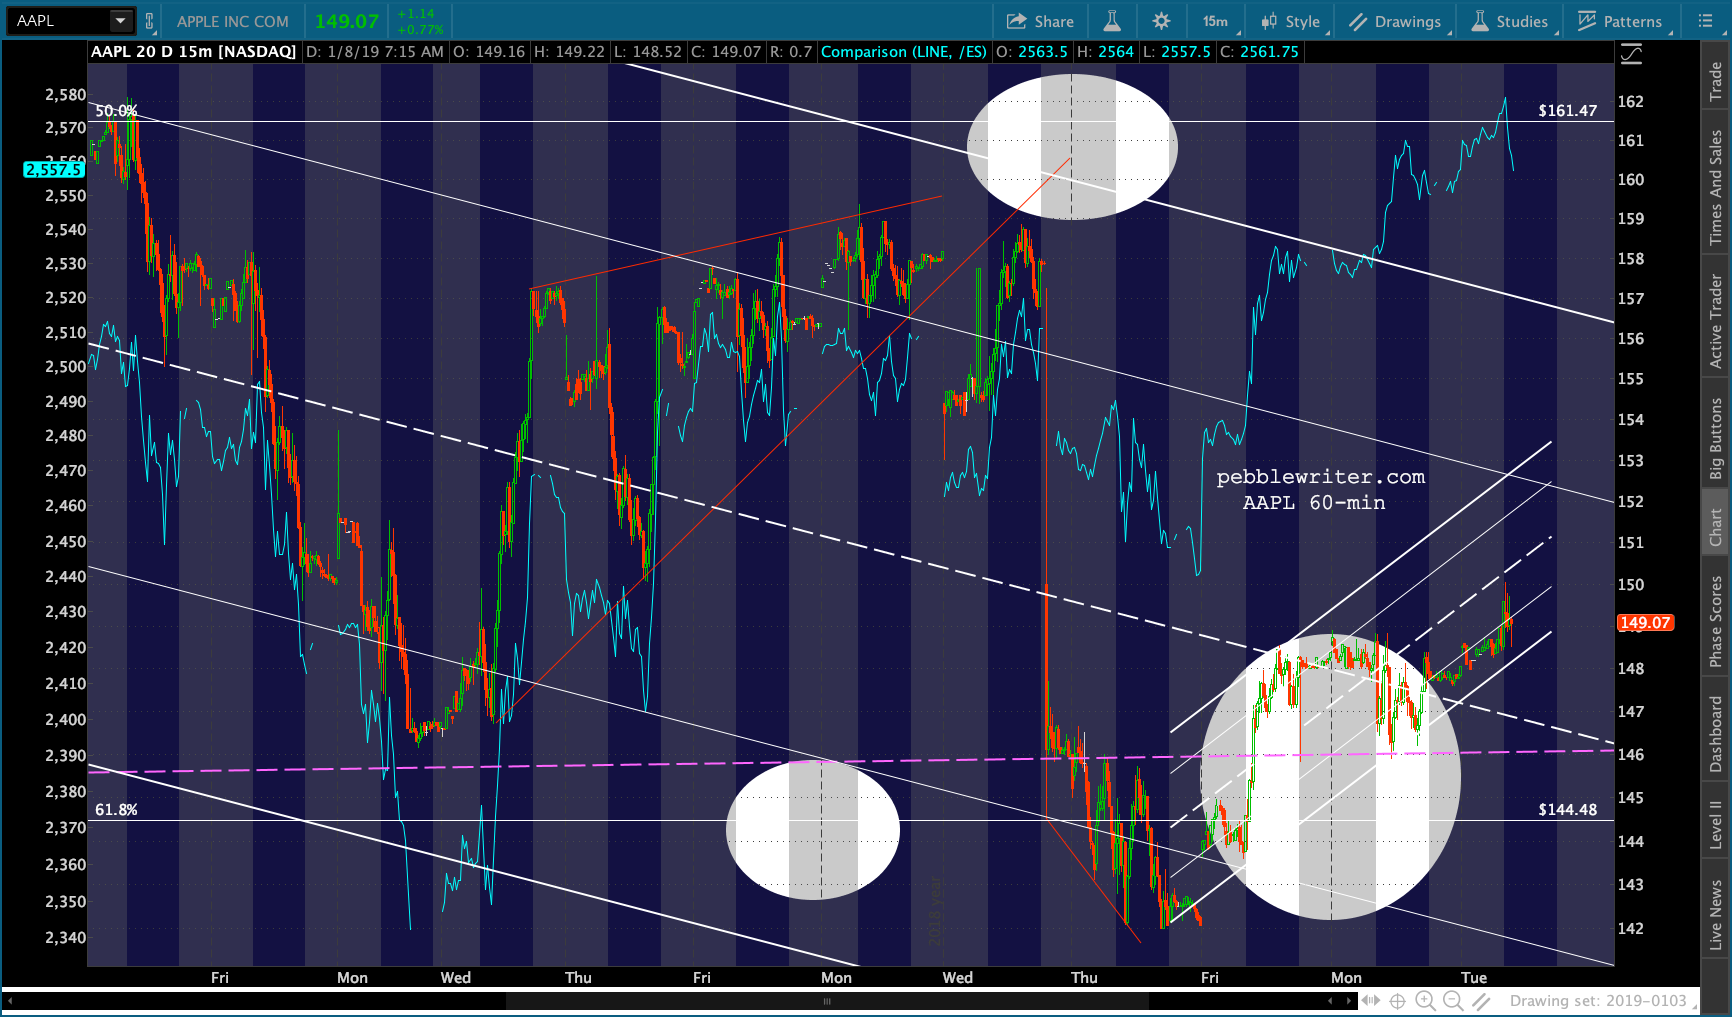 COMP, on the other hand, is struggling in its bid to climb back atop its neckline. A failure to hold it would be a clear signal that we have potentially much further to fall.
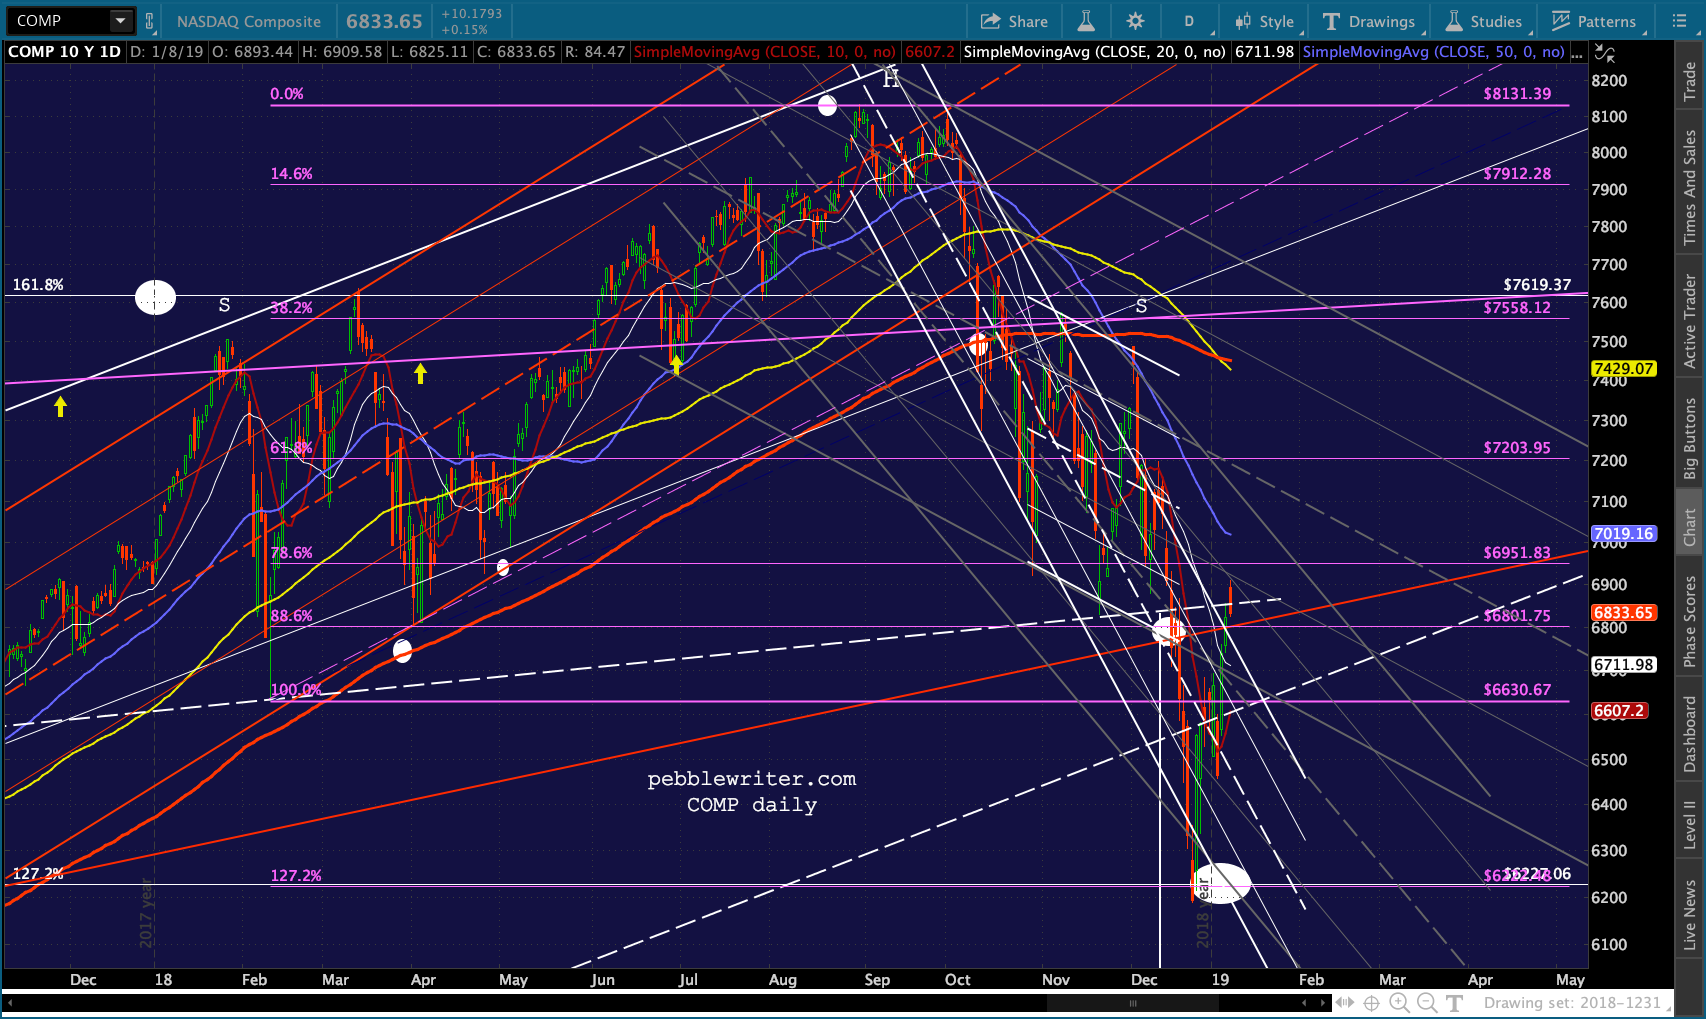 The H&S Pattern indicates much lower prices — the purple 1.618 at 5703 and a backtest of the 5132 double top.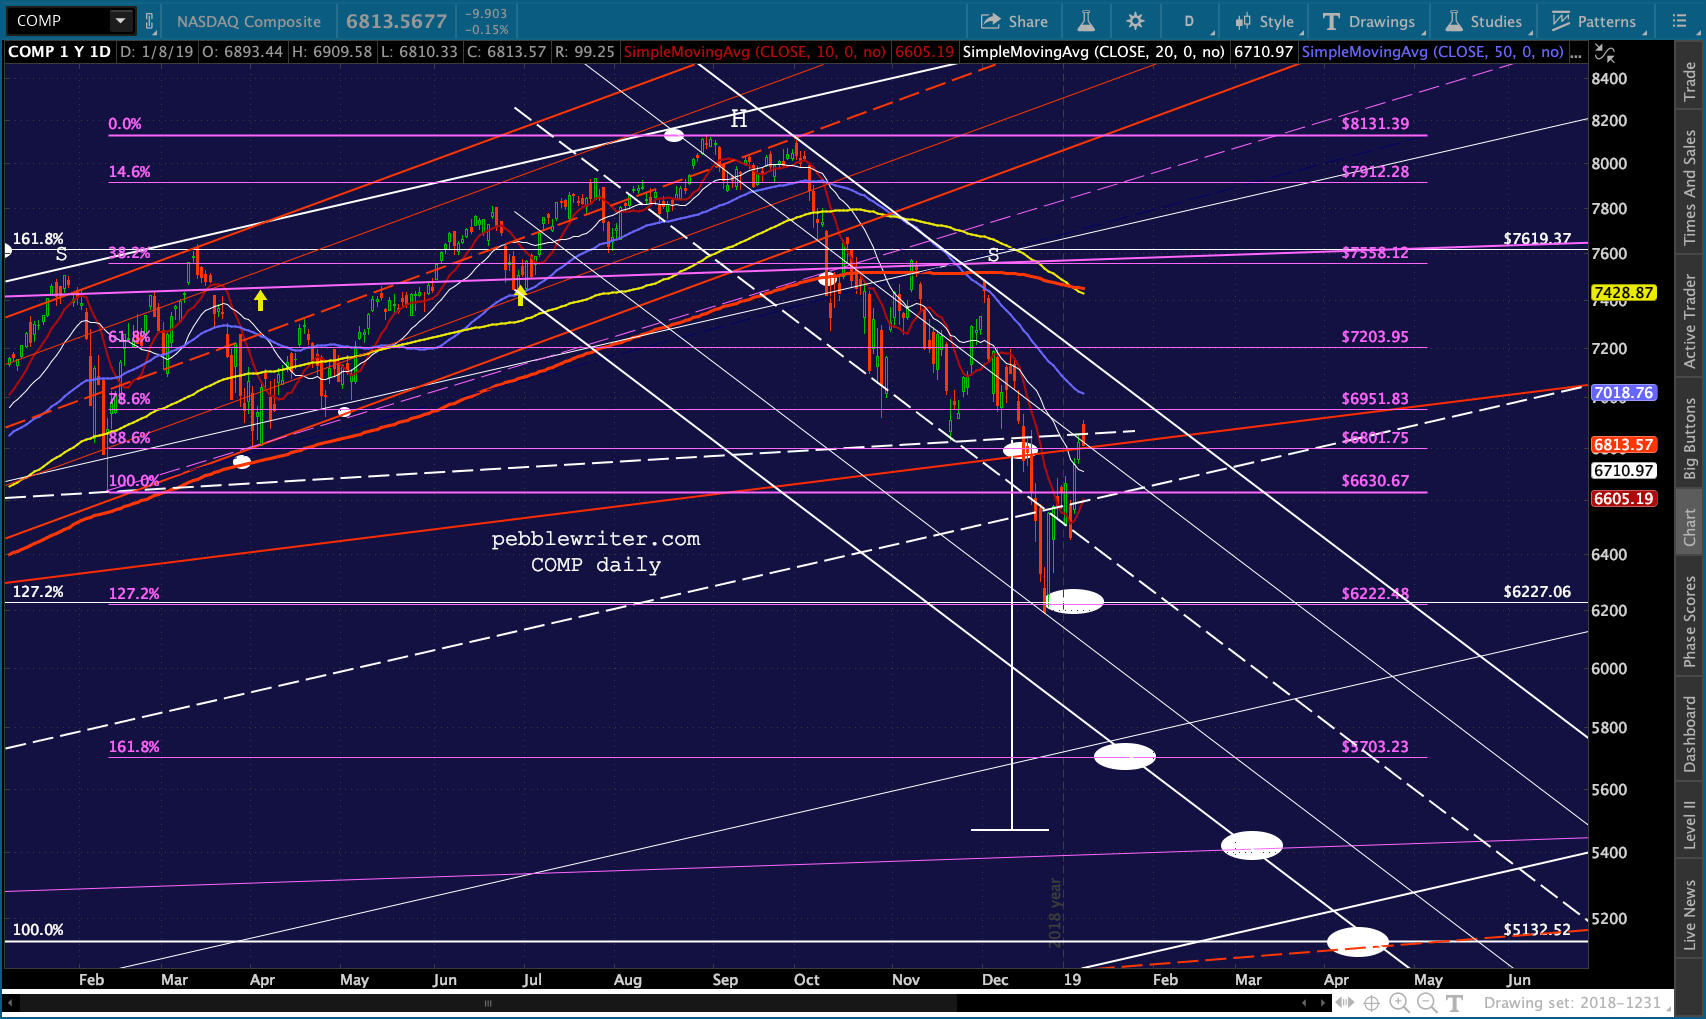
Add it all up, and the scale is tilted toward the downside. But, a drop could be offset with a strong breakout by USDJPY or breakdown by VIX. So, as always, use stops.
More later.
UPDATE: 3:40 PM
Another day of silliness – more algo meltup.
COMP recovered its neckline after going negative on the day.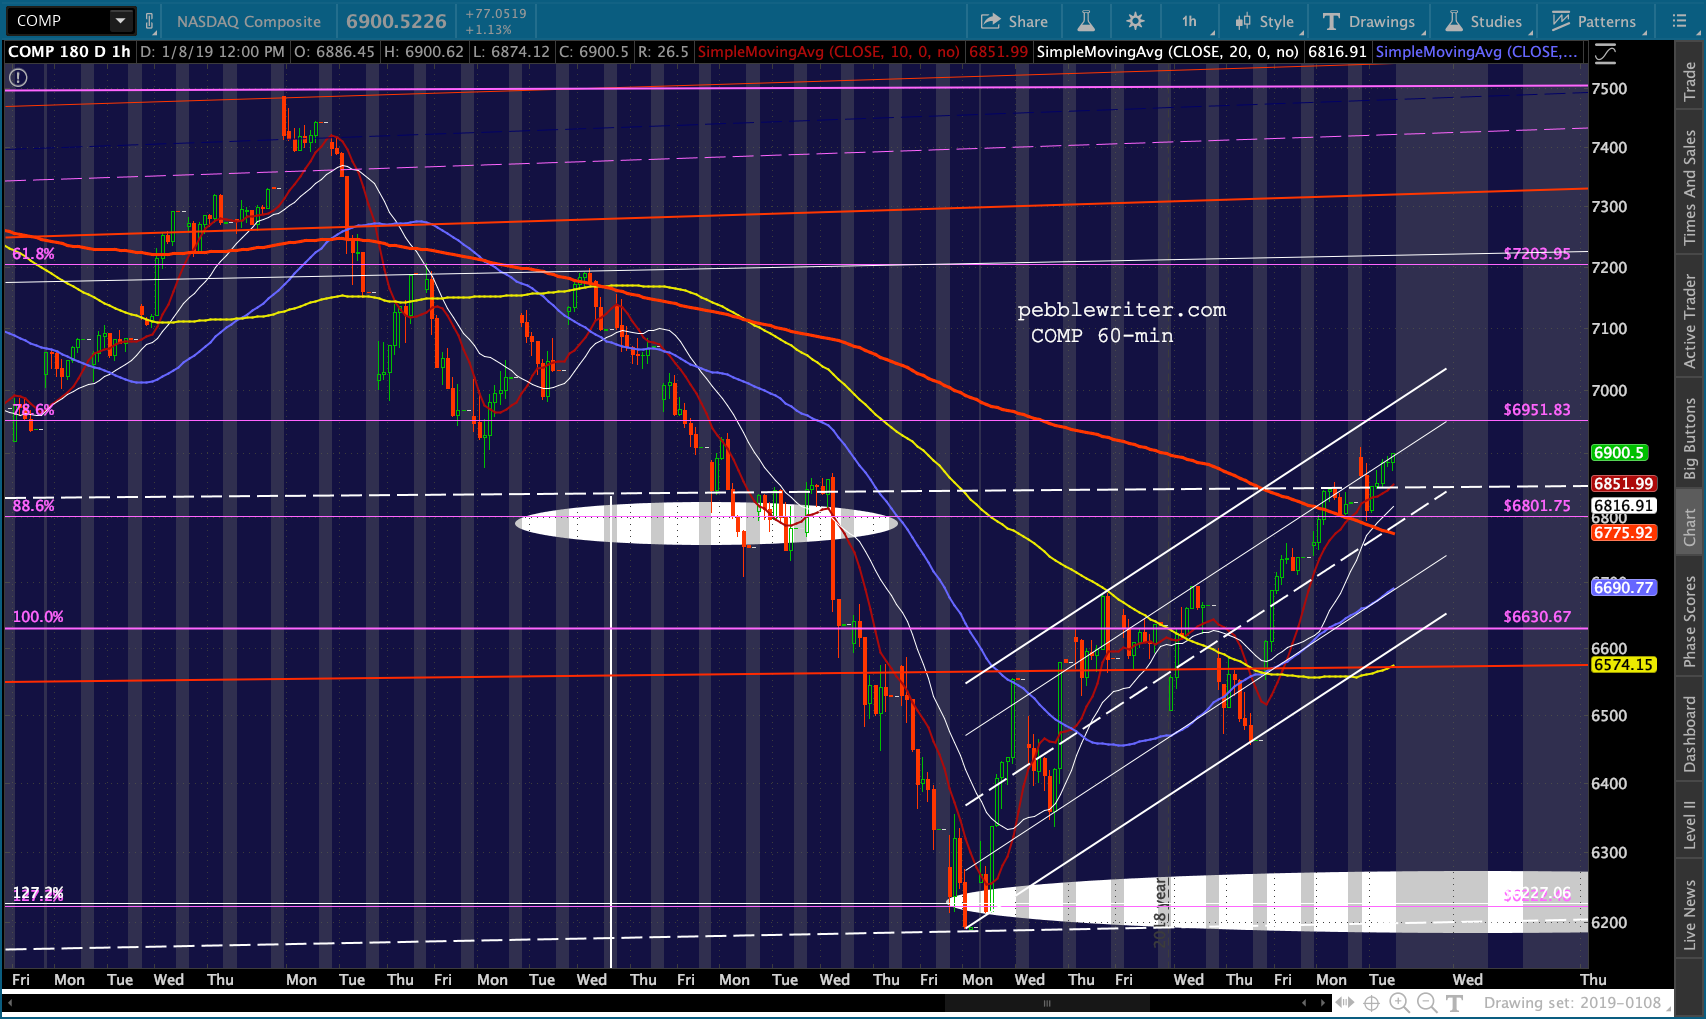 ES is back to a 24 point gain after also going negative earlier. One good 36-pt day or a couple of 18-pointers is all it’ll take to reach the neckline. Unless something dramatic changes, we’ll probably see USDJPY break out or VIX break down in order to pop back above it.
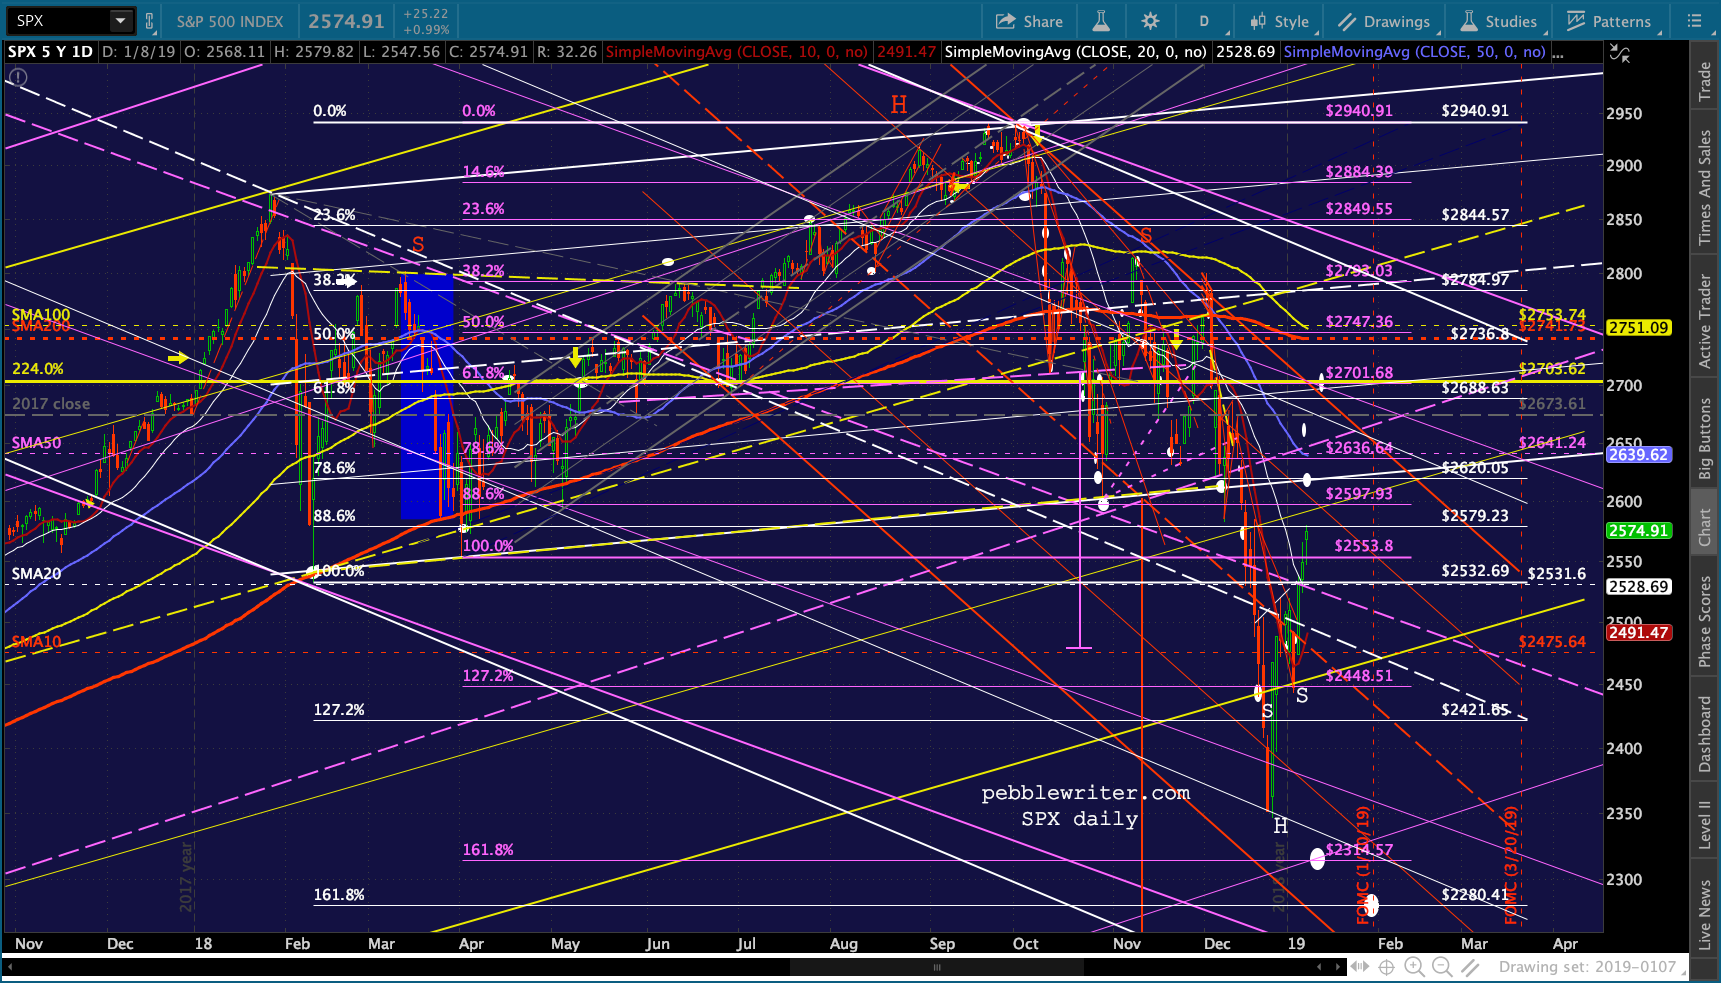
 Just 31 points for SPX to reach its neckline.
 USDJPY hasn’t broken out, but neither has it broken down.
 CL is still angling higher, probably putting the backtest off until after the close.
 RB is magically back above the SMA20.
  And, VIX is being VIX, shedding just enough to keep stocks on the rise.