FOMC Flameout!
Not to be outdone by the Fed, we are having our own big event. Be one of the first 10 to subscribe to a regular Annual Membership and enter the code “FOMC” in the space provided for a massive $1,000 savings the first year.
Or lock in your savings for life with a Charter Annual Membership – only $200 more. Either way, it’s a great way to save while enjoying the best market forecasting available.
This offer is limited to the first 10 new or upgrading members. As always, if you’re upgrading within the first 30 days of a new membership, we’ll rebate the price of your initial subscription up to $250.
NOTE: Thanks to all who submitted an entry in our contest to guess today’s SPX close. The guesses ranged from 1900 to 2137.02 — a pretty wide range! I’ll announce the winner in this space right after the close.
* * * * *
Congratulations to our grand prize winner Aaron Z. of Colorado. Aaron’s estimate of 2071 was only 1.89 away from the actual close. Great job, Aaron! Congratulations also to runners up Natasha S. at at 2070.28 and Scott B. at 2080.51!
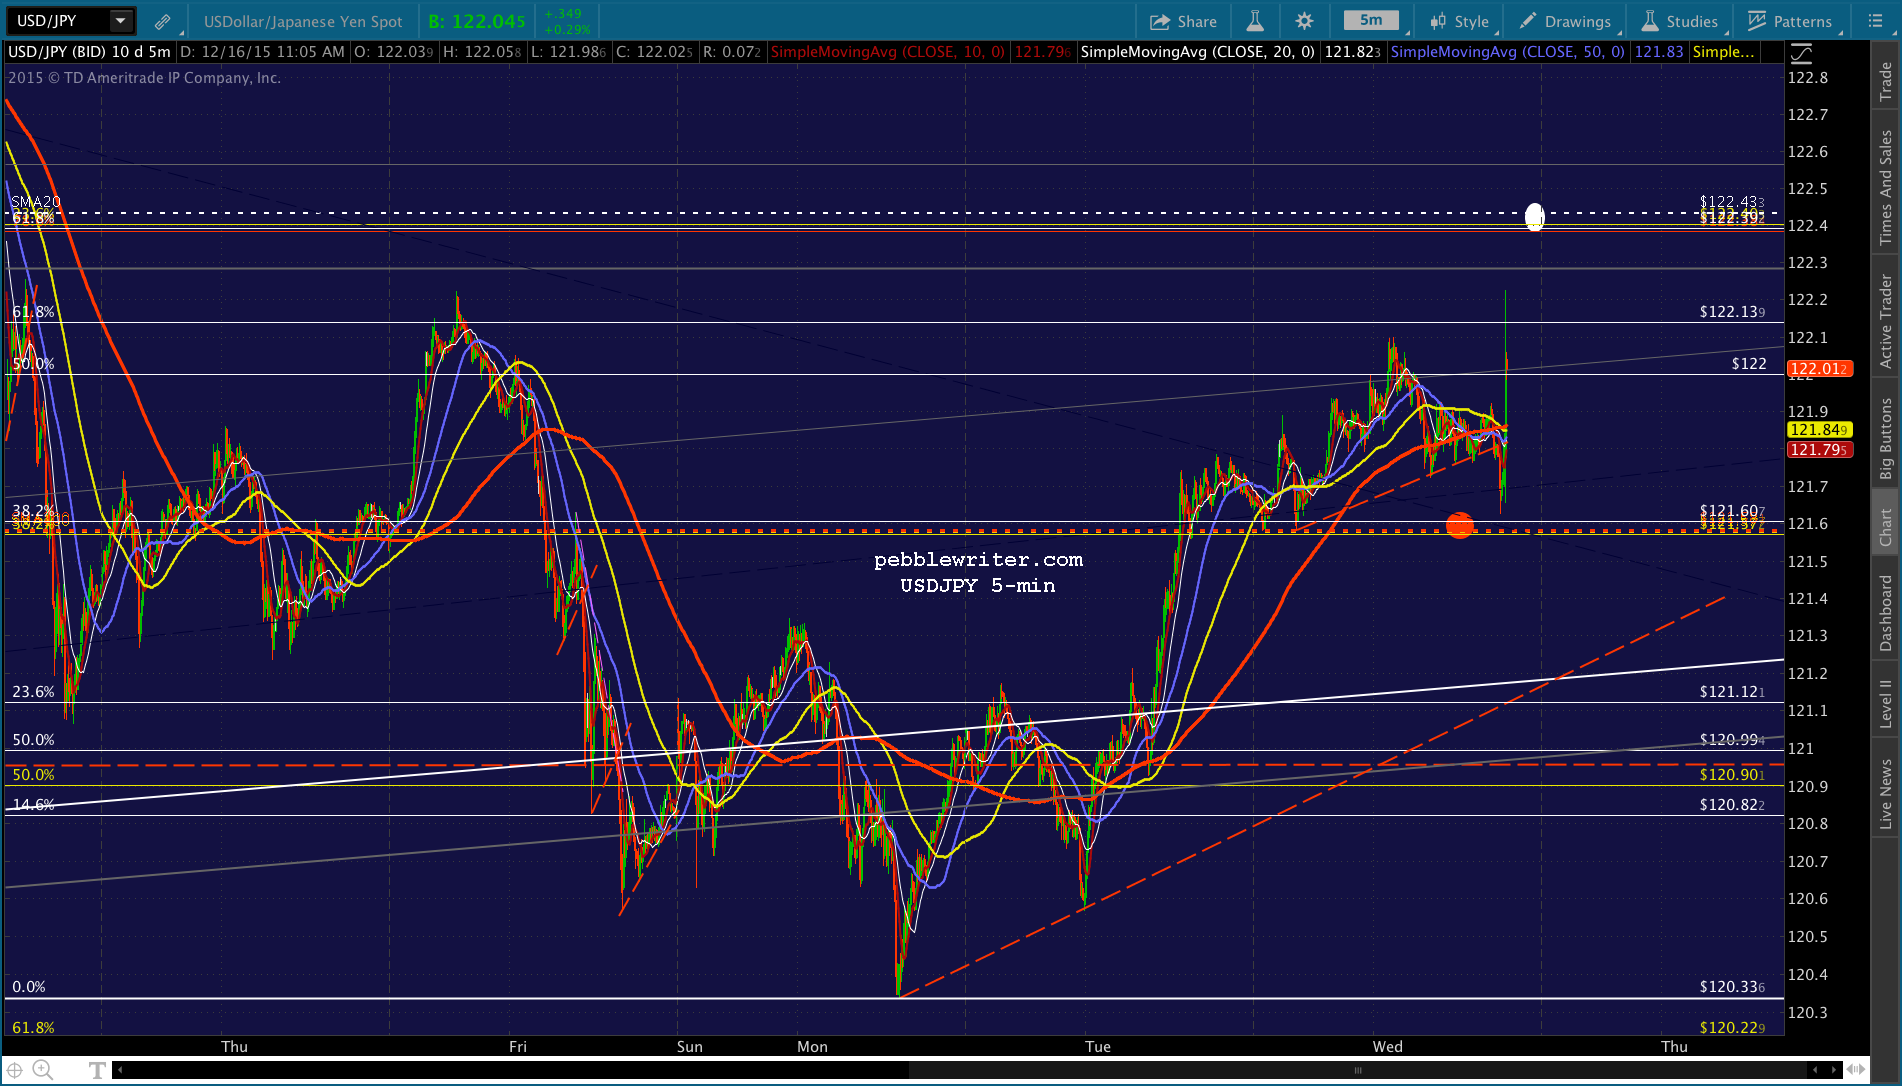
If this were any other day, I’d say TPTB have the “markets” set up for a nice spike. USDJPY has been pumped up over the SMA100 and SMA200 (now virtually on top of one another)… … CL has bounced sharply off the falling red channel bottom…
 … and, ES was ramped 12 points higher overnight.
 But, as we know, it’s not just another day. It’s the day the Fed gets to demonstrate just how wise they are, how much control they have over the vagaries of the markets. After all, they’ve tripled the S&P 500 over the past six years. We should trust them to triple it again, and again, and again.
The only problem is that the mechanism that produced all those gains is getting very long in the tooth. Though interest rates are a component, the mechanism that really matters is still the yen carry trade. The USDJPY has gone nowhere over the past year since arriving at current levels. Hence, stocks have gone nowhere — particularly since completing the Big Butterfly Pattern in May. At the time, we noted it was the last big Butterfly, and it ushered in a nice sell-off as we expected.
continued for members…
The 12.5% correction qualified as meaningful, and even managed to stall the Fed’s rate hike until today. And, the subsequent 13.3% recovery to complete a Bat Pattern went pretty much according to plan. They even constructed a well-formed rising white channel for those of us who like pictures.  Two days ago, SPX backtested the red TL off the July 20 highs (again, the first time was a month ago.) And, now the “death cross” is poised to uncross tomorrow (it already has for ES.)
 Why all the doom and gloom surrounding a 25 bps rate hike? There’s no question that, in a world awash in trillions of dollars of debt, higher interest rates would be a real drag on earnings for corporations, and cash flow for both individuals and governments.
They should also affect valuations, as the present value of future earnings declines when we assume a higher discount rate. And, if high enough, they present viable alternatives to equities when allocating assets.
But, a 25 bps increase — if the Fed is successful in pushing it through — wouldn’t matter much in any of those respects. At this point, it’s purely symbolic. It’s an attempt to convince the investing world that they haven’t lost control — that things aren’t so horrid 7 years after the crash that ZIRP is still required. That’s it.
And, if enough investors freak out and sell their stocks, and the “markets” go haywire, the Fed can always walk back this and any subsequent hikes.
What about the here and now? Will stocks sell off sharply? It seemed like it the past few days, in what appeared to be a warning shot by Wall Street across the Fed’s bow. Fortunately, we have some clear markers by which to gauge whether or not that will occur: the SMA100, the rising white channel bottom and that dashed red TL.
There are several logical targets down below should it occur, with the most prominent being the yellow .618 at 1965.34 and the yellow .786 at 1924.25 — also the bottom of the purple channel. Below that, things start to get dicey.
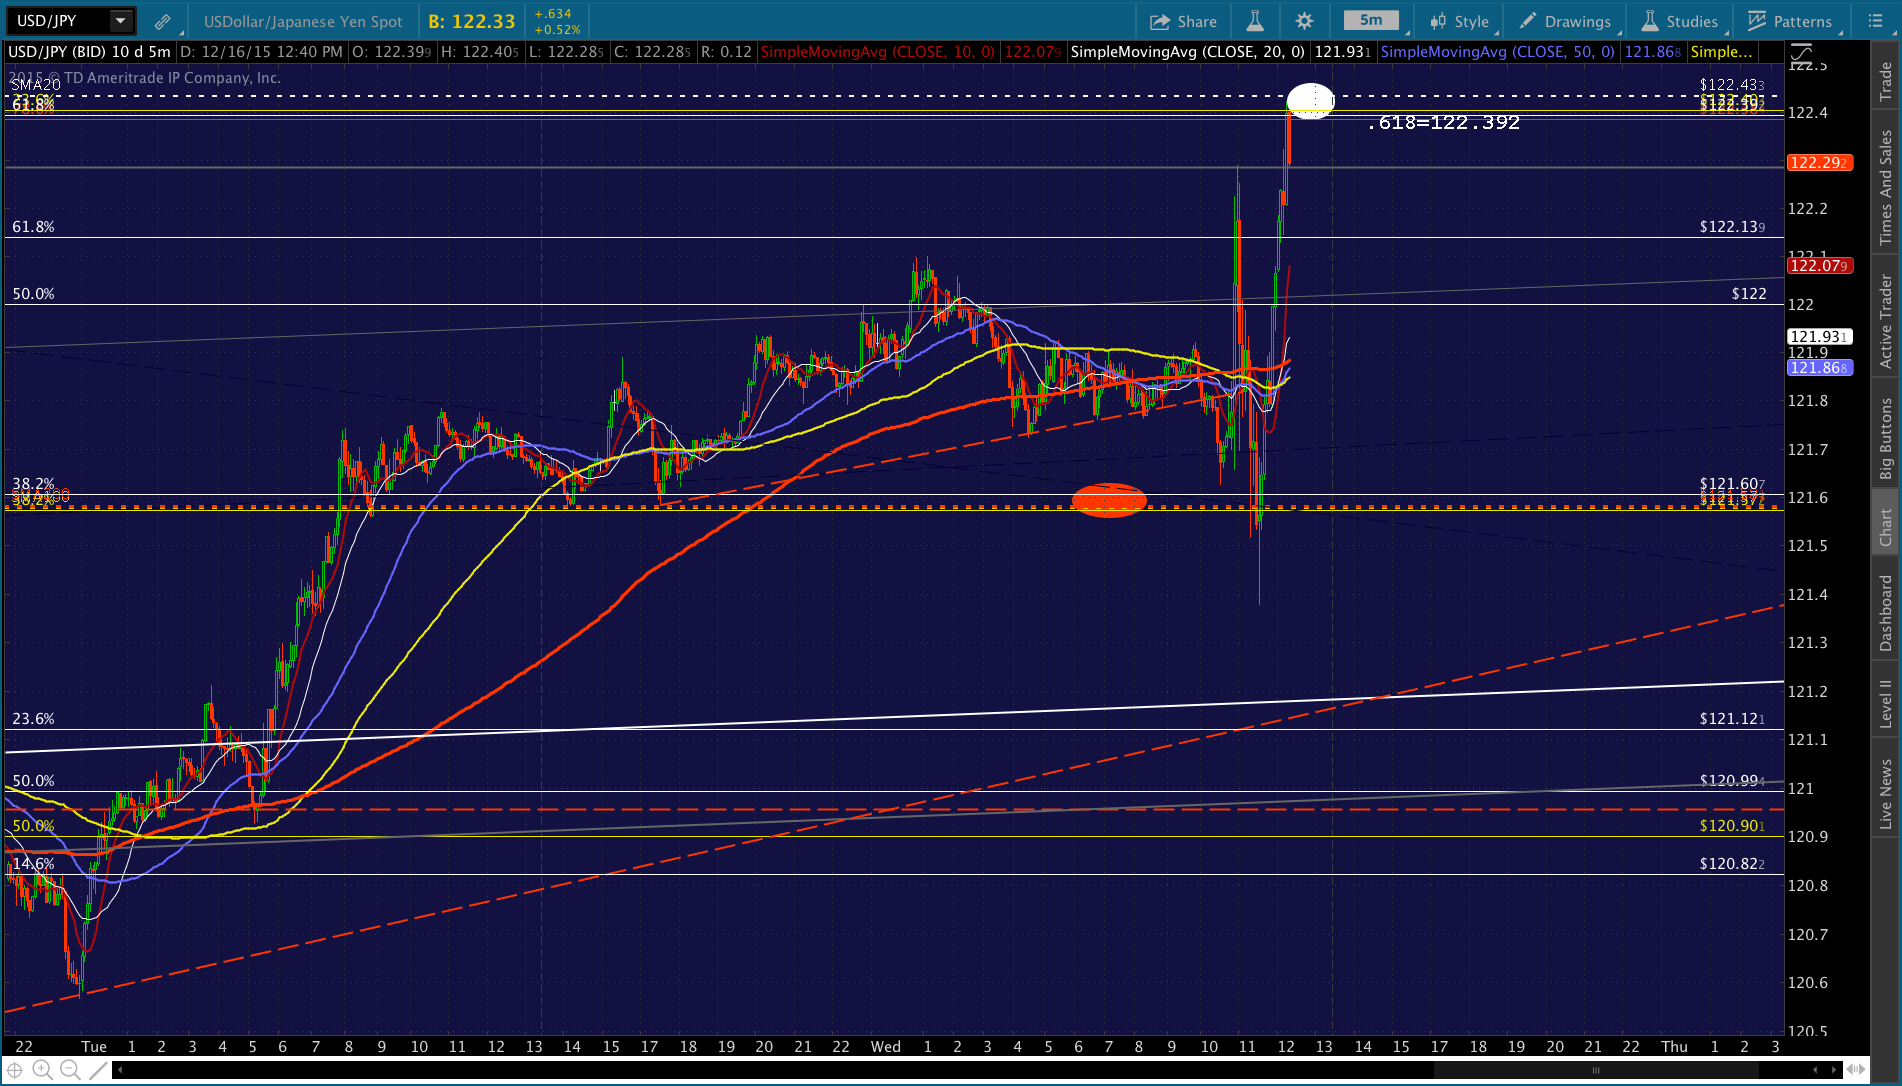
But, let’s focus on the upside for a change. As mentioned Monday, USDJPY bounced off the white channel bottom for the third time in four months. The previous times, Aug 24 and Oct 15, led to impressive rebounds for stocks.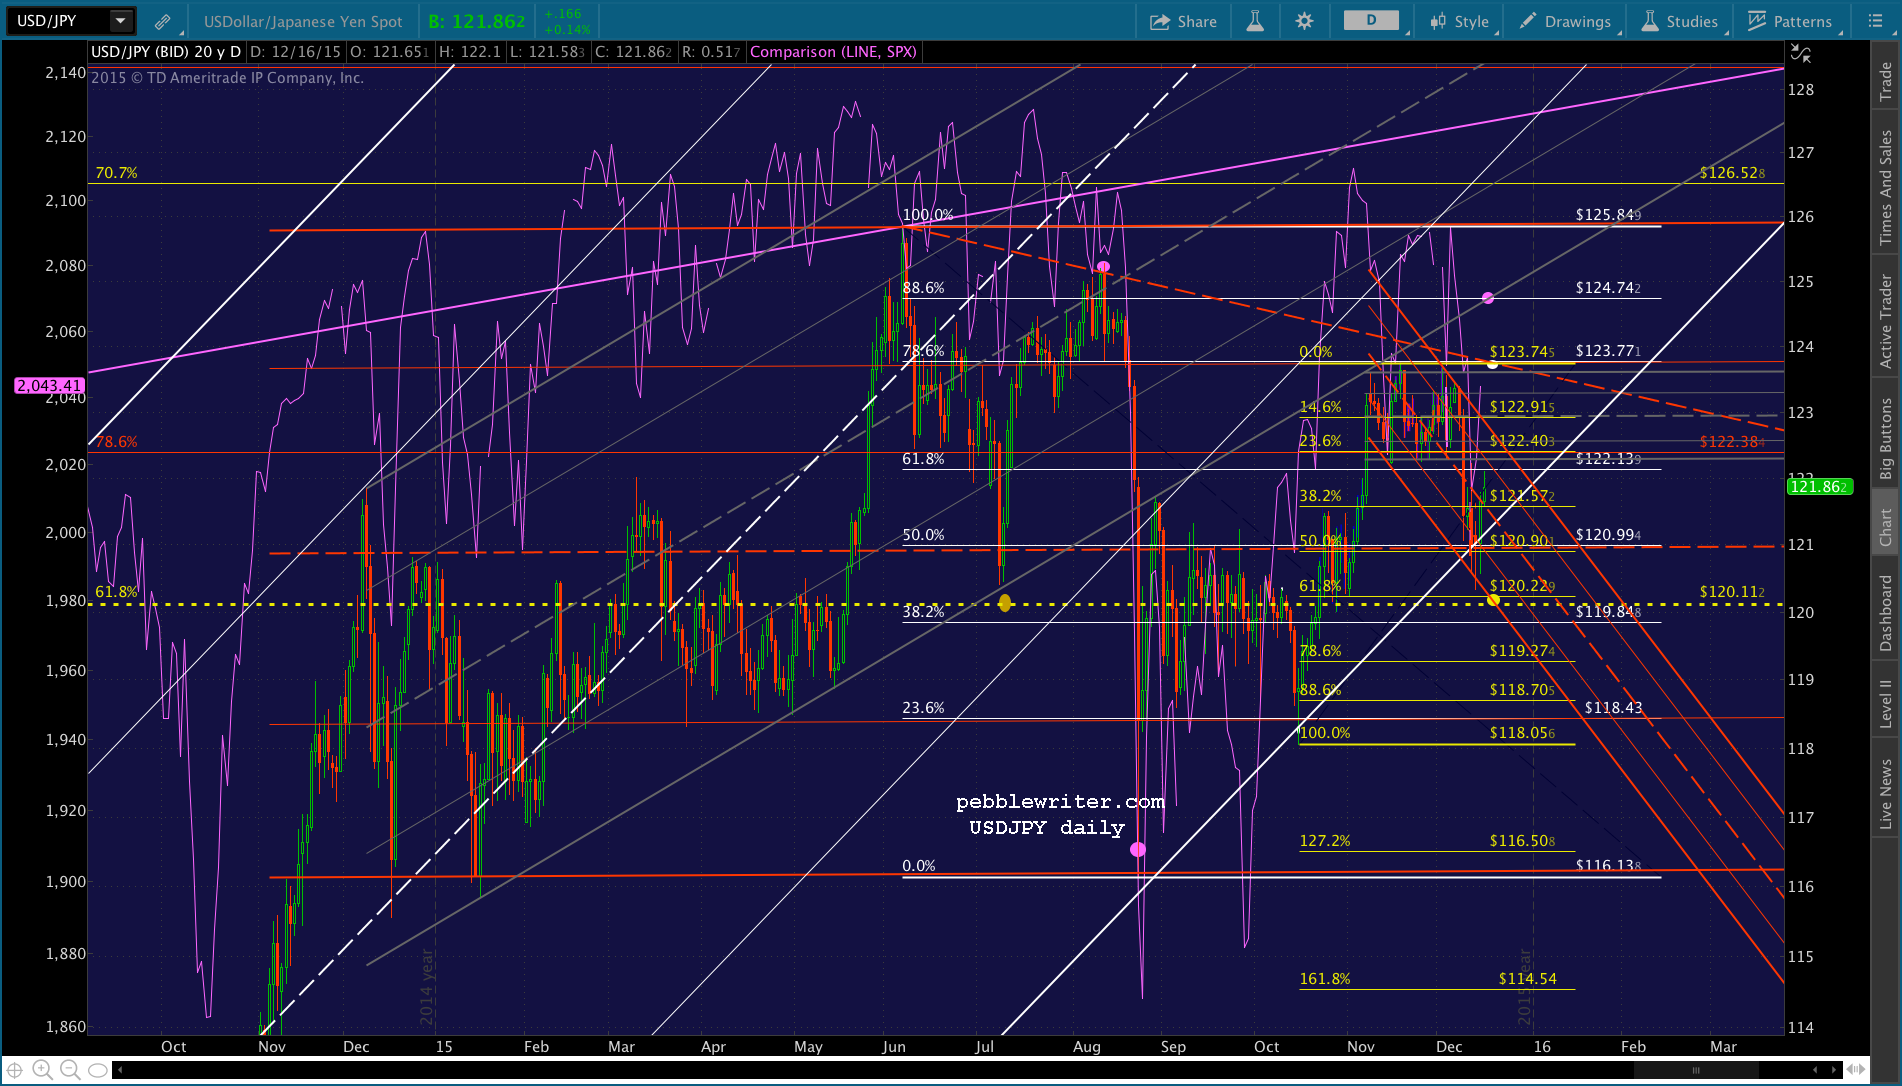 Now, like then, USDJPY has pushed up through the SMA100 and 200 — not to mention the all-important .618 Fib at 120.11. Should equities slide after the Fed announcement, they should provide adequate support.
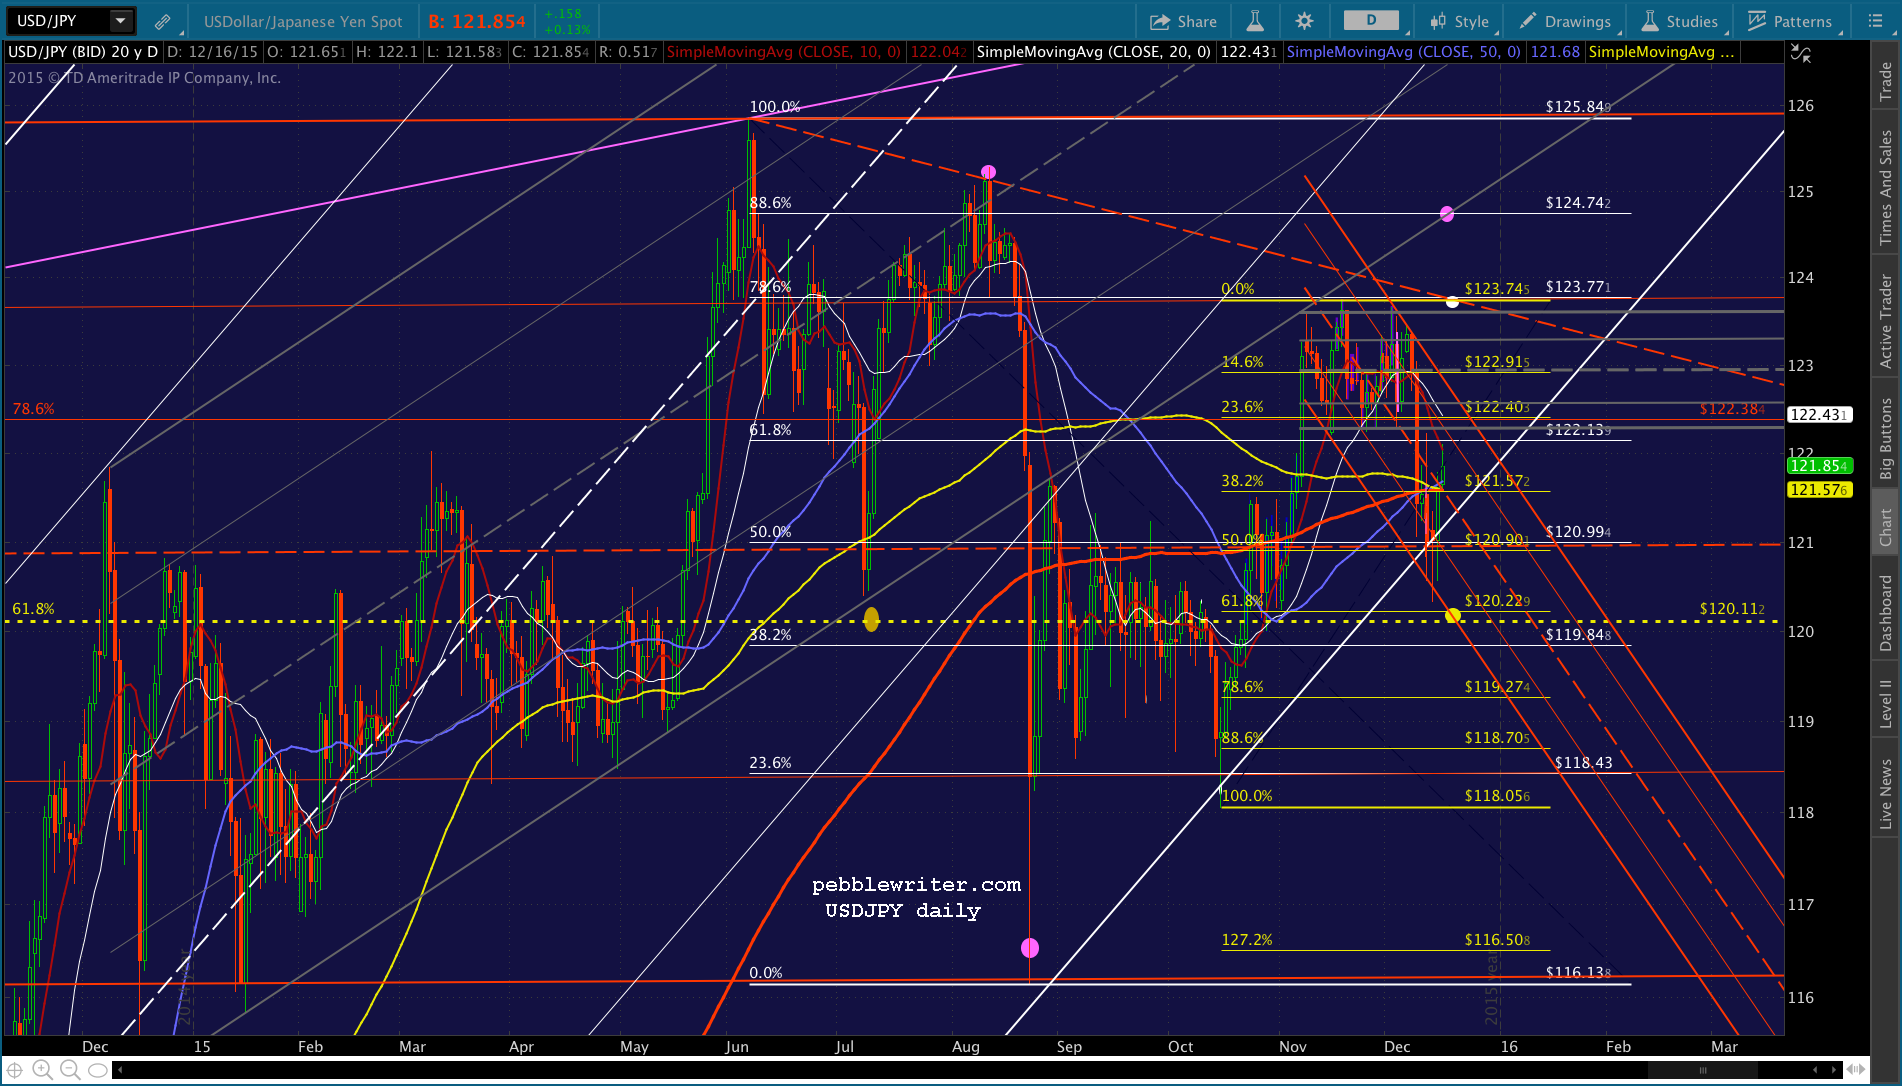 And, there are multiple upside possibilities for the pair should TPTB need to reverse a slide, including the white .618 at 122.39, the top of the red channel (currently near the white .786 at 122.95), and the big prize — the larger scale .886 up at 124.74.
 It would be a 2.4% rise from current levels, and would almost certainly prop stocks up nicely. And, in my opinion, it offers the greatest opportunity for SPX to make new highs.
By going sideways for the past few months, USDJPY has more room to run up to new highs without breaching the purple channel bottom that it reversed off of on June 5. The white .886 at 124.74 (purple dot) would break the falling red TL (which would be recognized as pretty bullish) but needn’t retake the rising gray channel.
A push up into the rising gray channel to tag white dot up at 127.58 around the new year would be exceedingly bullish. I have no idea whether TPTB have planned such a move, but it seems plausible given how far oil prices have dropped.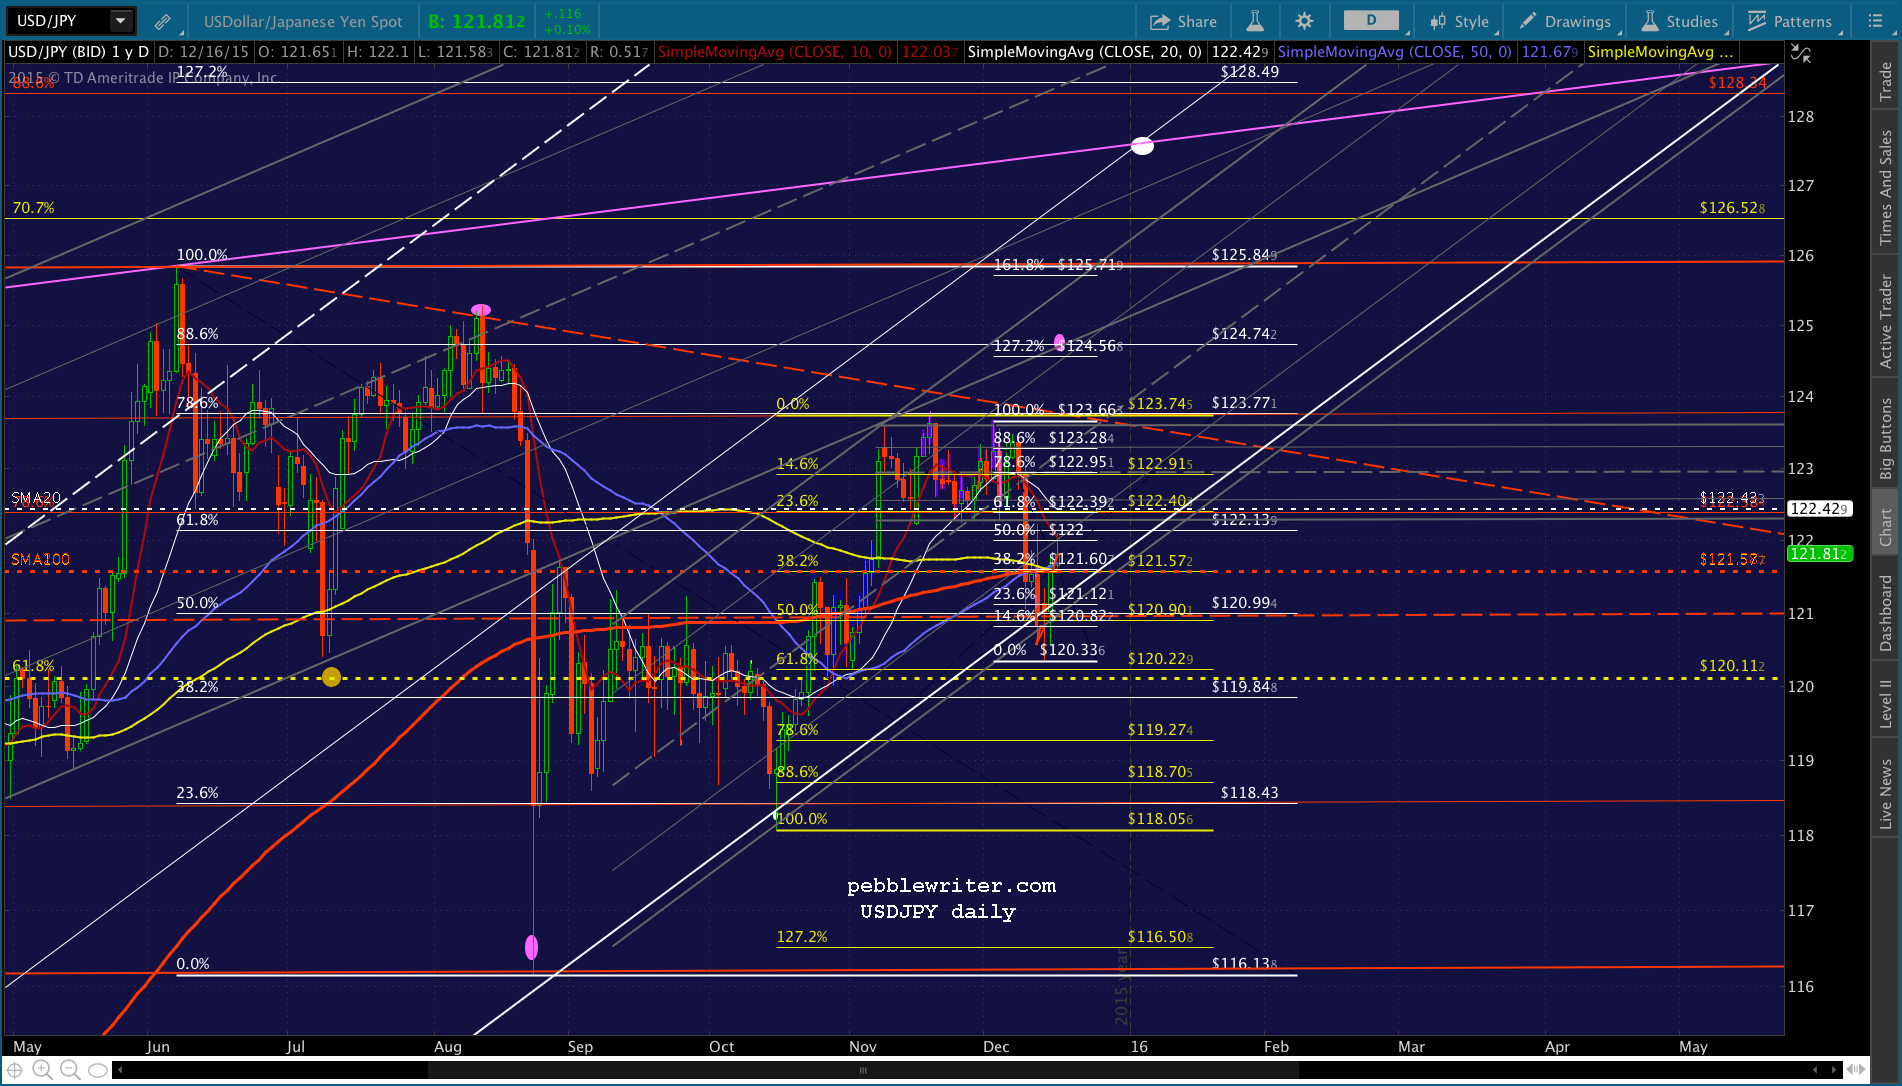 If it were to occur over the low-volume holidays as in 2013, the algos could easily push SPX past 2138 (a 4.3% gain from current levels.) And, once that key Fib level was exceeded, it would be a fairly simple matter to let USDJPY settle back down while defending 2138 with a steadily rising CL.
If SPX can reach even 2112, ideally around Dec 22, then it will have completed a huge IH&S Pattern that targets 2379. I suspect that once it breaks out over 2138, the gains would come pretty quickly.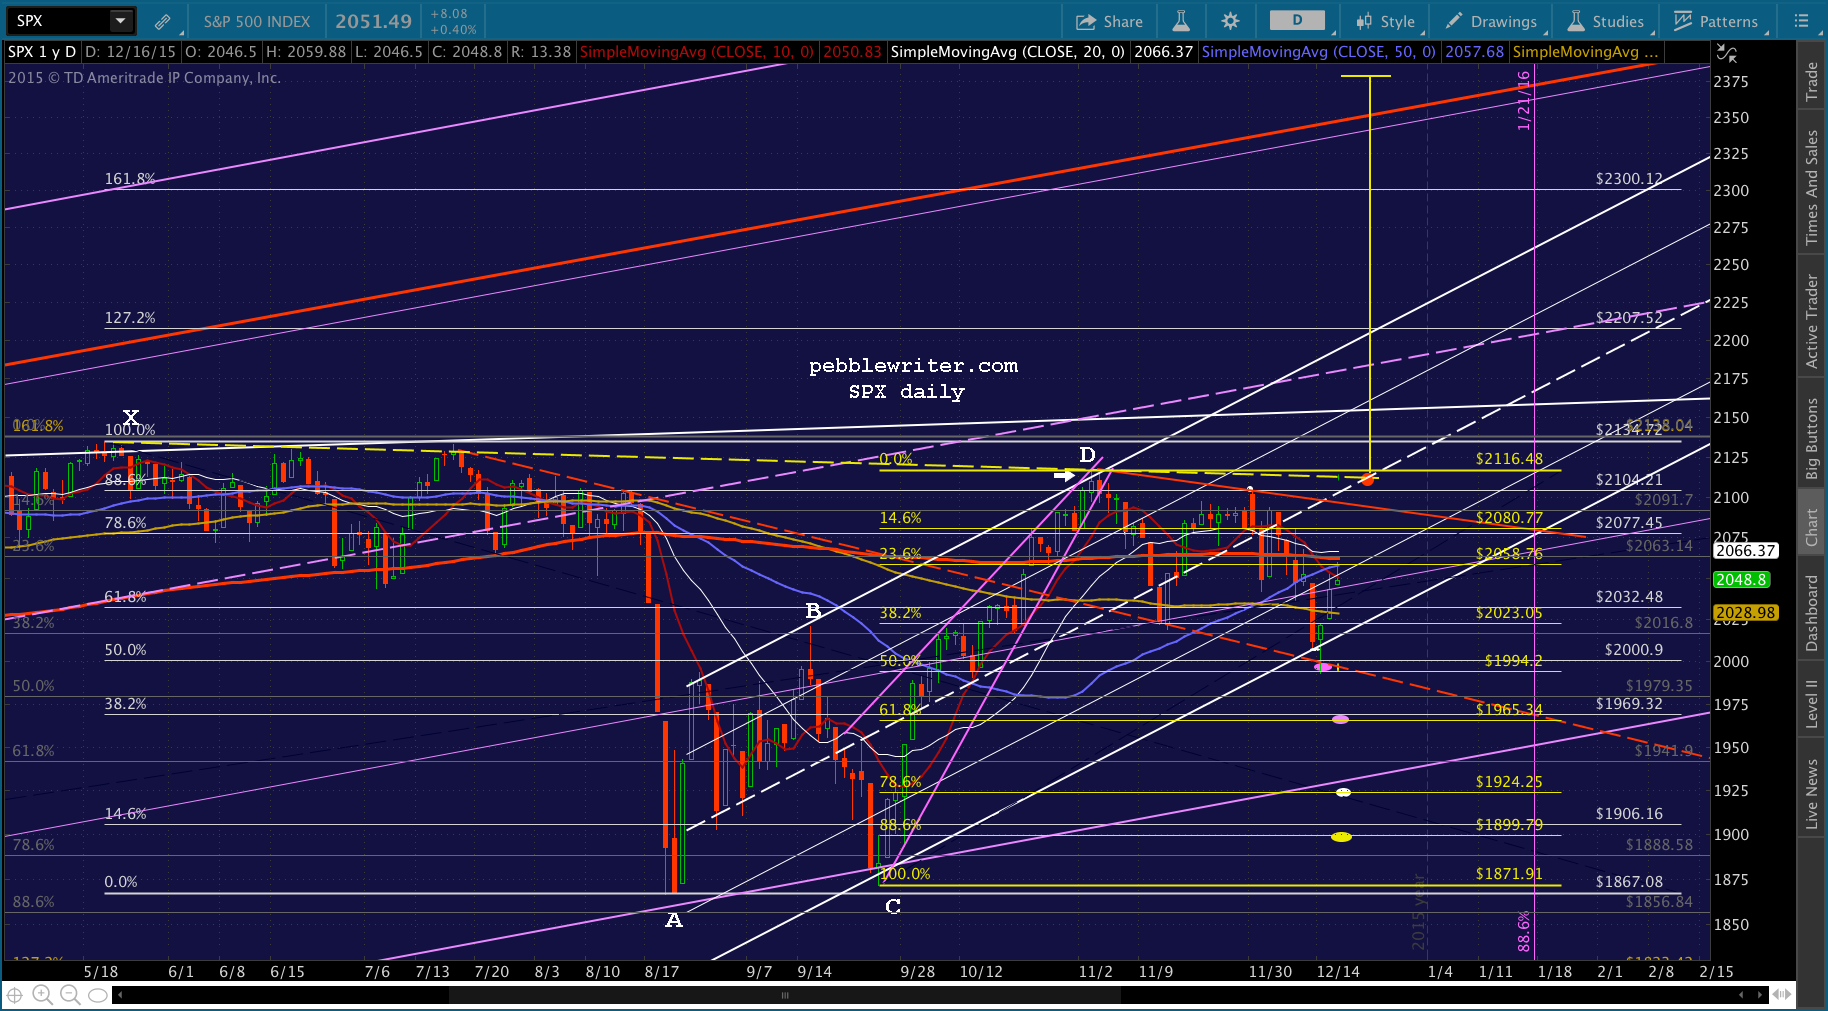 Combining all these factors, will TPTB be successful in keeping the bull market alive? My guess is that they will. I think they’ve proven their ability to lever stocks higher with USDJPY and CL. And, I don’t see anything getting in the way of that mechanism right now.
Down the road, I imagine there will be serious problems with it. USDJPY can’t go up forever without skewering the Japanese people and those companies that rely on imports. And, CL can only offset an ever-cheaper yen so much before it starts to jeopardize oil majors and banks. But, that’s a problem for another day — just like the impact of truly higher interest rates.
UPDATE: 11:23 AM
I don’t like to trade on FOMC Statement days. The volatility can be enormous. And, you have to nail the timing if you don’t want to get whipsawed to death. Nevertheless, I’ll post some short-term charts for those who are trying to read this morning’s tea leaves.
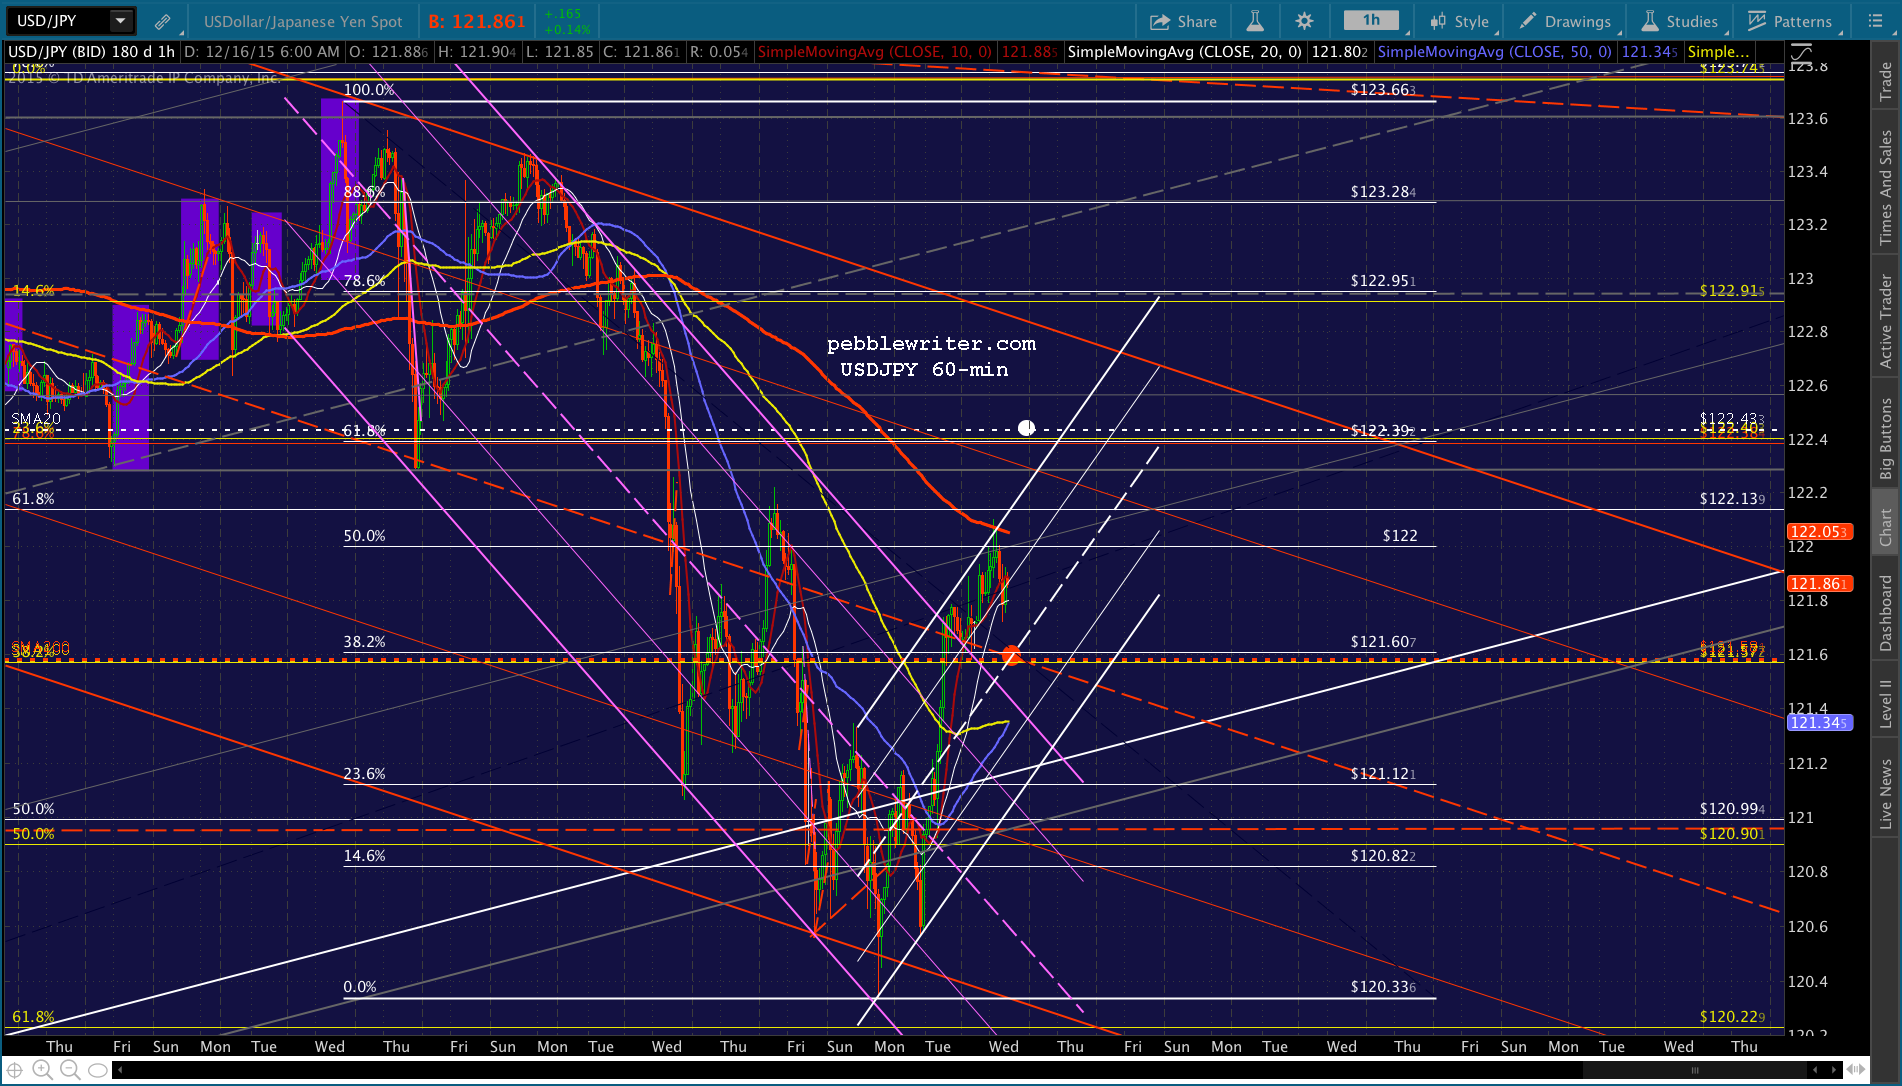
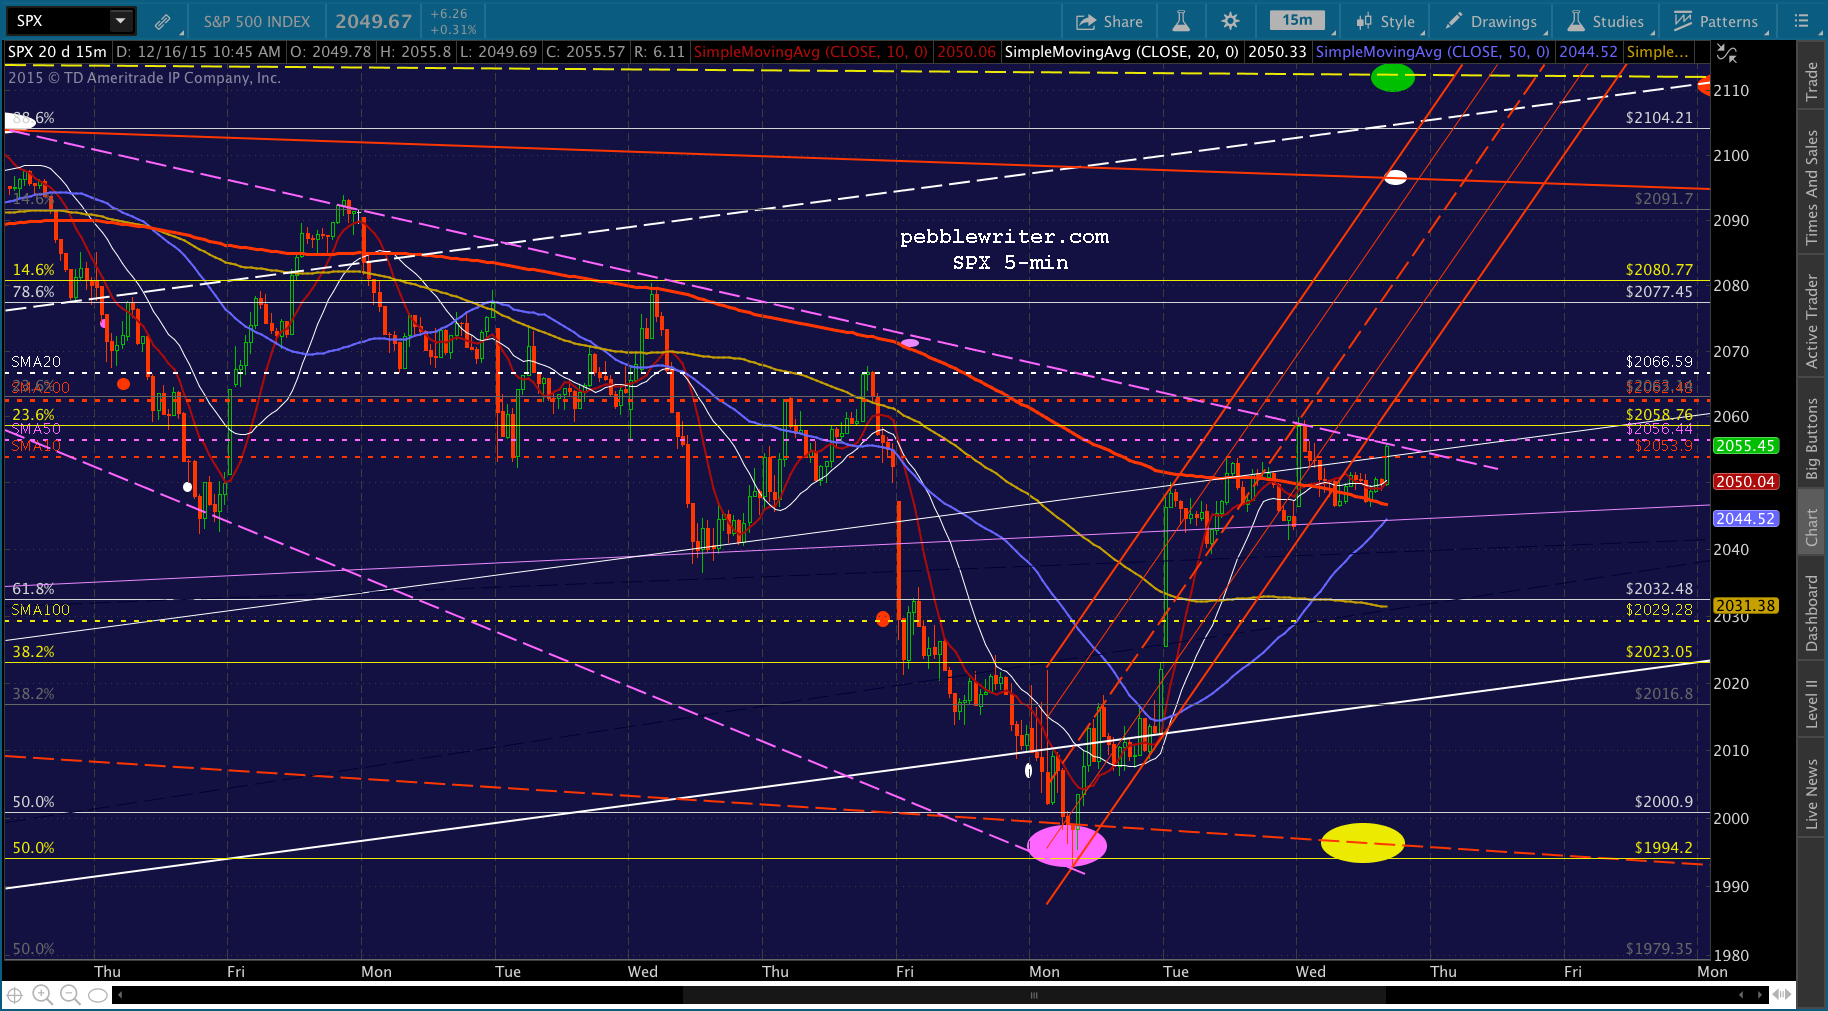
SPX is threatening to break its rising red channel. While USDJPY is also threatening to break down.
 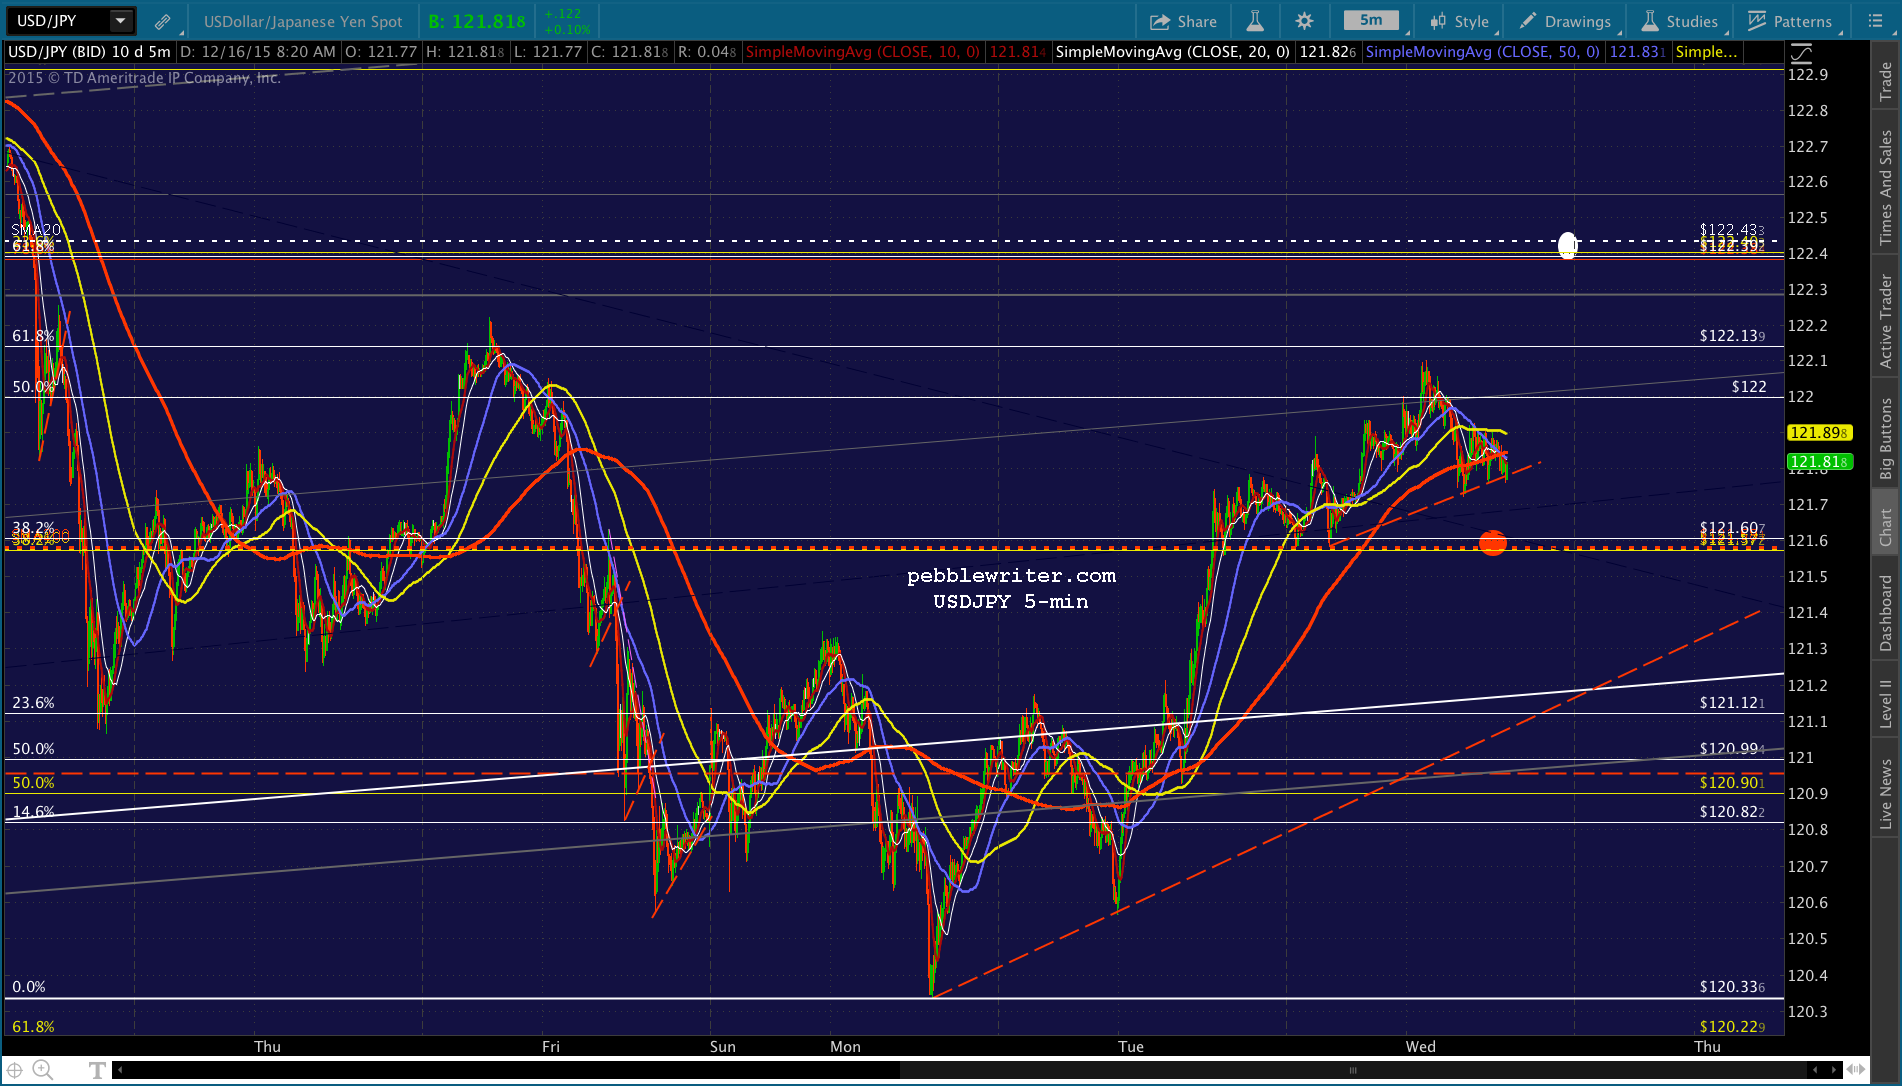 And, CL has already started falling — but, as we’ve seen many times, is capable of turning on a dime when called to.
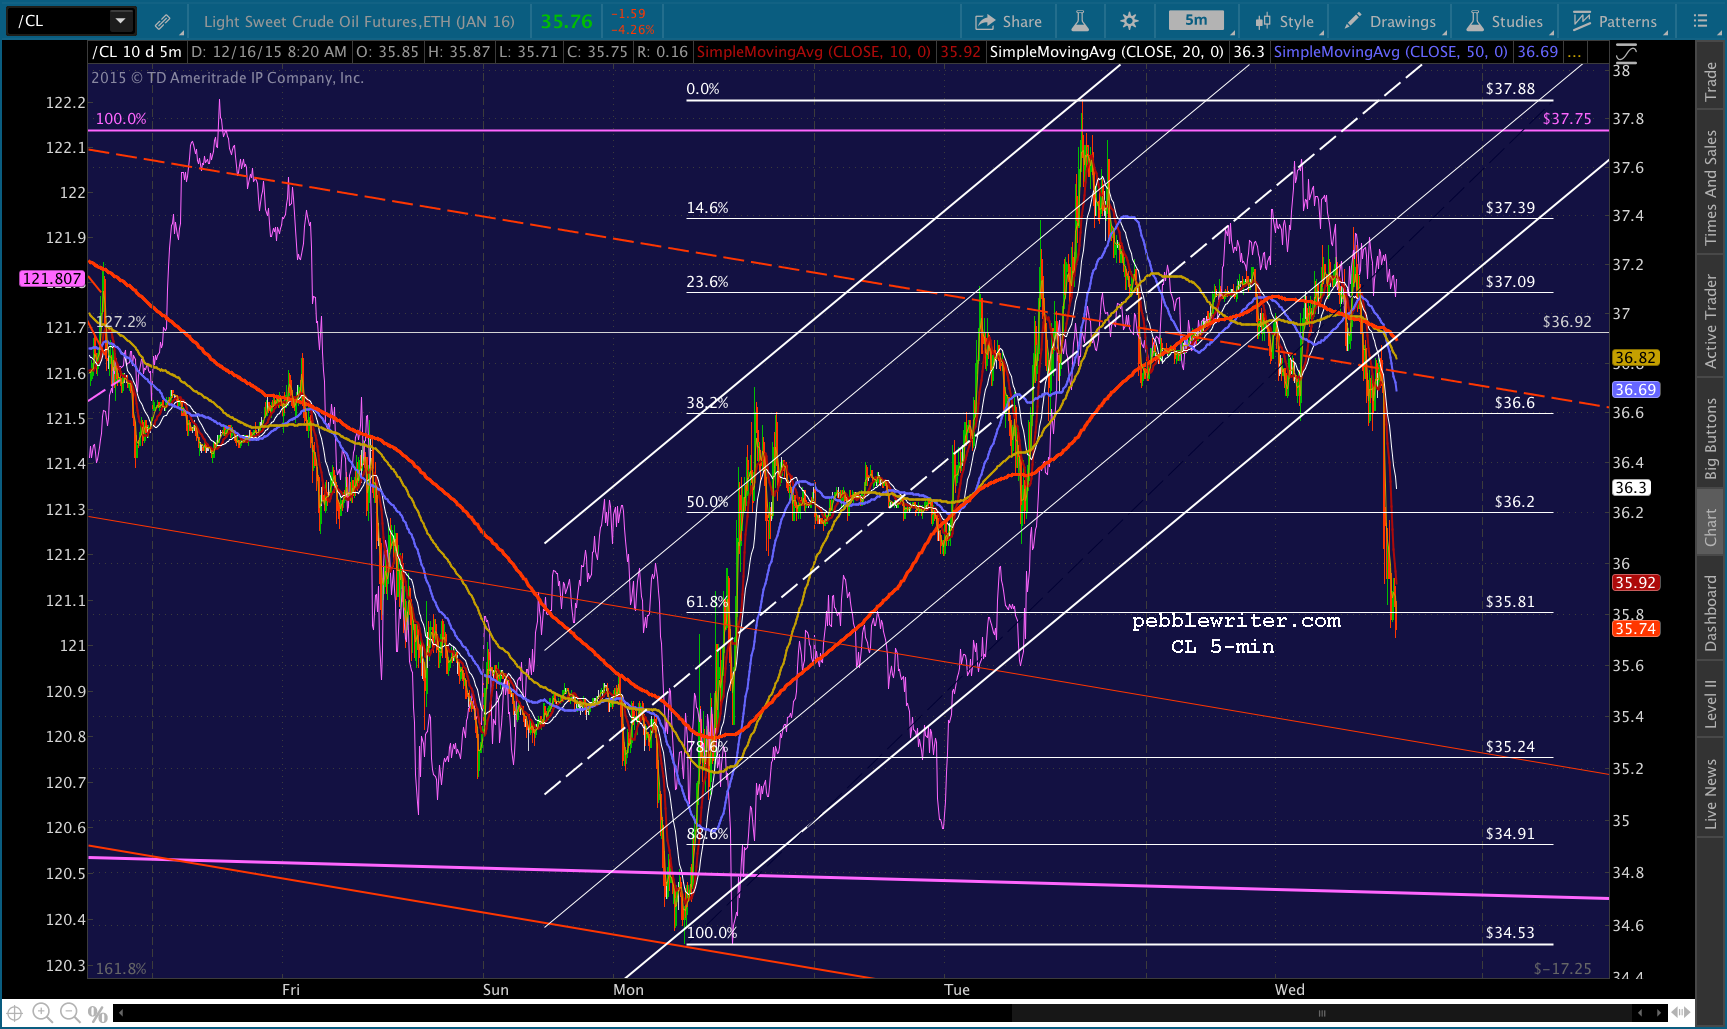 I think ES is probably the most telling index. The rising red flag pattern is pretty well-formed, and should be a good indicator of when things are breaking down. A dip below the bottom is obviously a selling opportunity, while a bounce there represents plenty of upside potential.
 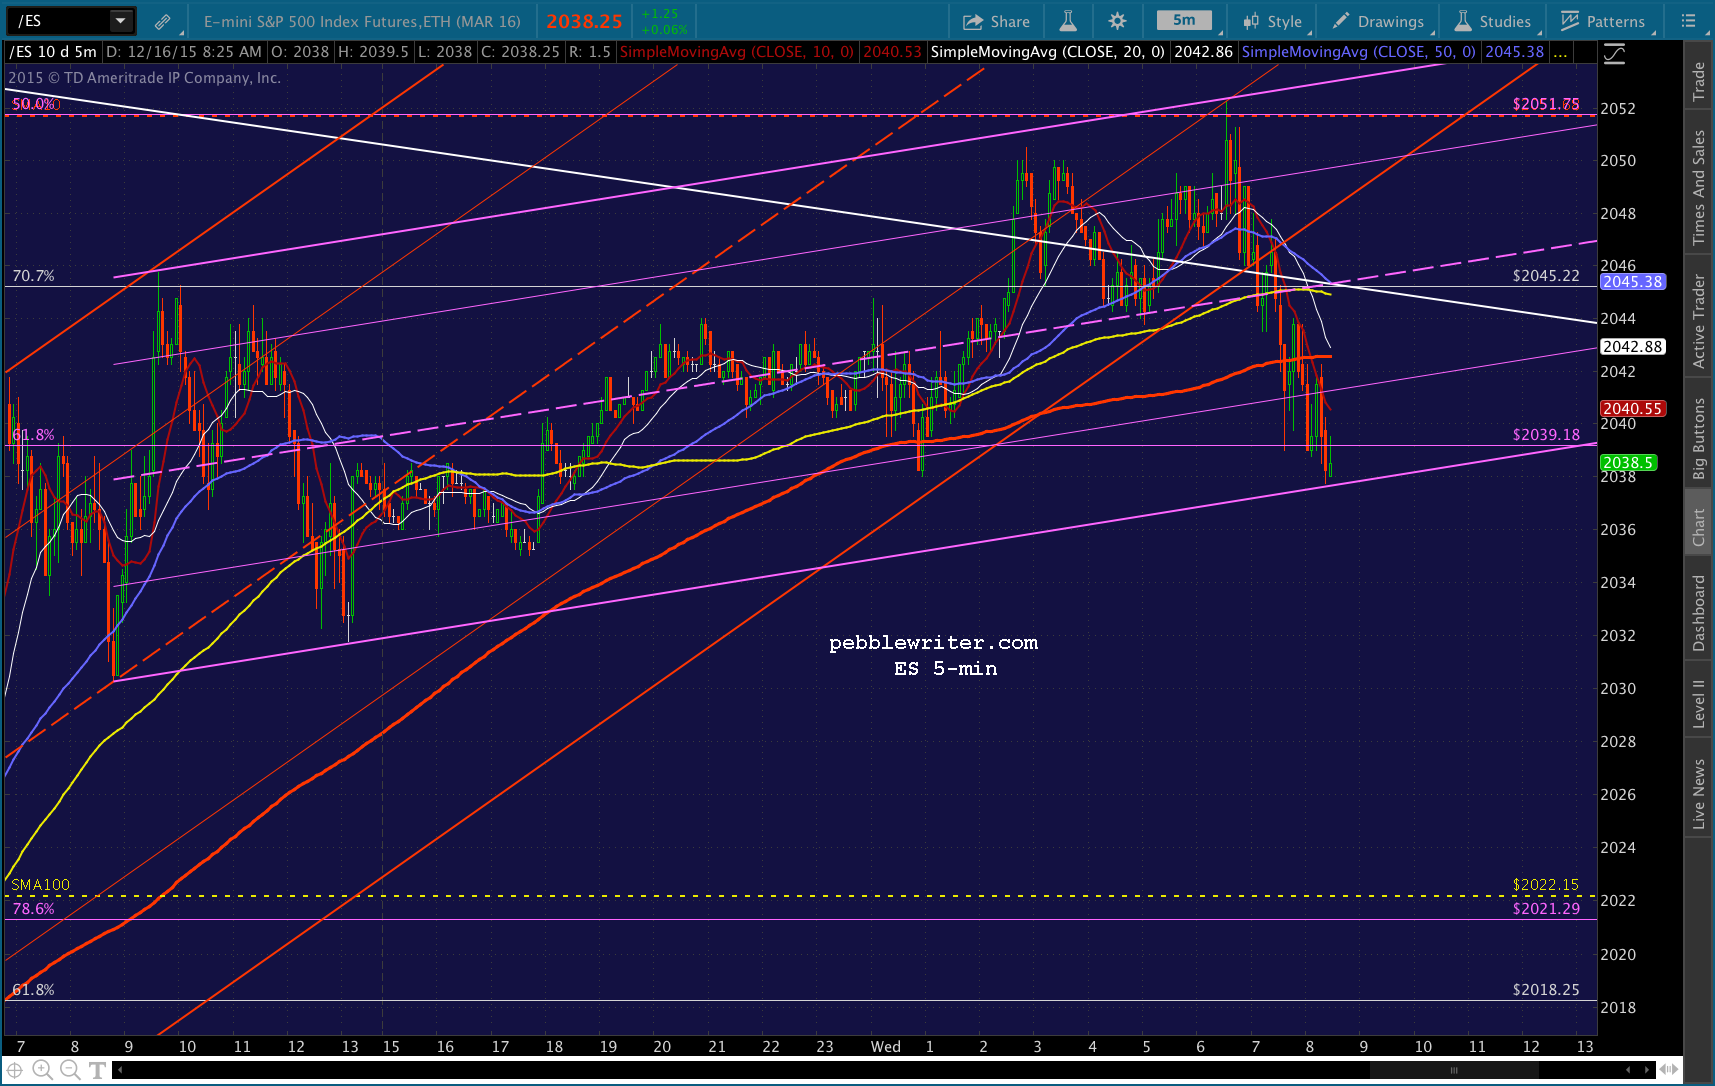 UPDATE: 12:45 PM
It’s been over an hour since I posted those last charts, and essentially nothing has happened. One note: I neglected to mention the SMA100 earlier. At 2029.28, it would represent a modest sell-off that could help shake out traders before a possible ramp into the close. I’ll post again after the announcement. UPDATE: 1:59 PM
 UPDATE: 2:05 PM
Initial moves on what’s being called a “very dovish statement.” SPX has pushed through the purple TL and should test the SMA200 momentarily.
Pretty simple: any sustained push through the SMA200 should be viewed as bullish. If it’s rejected, there’s a good opportunity to short — but, once it drops back below the purple TL.

 UPDATE: 2:27 PM
It looks like SPX is likely to dip down to the white channel midline at the 5-min SMA200 — probably around 2038. I’d try a short position here with tight stops if SPX can push through 2052 or so. UPDATE: 2:57 PM
SPX breaking out instead. This should be the start of the press conference melt-up. Would go long here with tightish stops.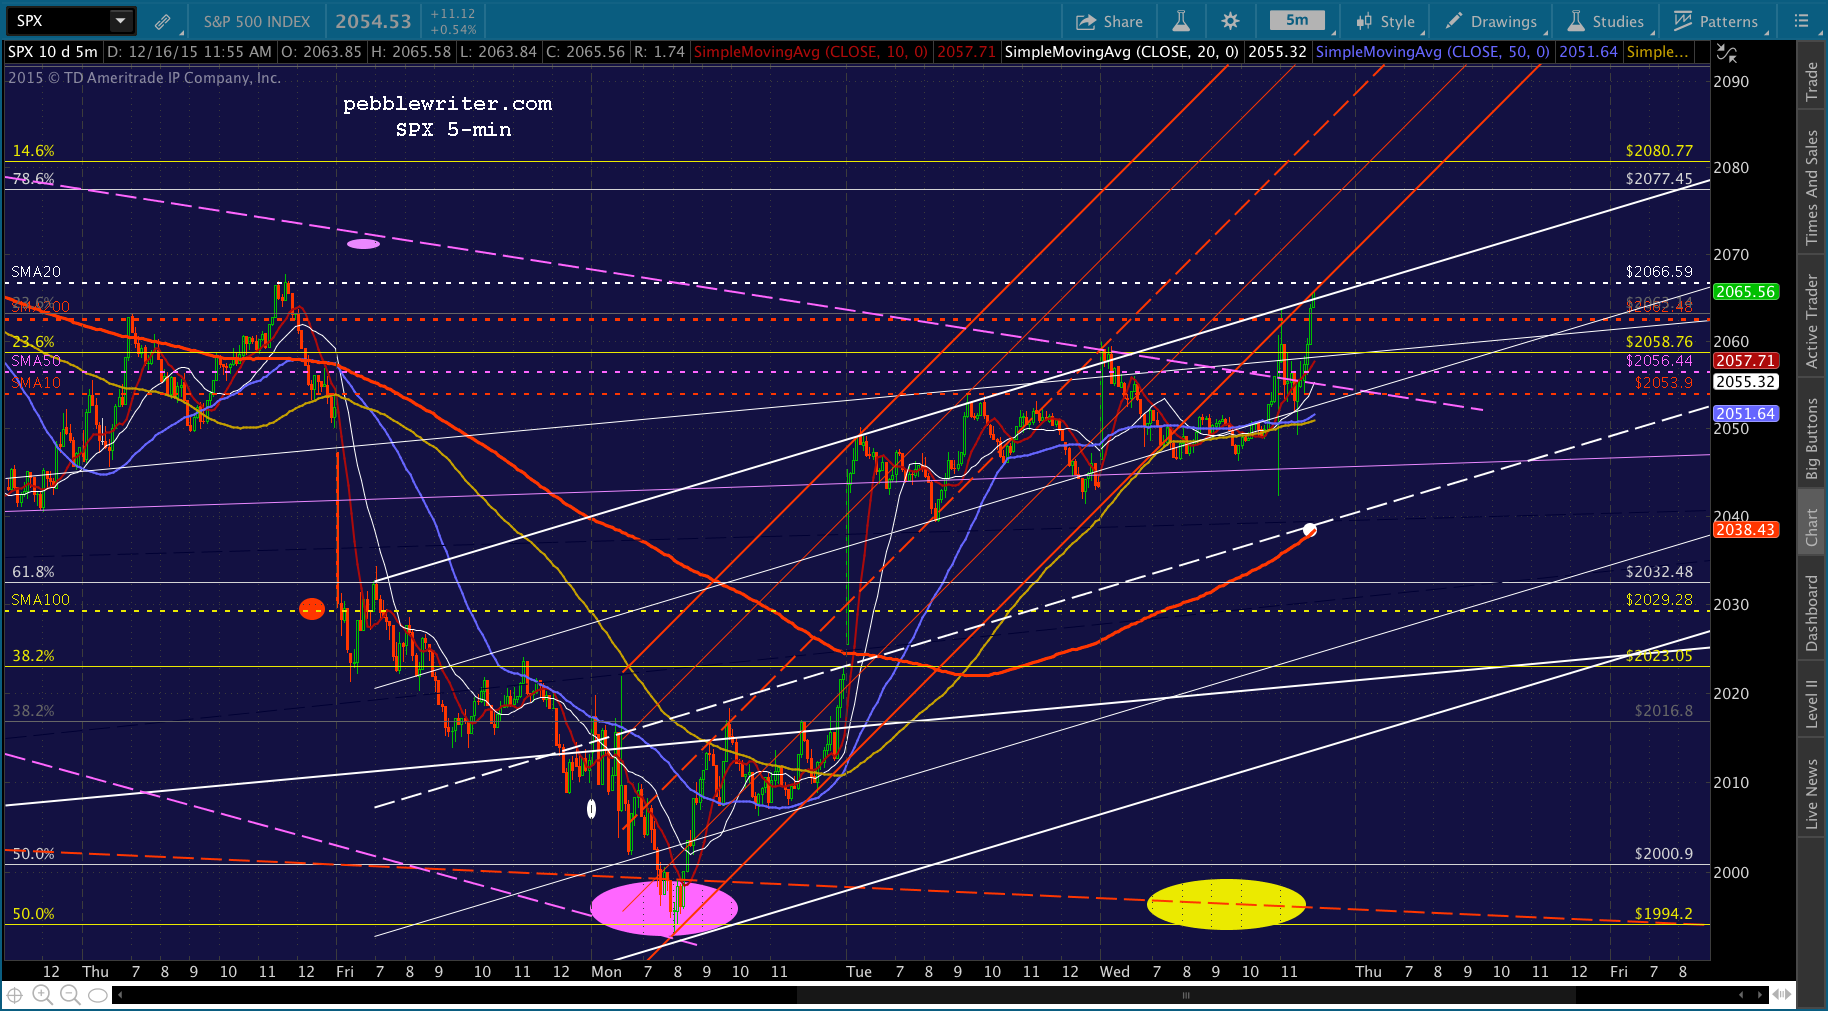 UPDATE: 3:42 PM
USDJPY just tagged and is reversing off its .618, so I’d expect SPX to pause or reverse here. I’d take profits and go to cash here. If it punches through, there’s upside potential to the red TL at 2097. A strong reversal, on the other hand, could backtest the SMA20 at 2066.59.