GC reached our next upside target on Wednesday, 2 weeks ahead of schedule. Remember, this is the neckline of a large Inverted Head & Shoulder Pattern with significant upside potential if it plays out.
If the past is any indication, it won’t — at least not yet.
 continued for members…Note that GC has failed to follow through on breakouts much more often than not. This neckline has been in play for 6 months, during which two significant channels broke down and GC decided to plunge below all its moving averages.
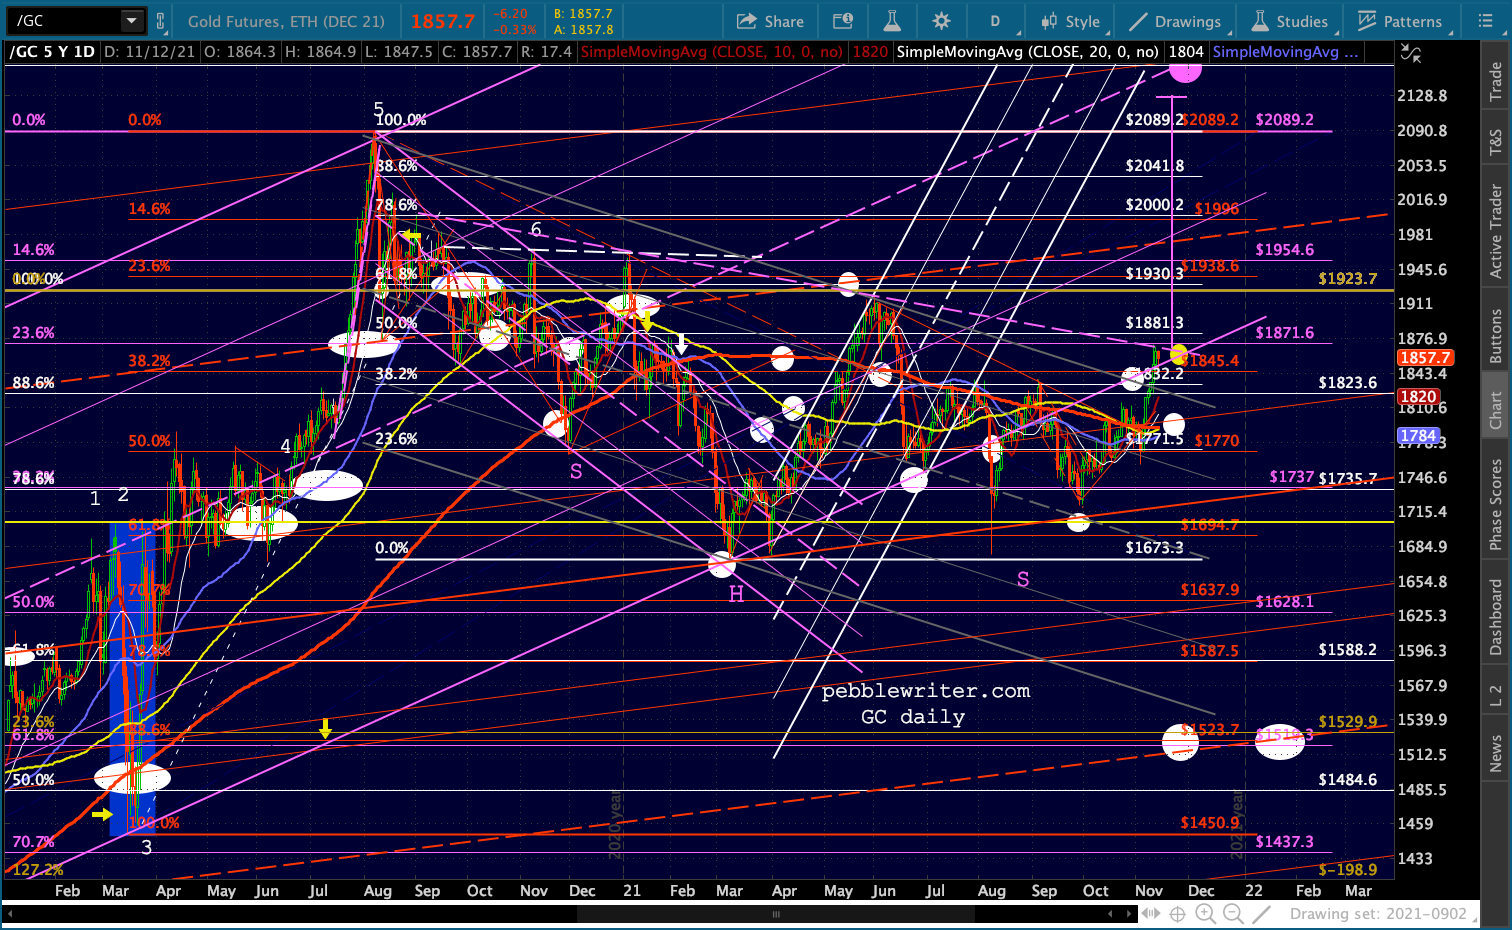 This followed a very long period of GC failing to break above the even more obvious yellow neckline.
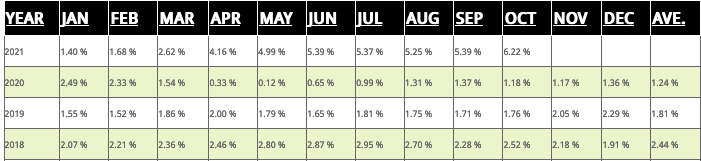
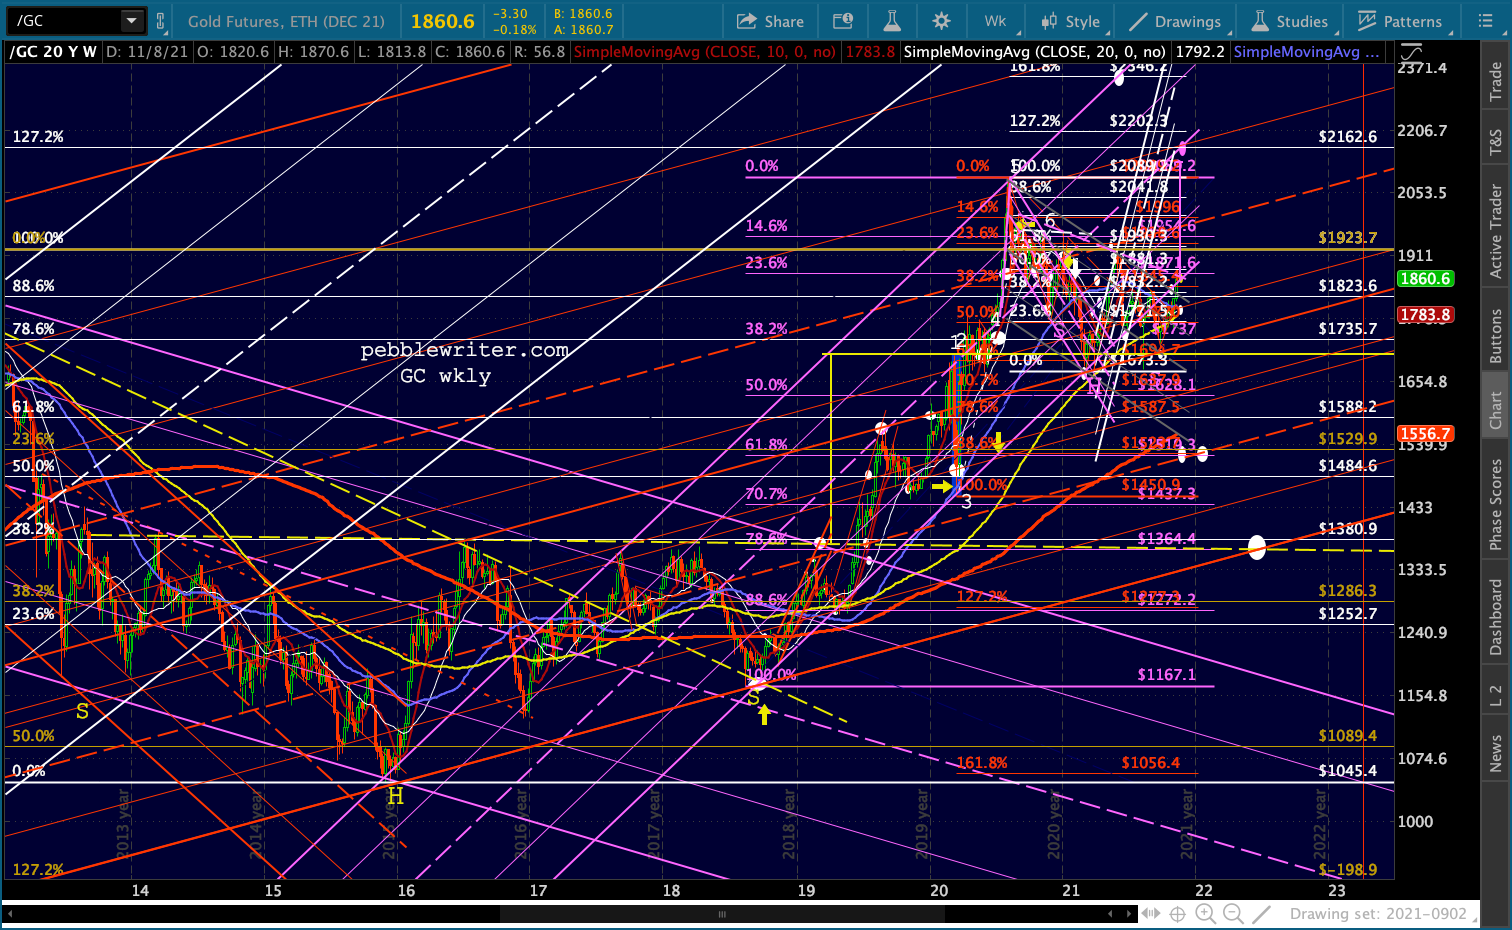 Pick your favorite break out or failure to break out and compare it to the inflation data provided below. At the end of 2018, oil’s crash brought inflation back under control. So, that failure to break out is logical.
GC’s biggest recent move, between Mar 20 and Aug 6 of 2020, occurred at a time when official inflation was AWOL. The rally between Mar 8 through Jun 1 of 2021 made so much more sense. But, why did GC collapse after June 1, just when CPI has picking up steam?
 Long-term readers know that I love a good conspiracy theory. And, gold is no exception. If you’re a central banker, you don’t necessarily want gold to crash (you own it, too!), but you are loathe to see it soar – underscoring your failure to keep inflation under wraps. You have a trading desk, so you use it. Simple as that.
The thing I love about necklines is their clarity. If GC rises above the purple neckline at 1870, it is meant to do bigger and better things. It’s a clear sign to go long, with equally clear stops back at the neckline itself. If it reverses instead, it’s a pretty clear sign to short – also with stops at the neckline.
It’s not that we can’t have headfakes. We do, quite often in fact. But, as long as we don’t mind changing sides from time to time during a period of indecision, profits are relatively safe.
Much has been made of BTC’s superior performance over the past few months. While true, it’s worth noting that BTC has also run into overhead resistance in the form of the rising yellow channel top.
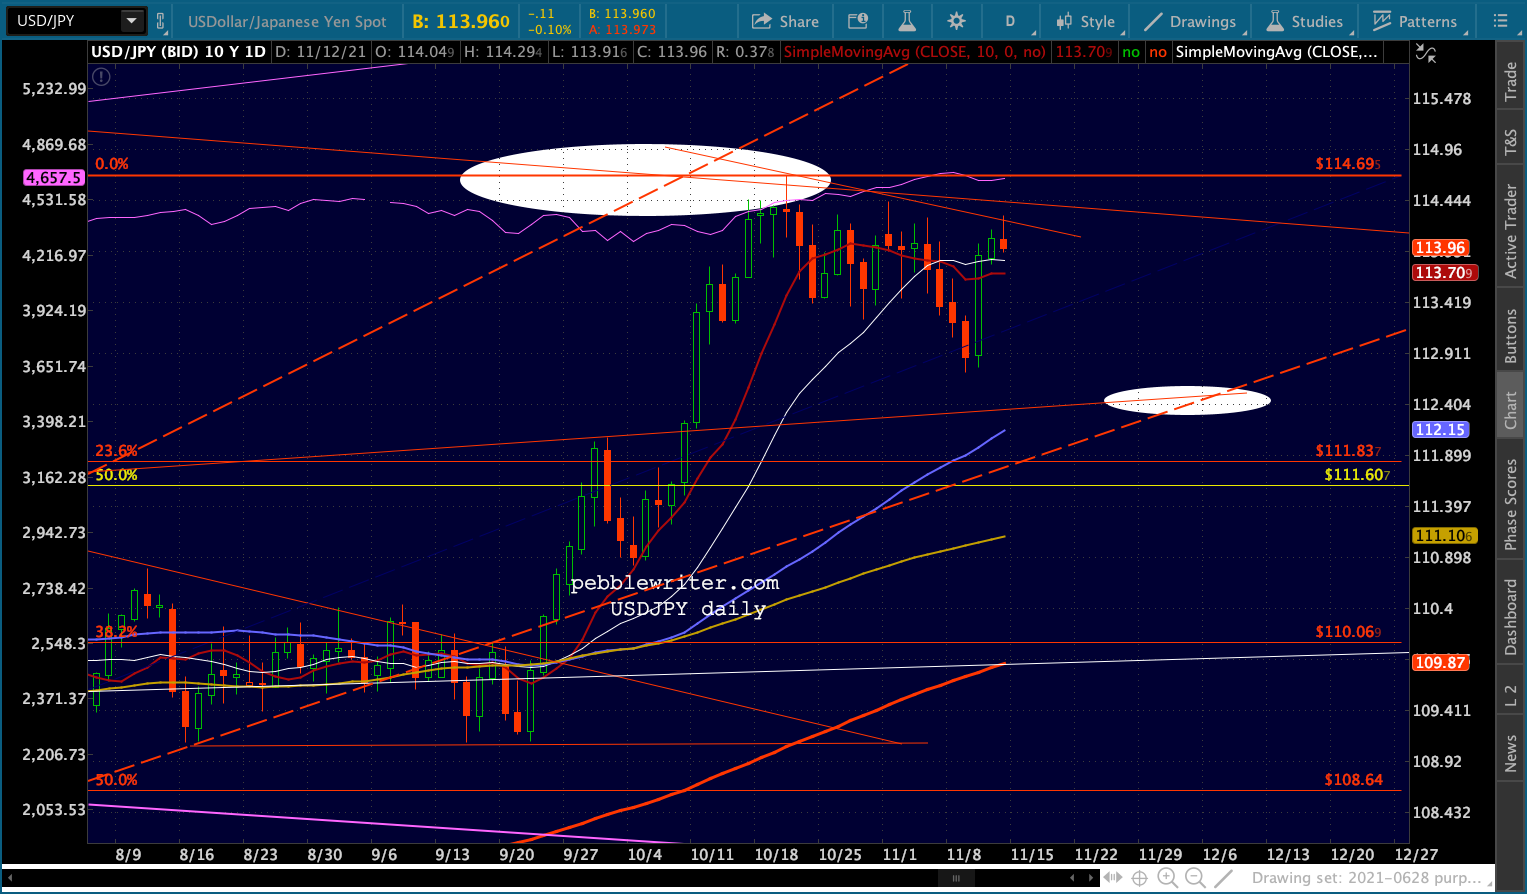
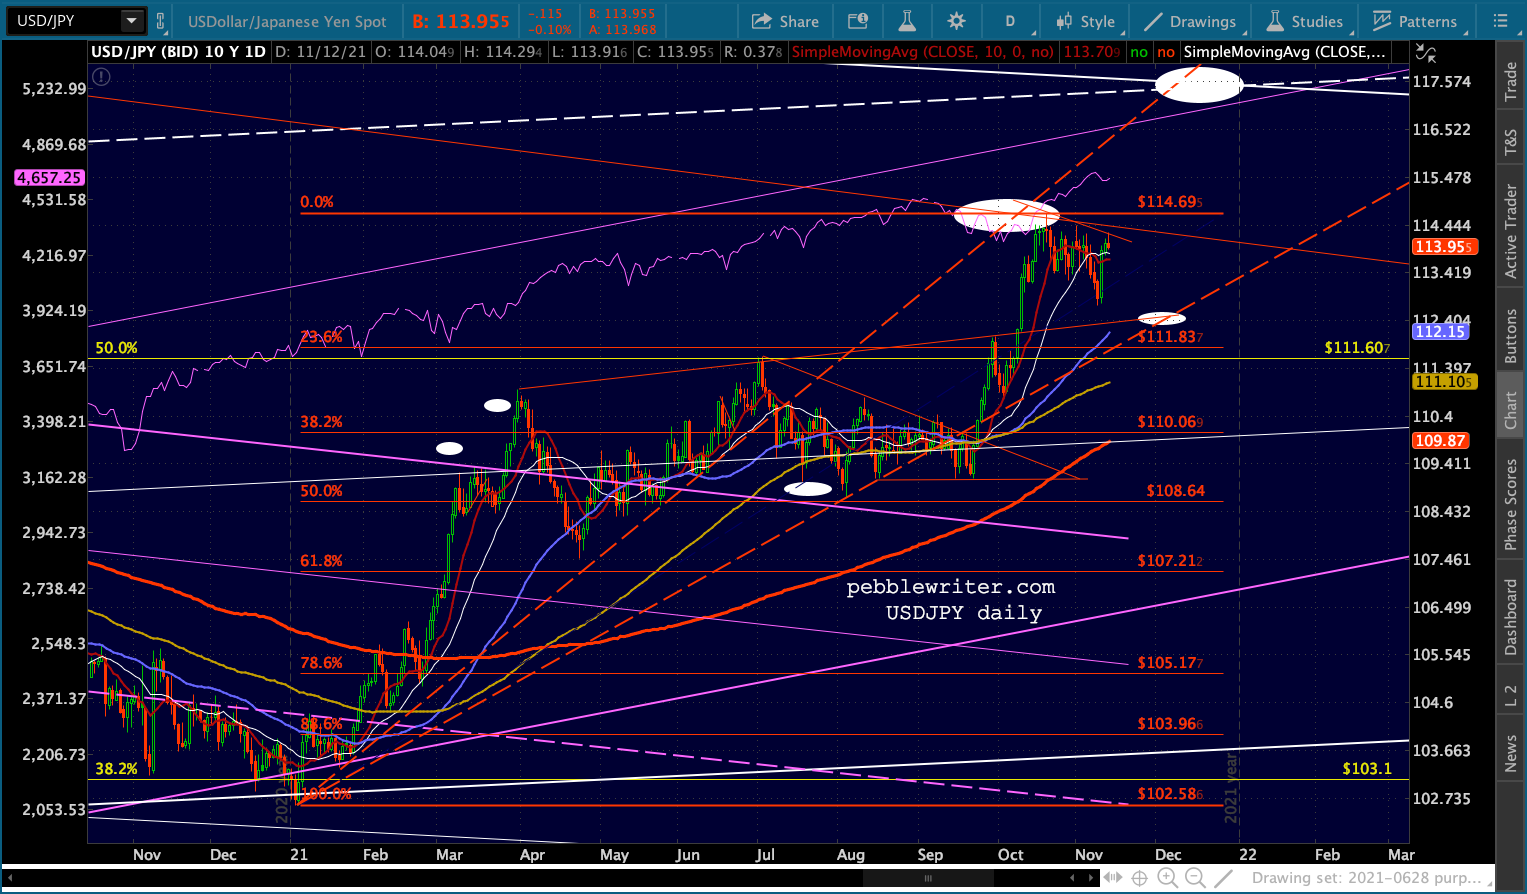
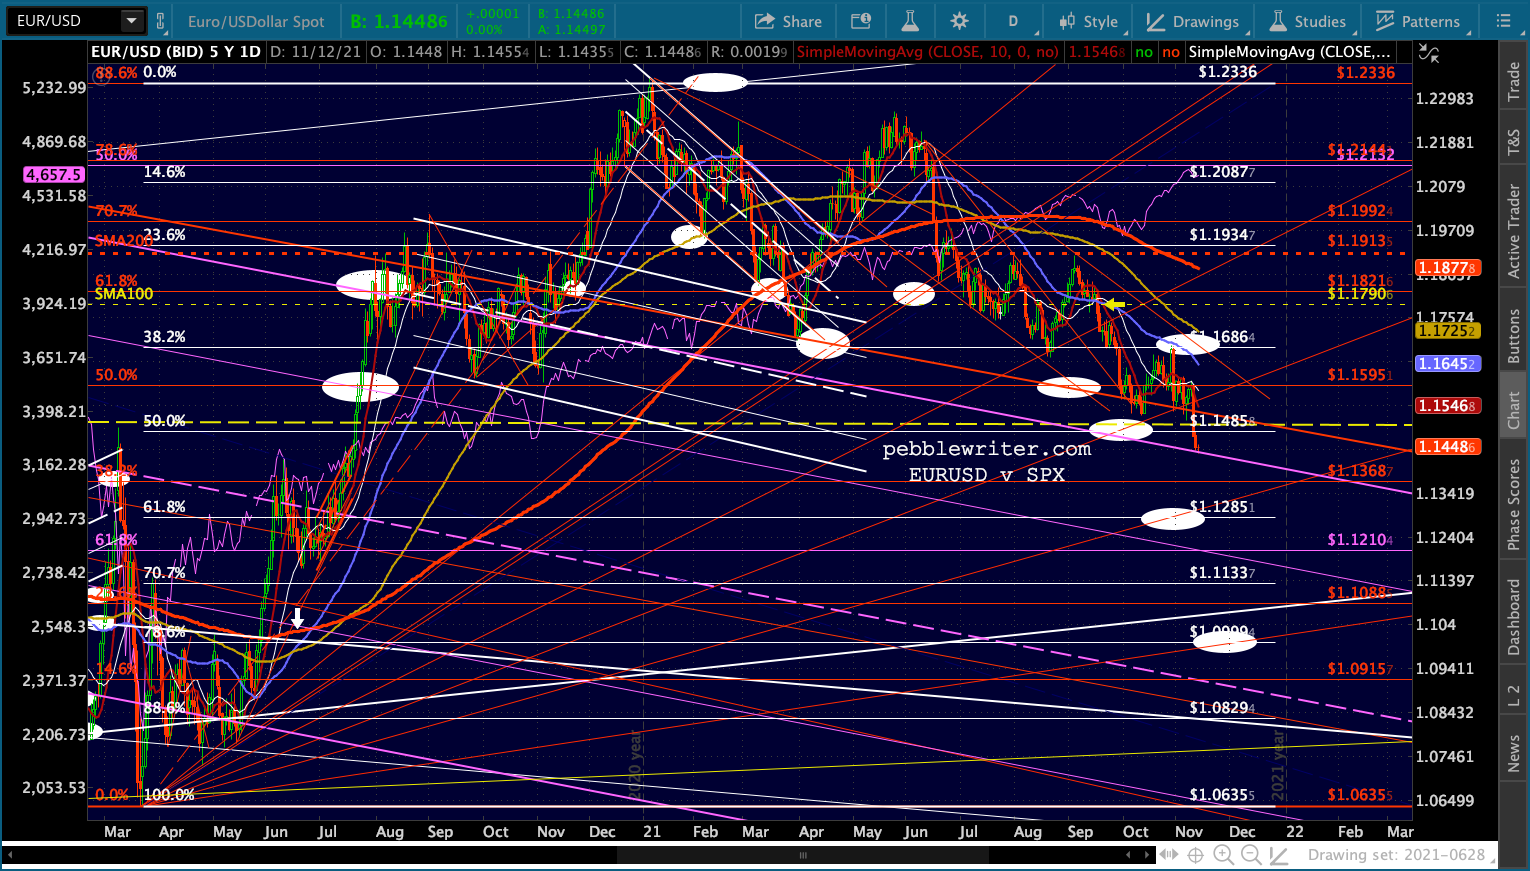
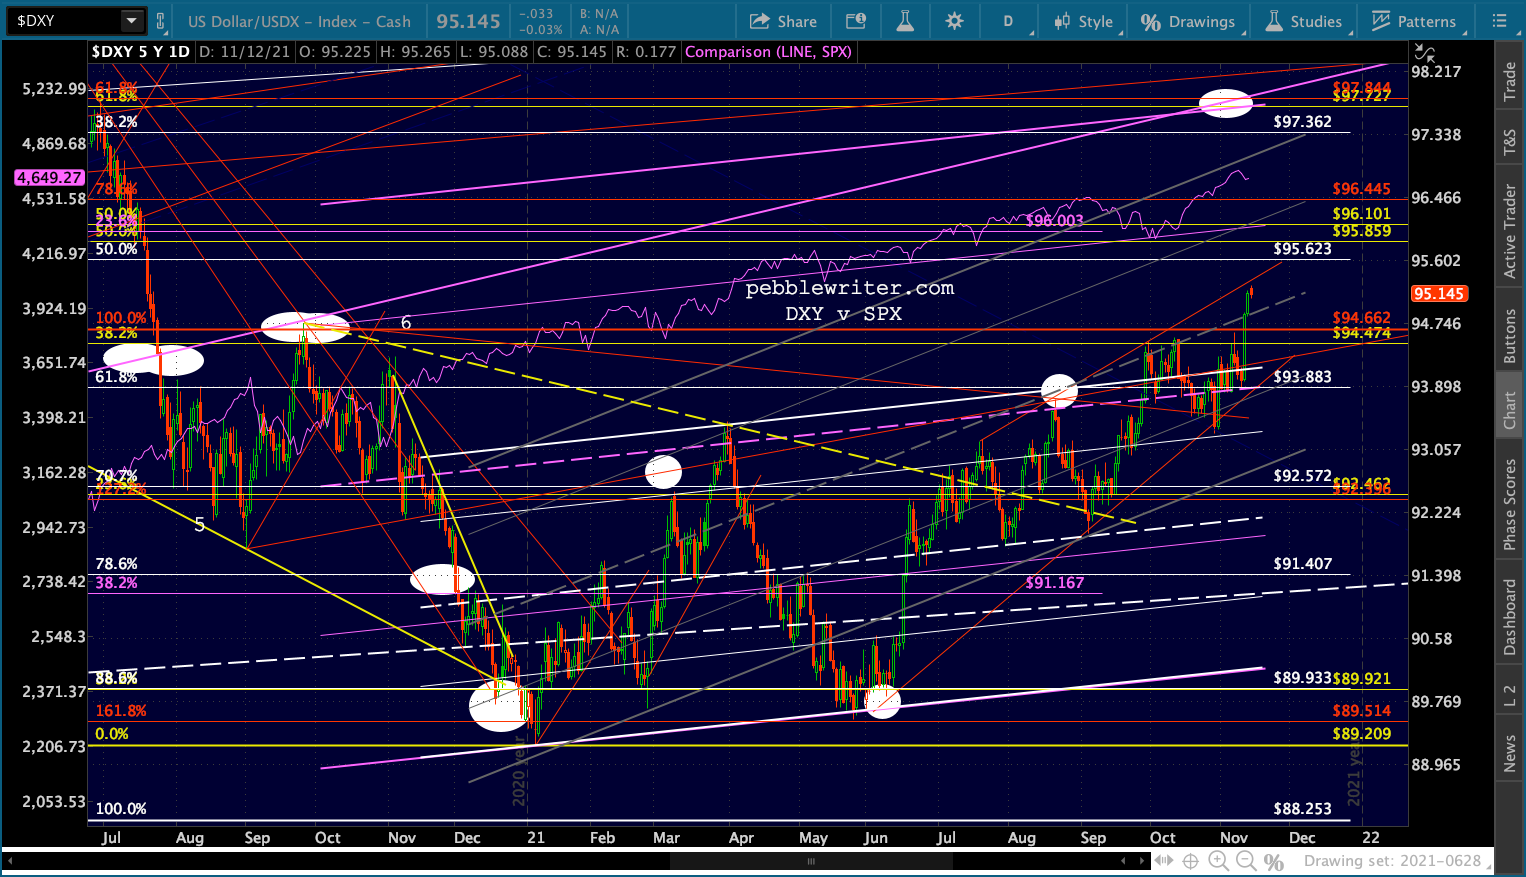
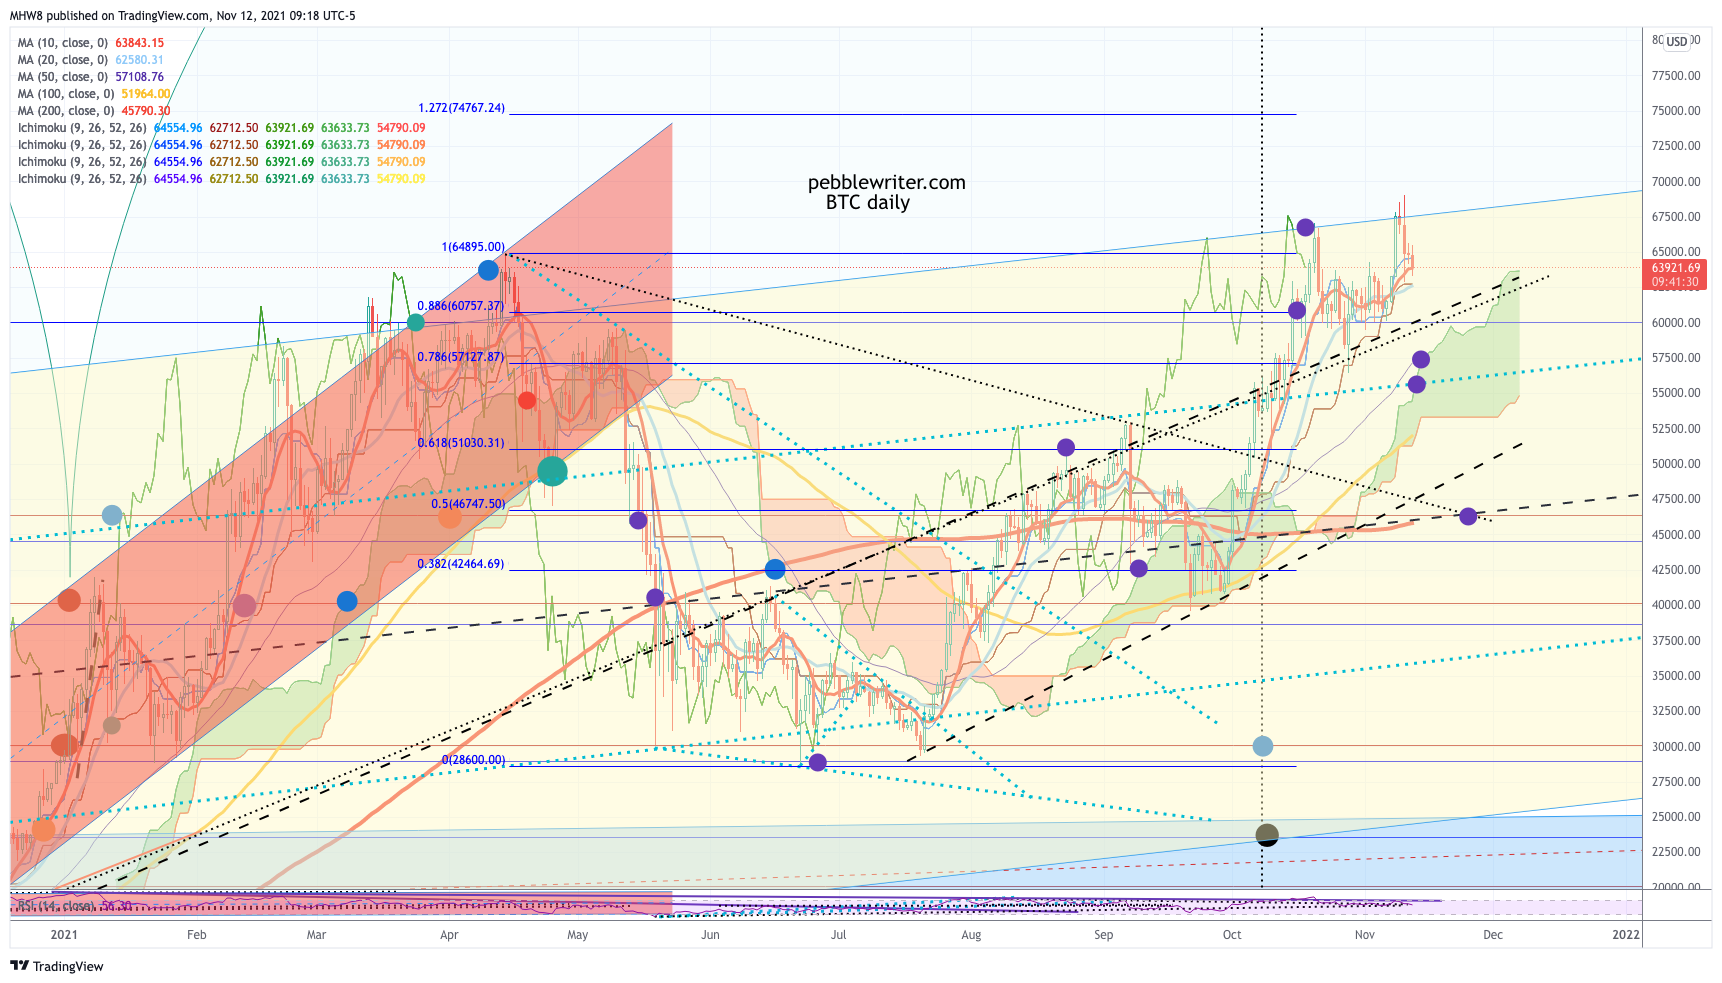 I’m a big believer in the tendency of markets to move together. Unless we’re talking about opposing instruments such as VIX and equities or oil and USDJPY, the dominance of algos almost demands it.
The reflation trade has kept the current rally going for 20 months with very few significant pauses, let alone declines. But, the Street is finally catching on to the game. And, the game was allowed to go on too long – to the point where stuffing the inflation genie back into the bottle will be tough.
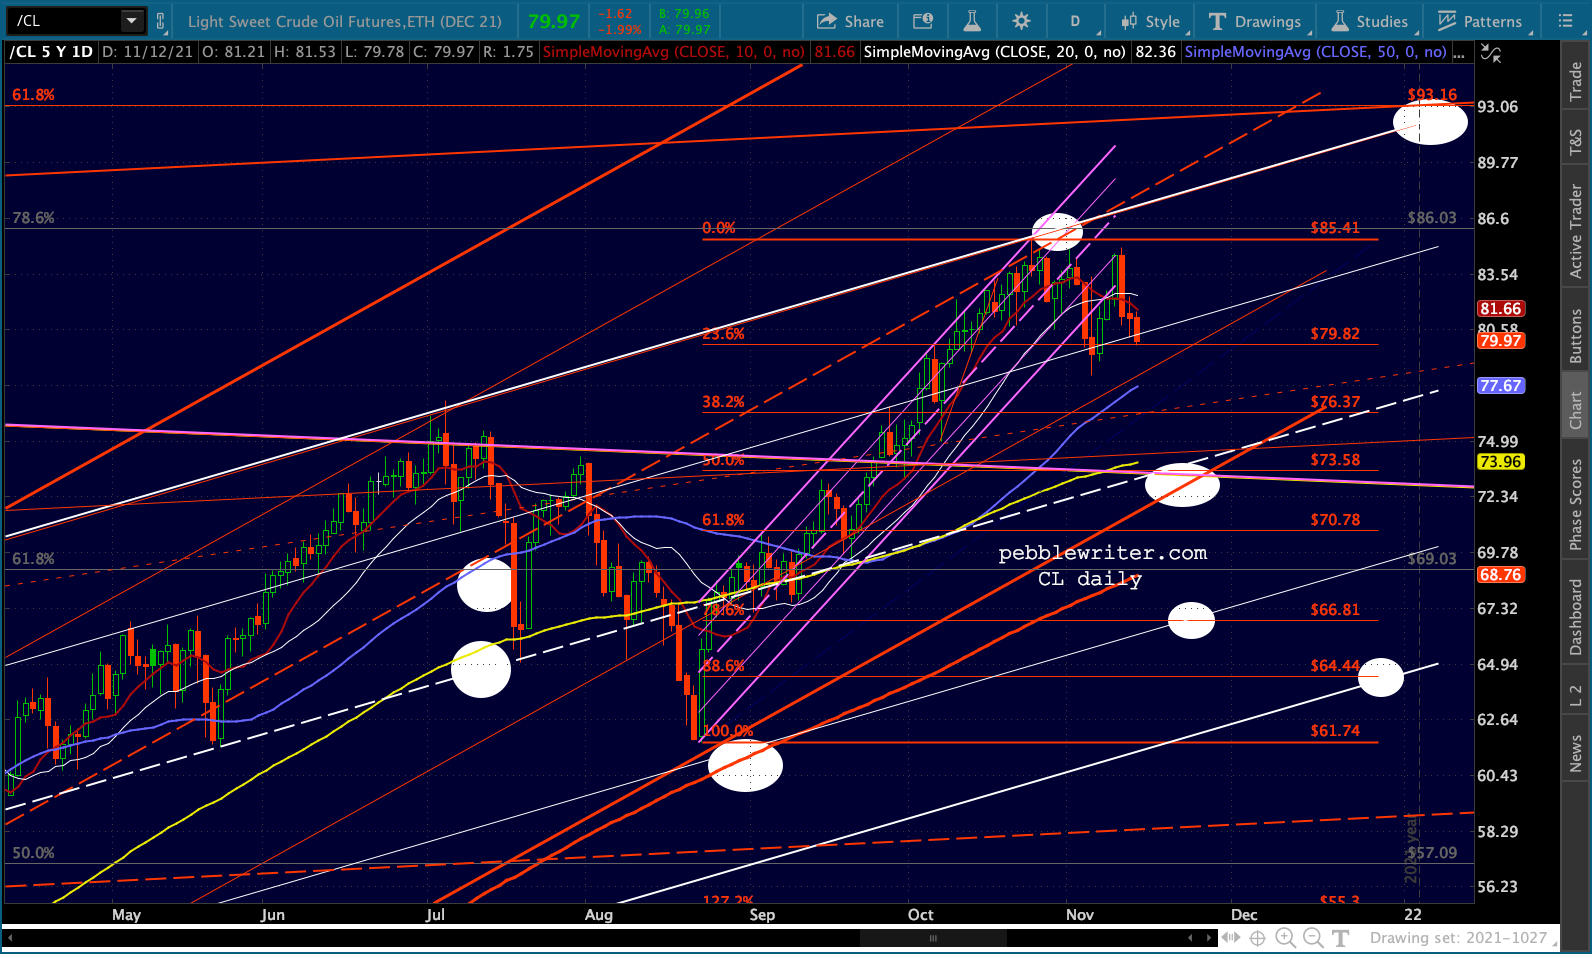
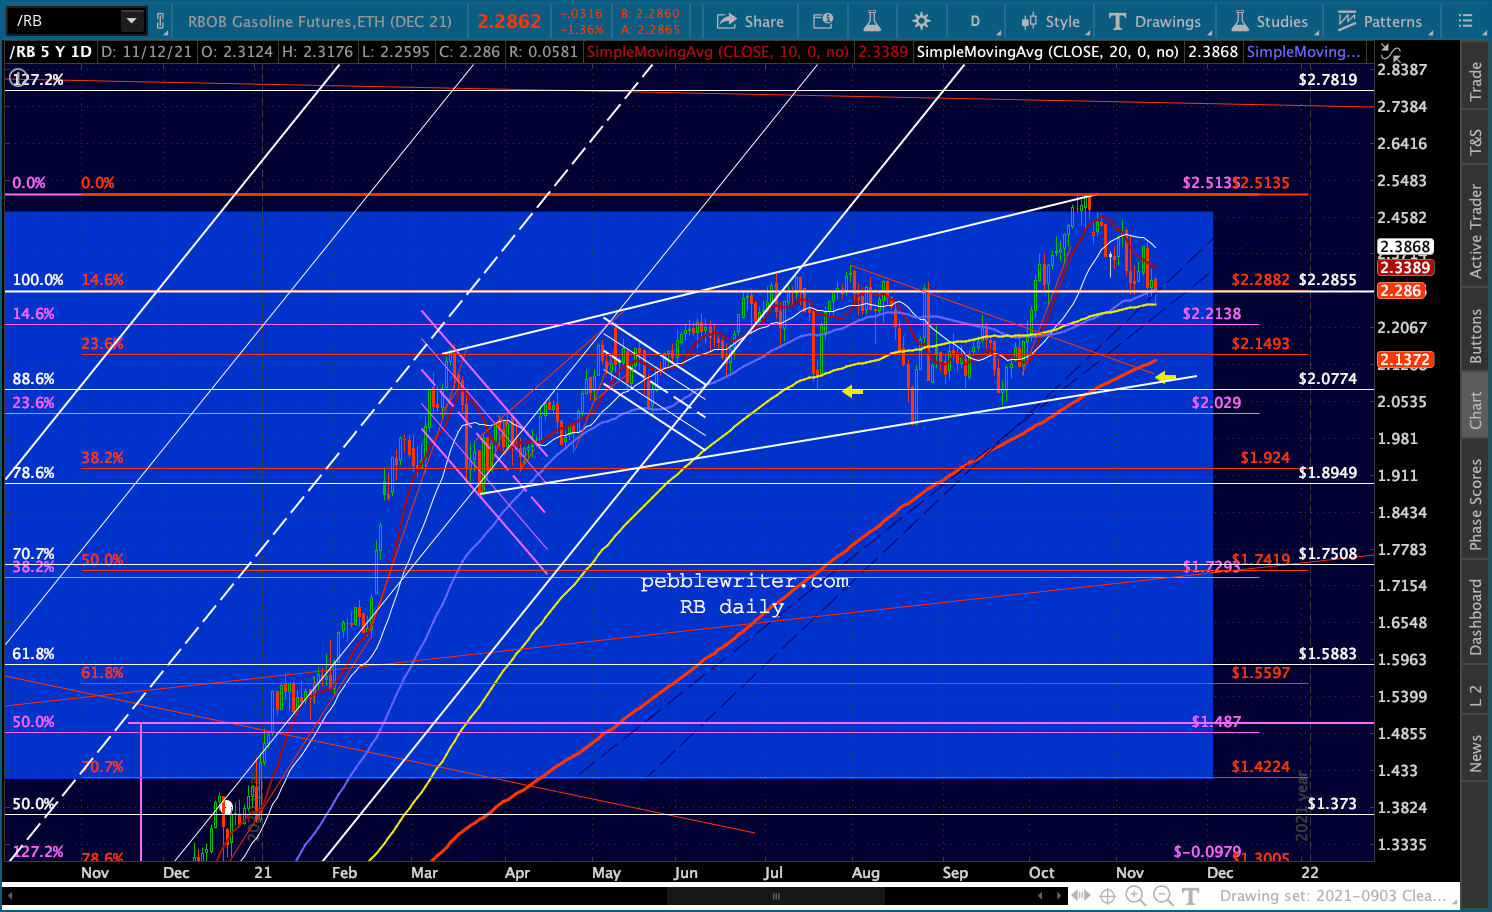
If, as I expect, oil and gas have begun a pause/decline which will relieve inflationary pressure in the next month or so, the Fed merely needs to get through the next few weeks without a major upset. If November CPI comes in at anything below 6%, it will be taken as a sign that pressures have subsided.
The chart below supposes that gas prices are frozen at current levels such that the YoY calculation gradually heads back to whatever level will be required to offset the other bubbles the Fed has inflated. Many of them are tied to energy prices to some extent.
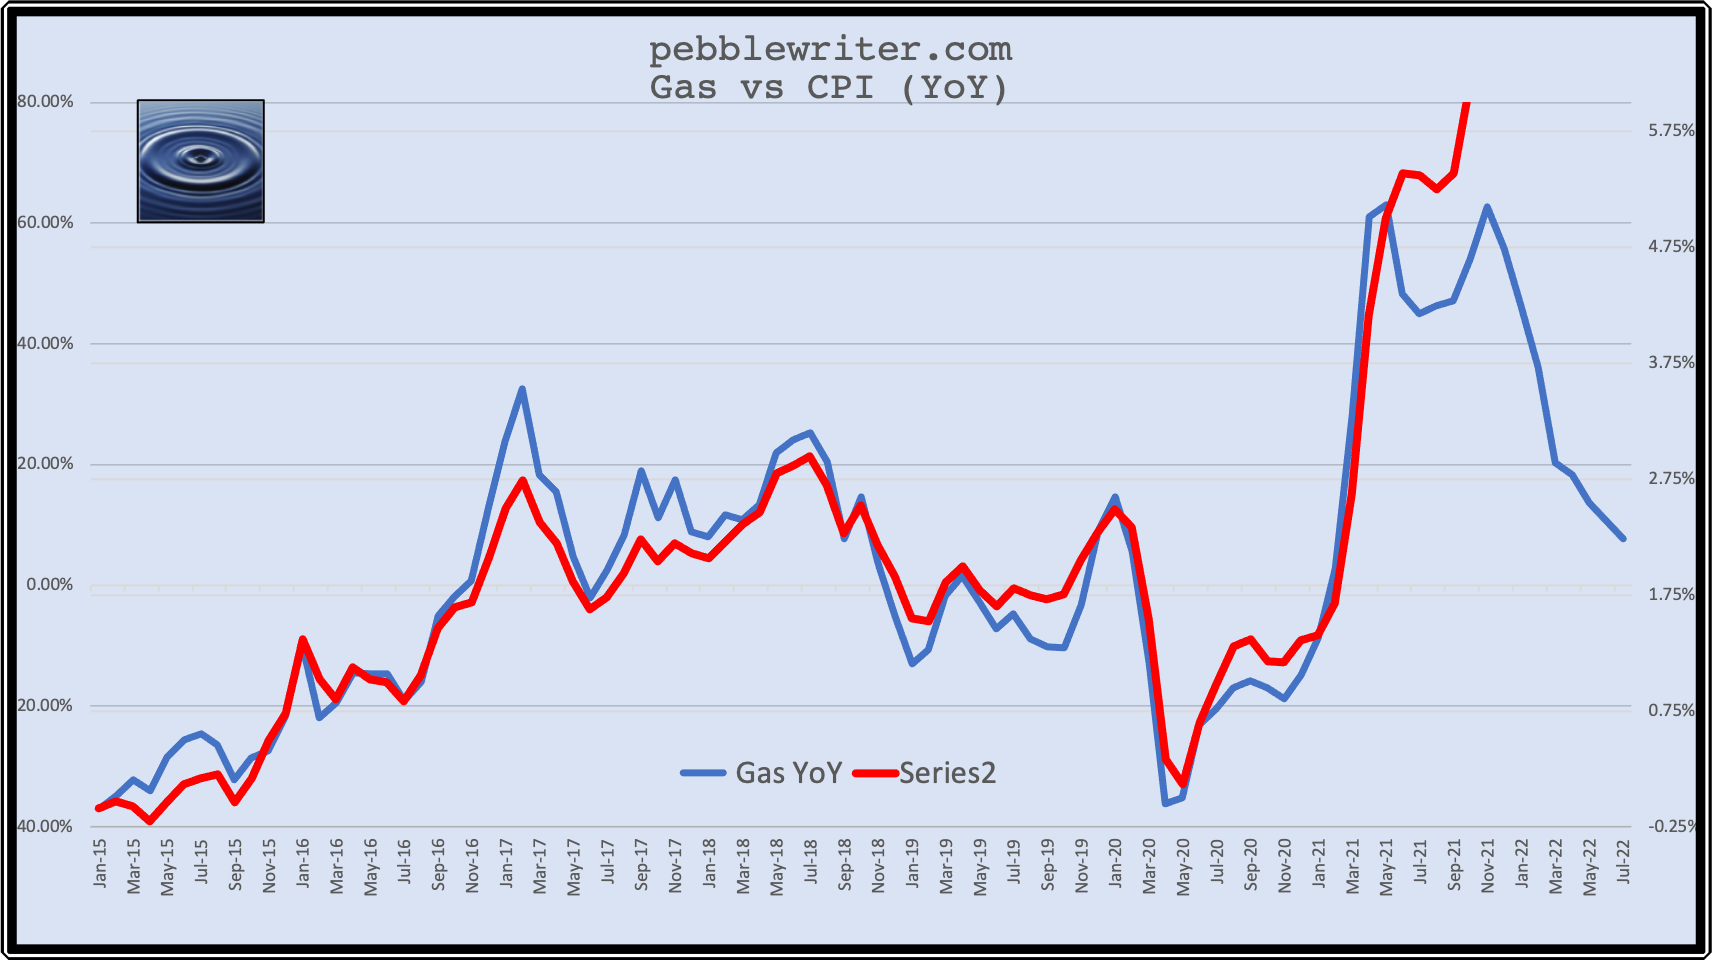 Food prices, for instance, are highly correlated to oil/gas. And, food prices are on the verge of a potential breakout. DBA is a nifty ETF which includes many of the major food-related commodities: corn, soybeans, wheat, Kansas City wheat, sugar, cocoa, coffee, cotton, live cattle, feeder cattle, and lean hogs.
We started watching the chart last year when it became obvious that inflation was coming. Like SPX, it rebounded sharply from its 2020 lows.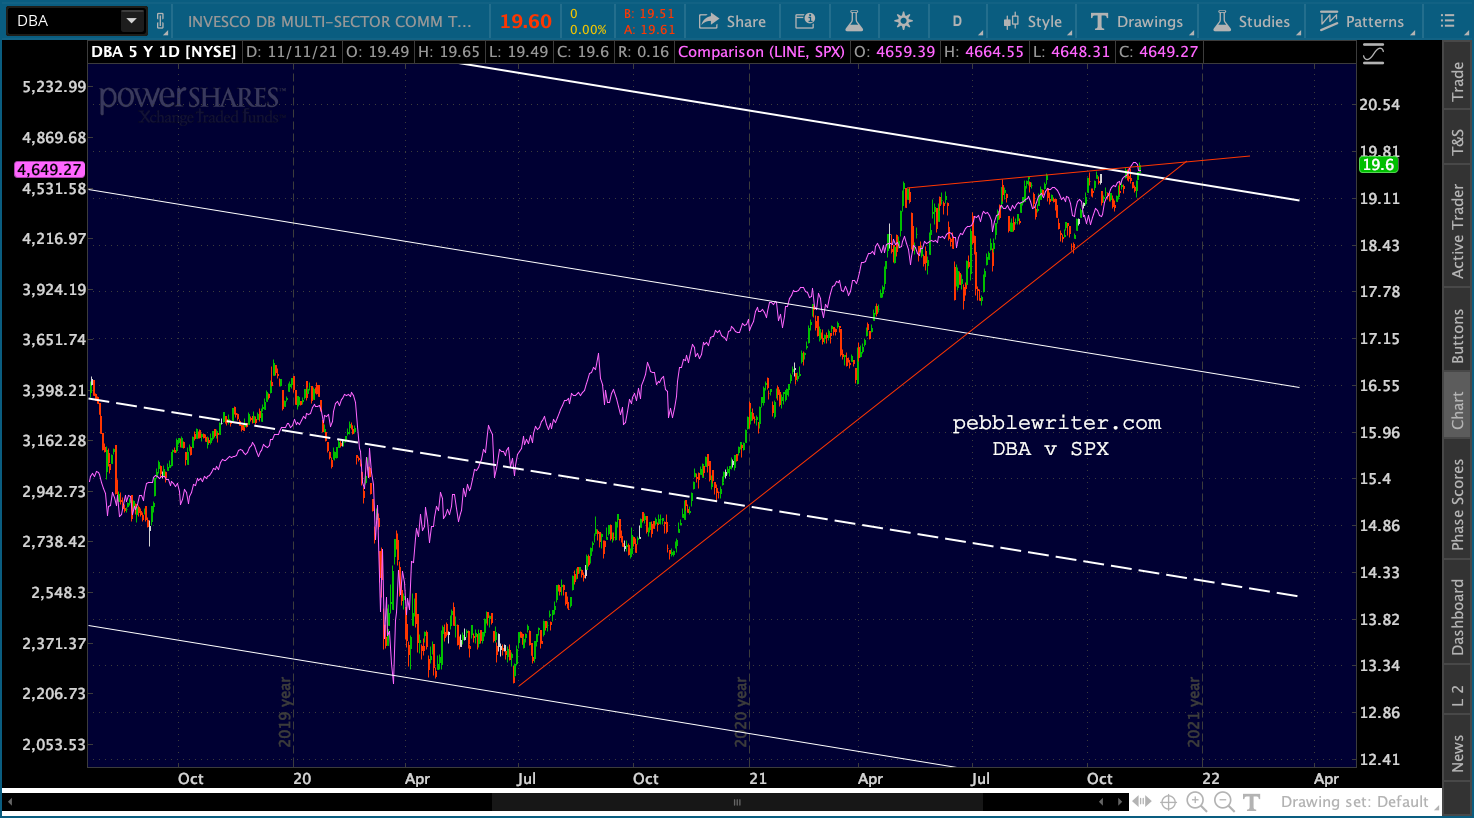 In the process, it reached the top of a huge falling channel…
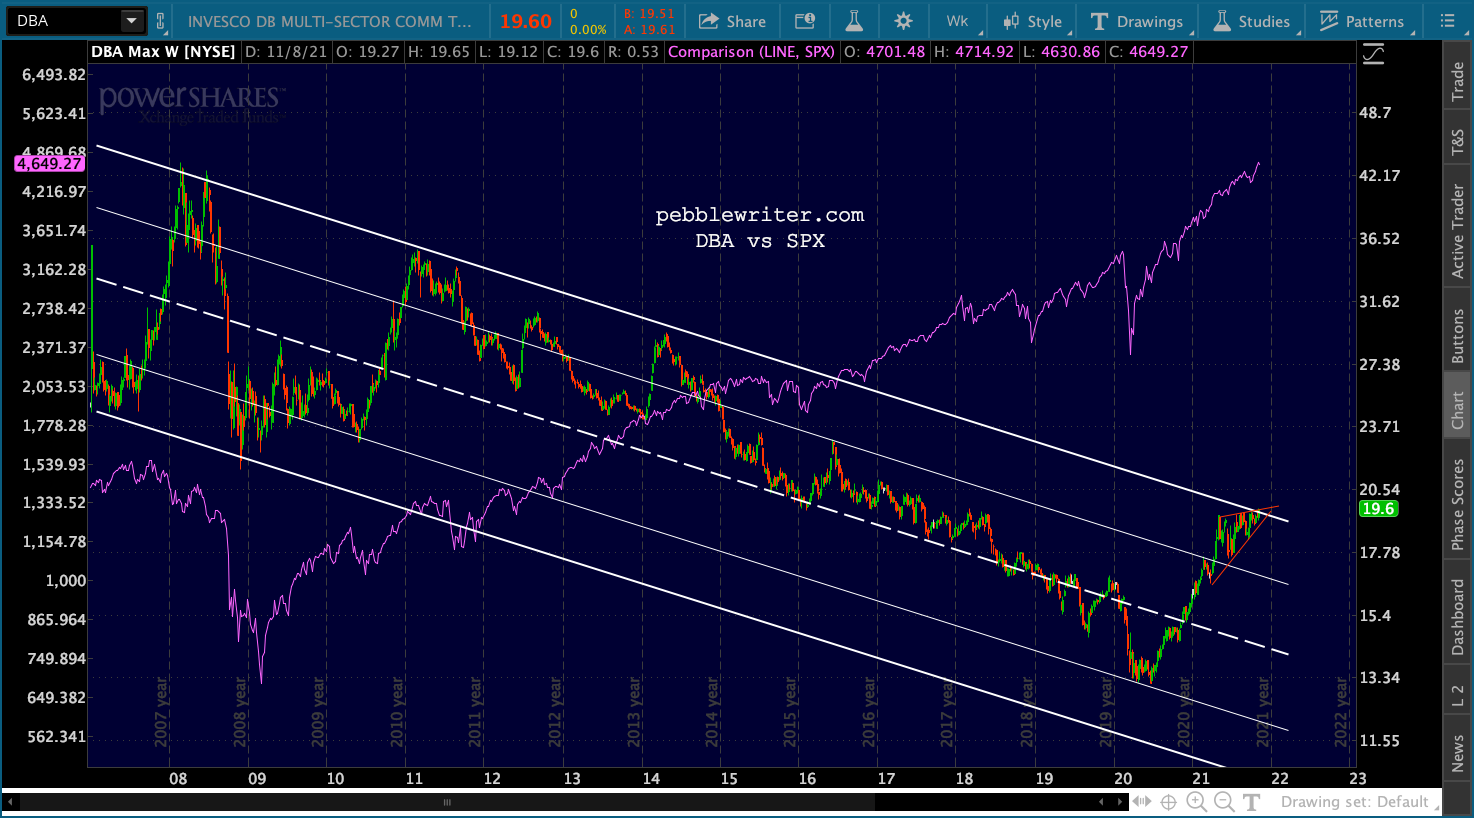 …and formed two rising wedges in the process.
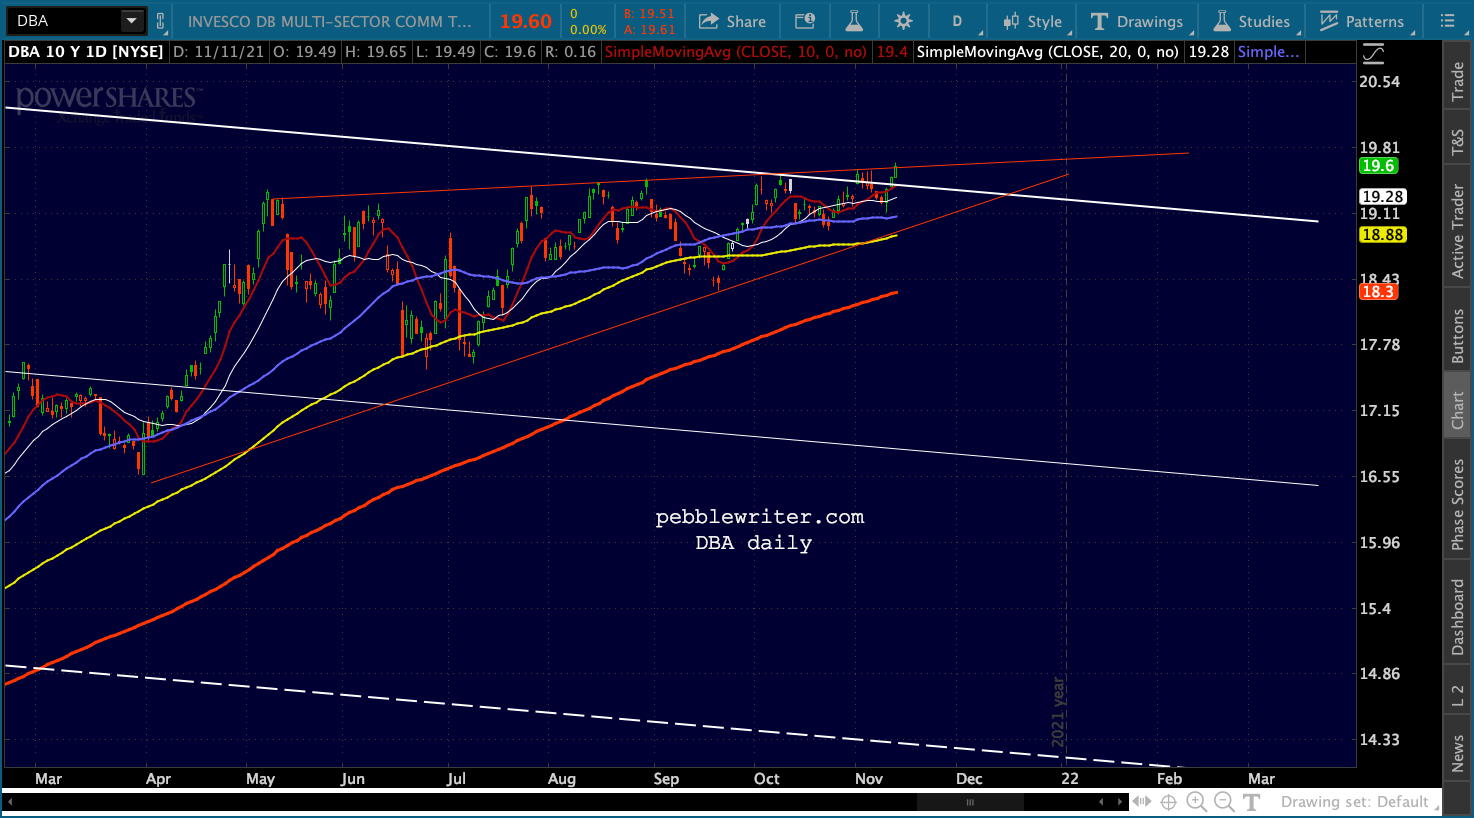 If food prices break out the way that energy and housing prices did, the Fed will have a very tough time keeping inflation under control. It’s a great argument for crashing oil/gas prices, but I’m having a hard time identifying a catalyst for such a decline. In 2018, it took the murder and dismemberment of a journalist. Let’s hope TPTB find a less grisly way to do it this time.
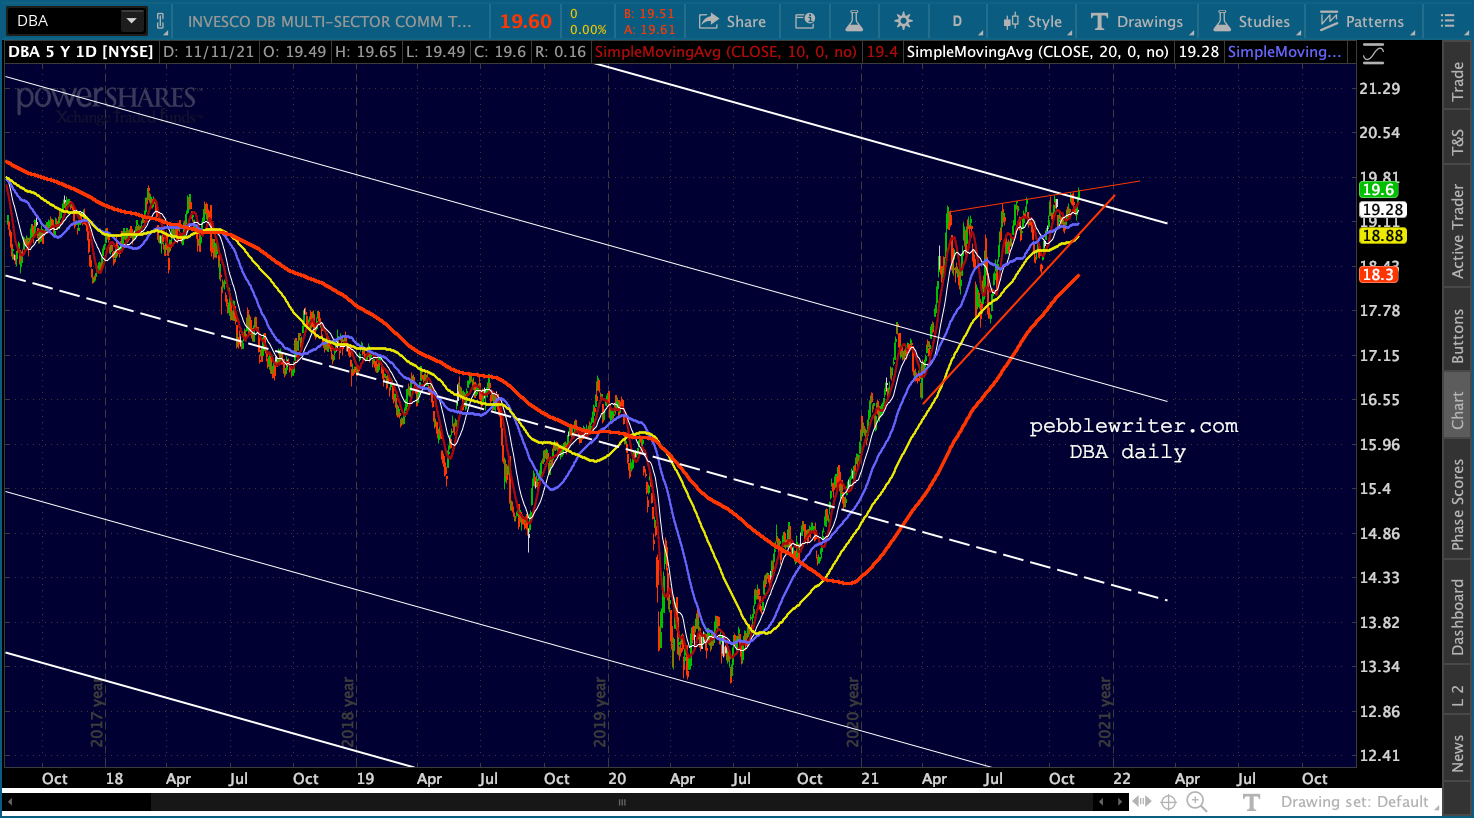 We shouldn’t discuss GC without touching on SI. Like GC, it has had a nice run. Look for it to tag and retreat from its SMA200 today, setting up a nice shorting opportunity.
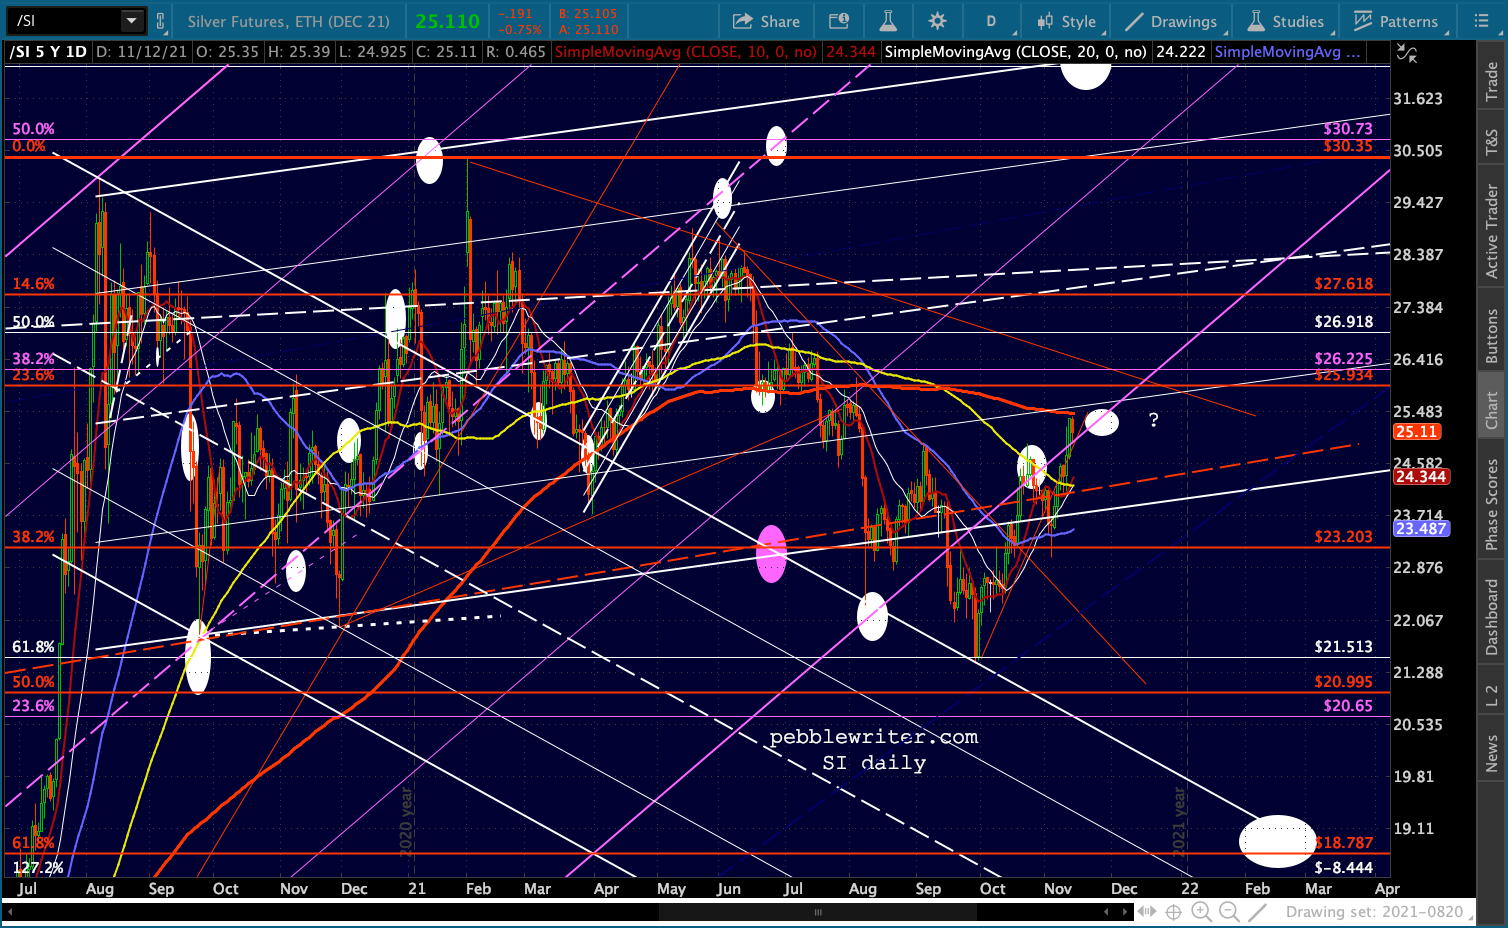
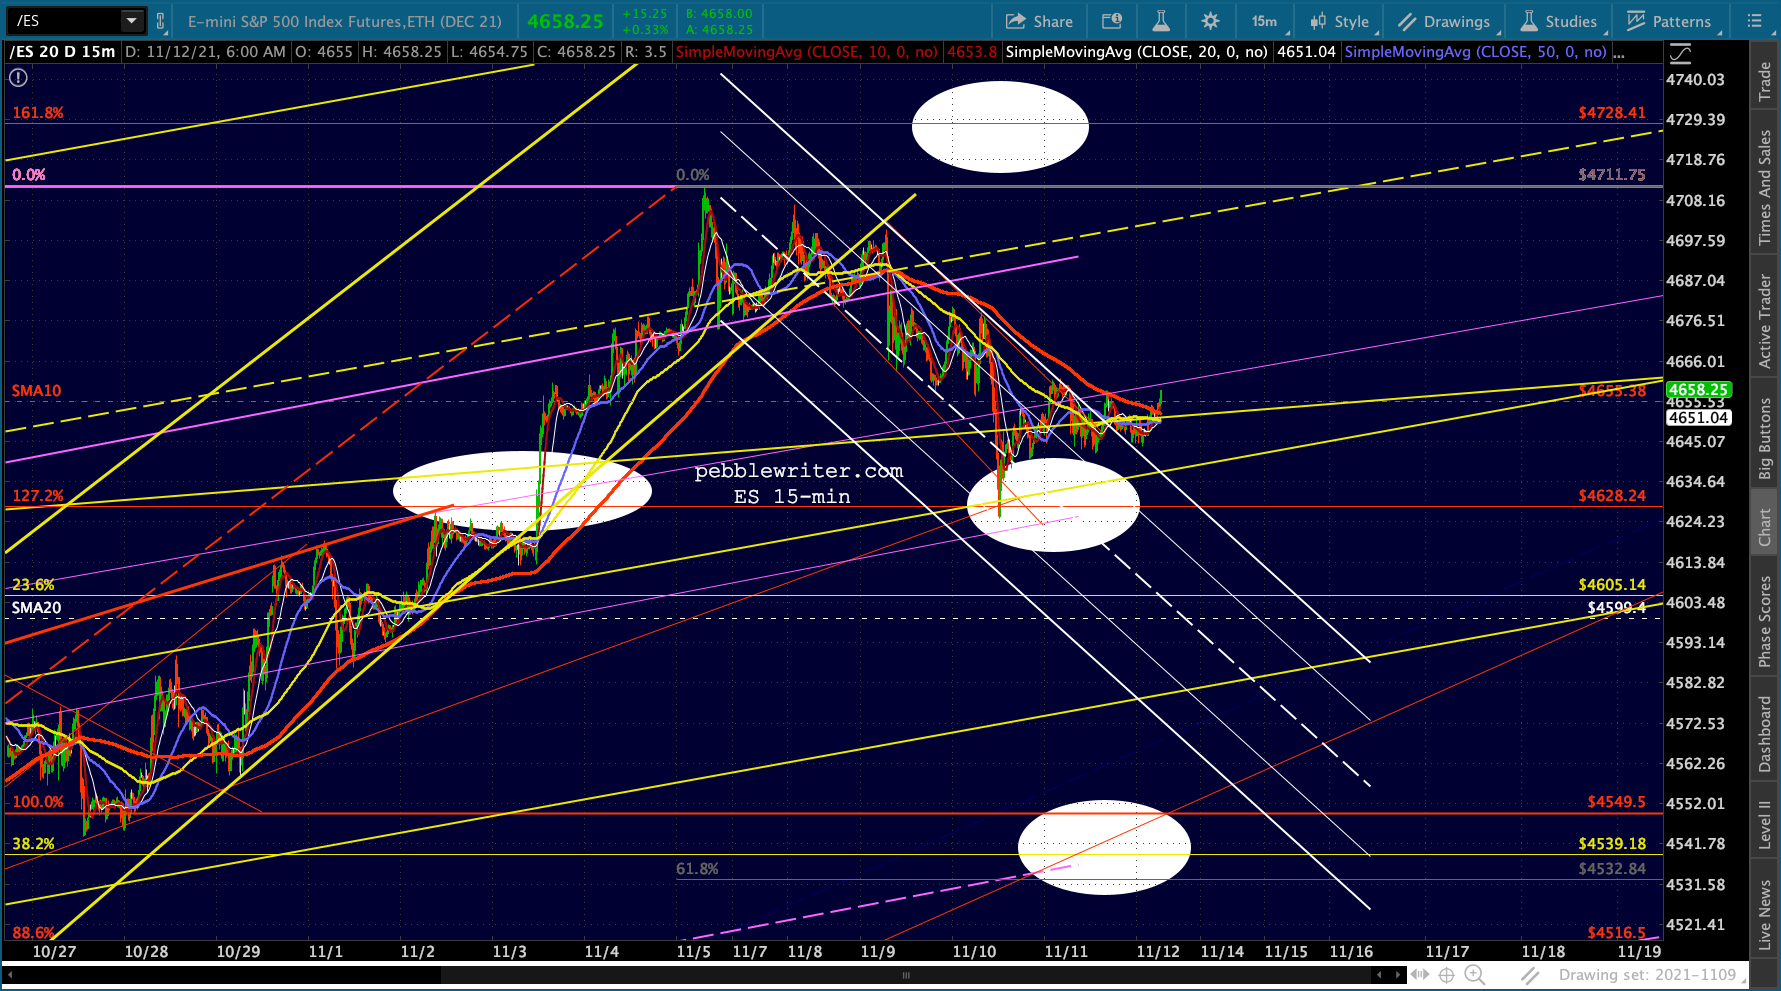
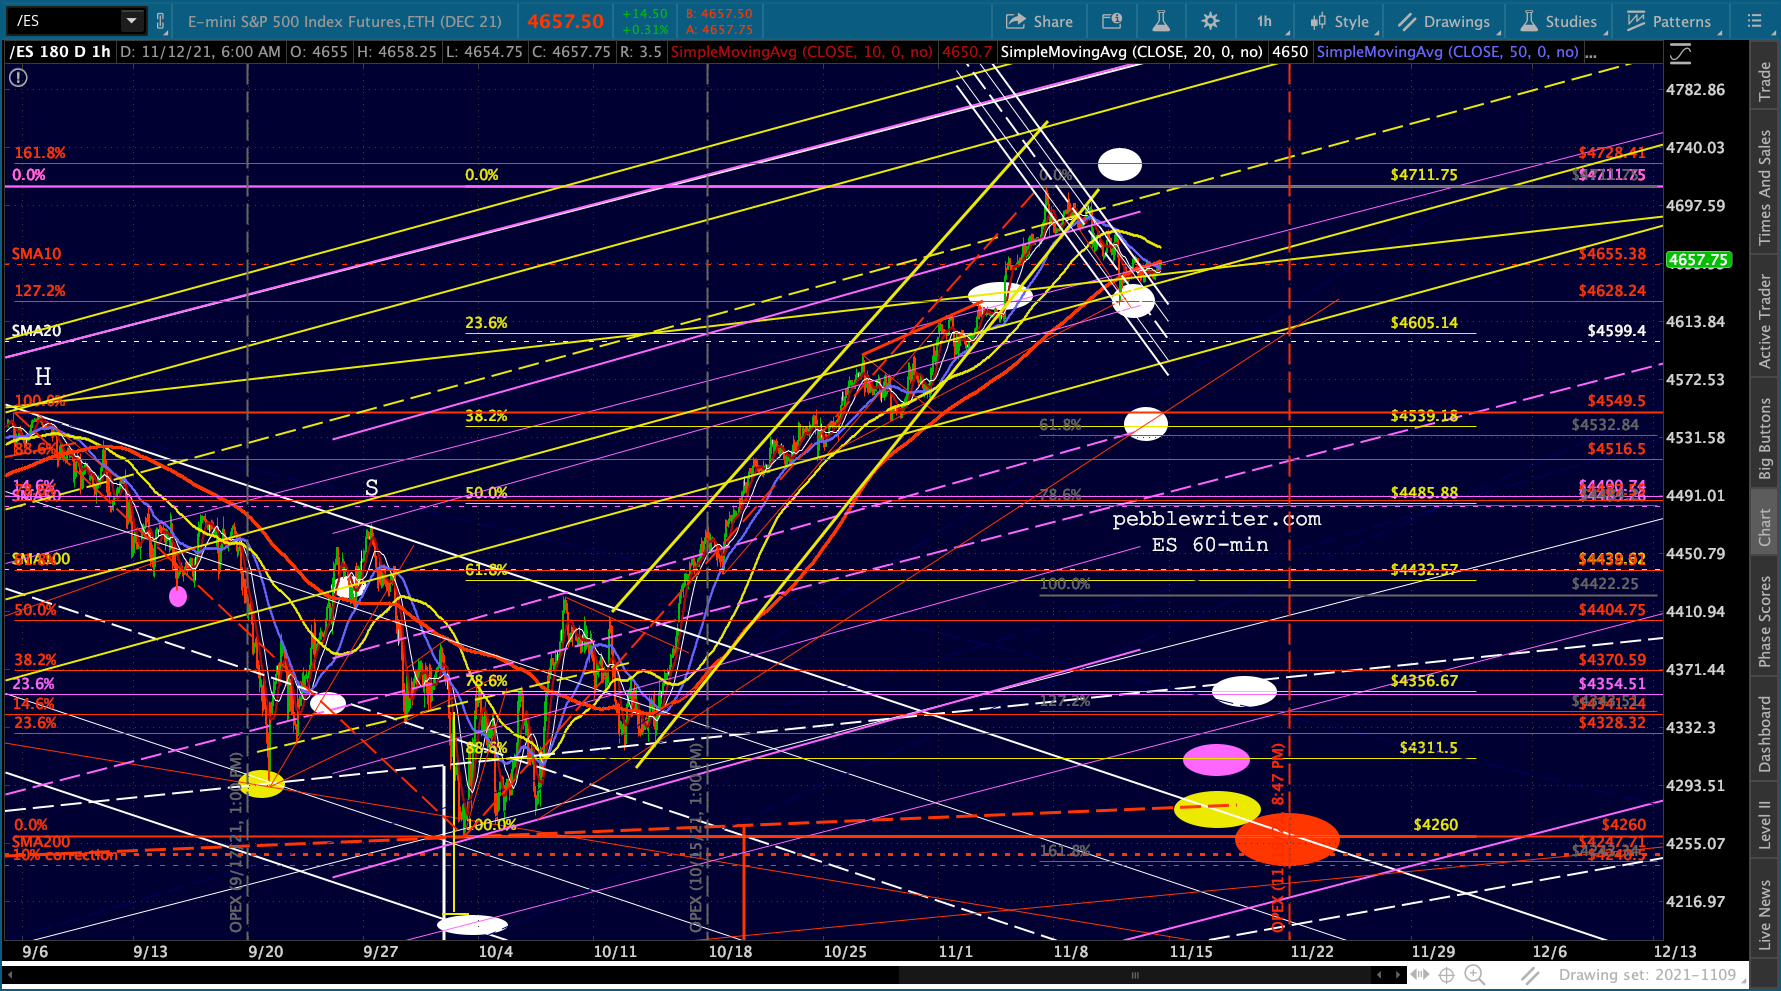
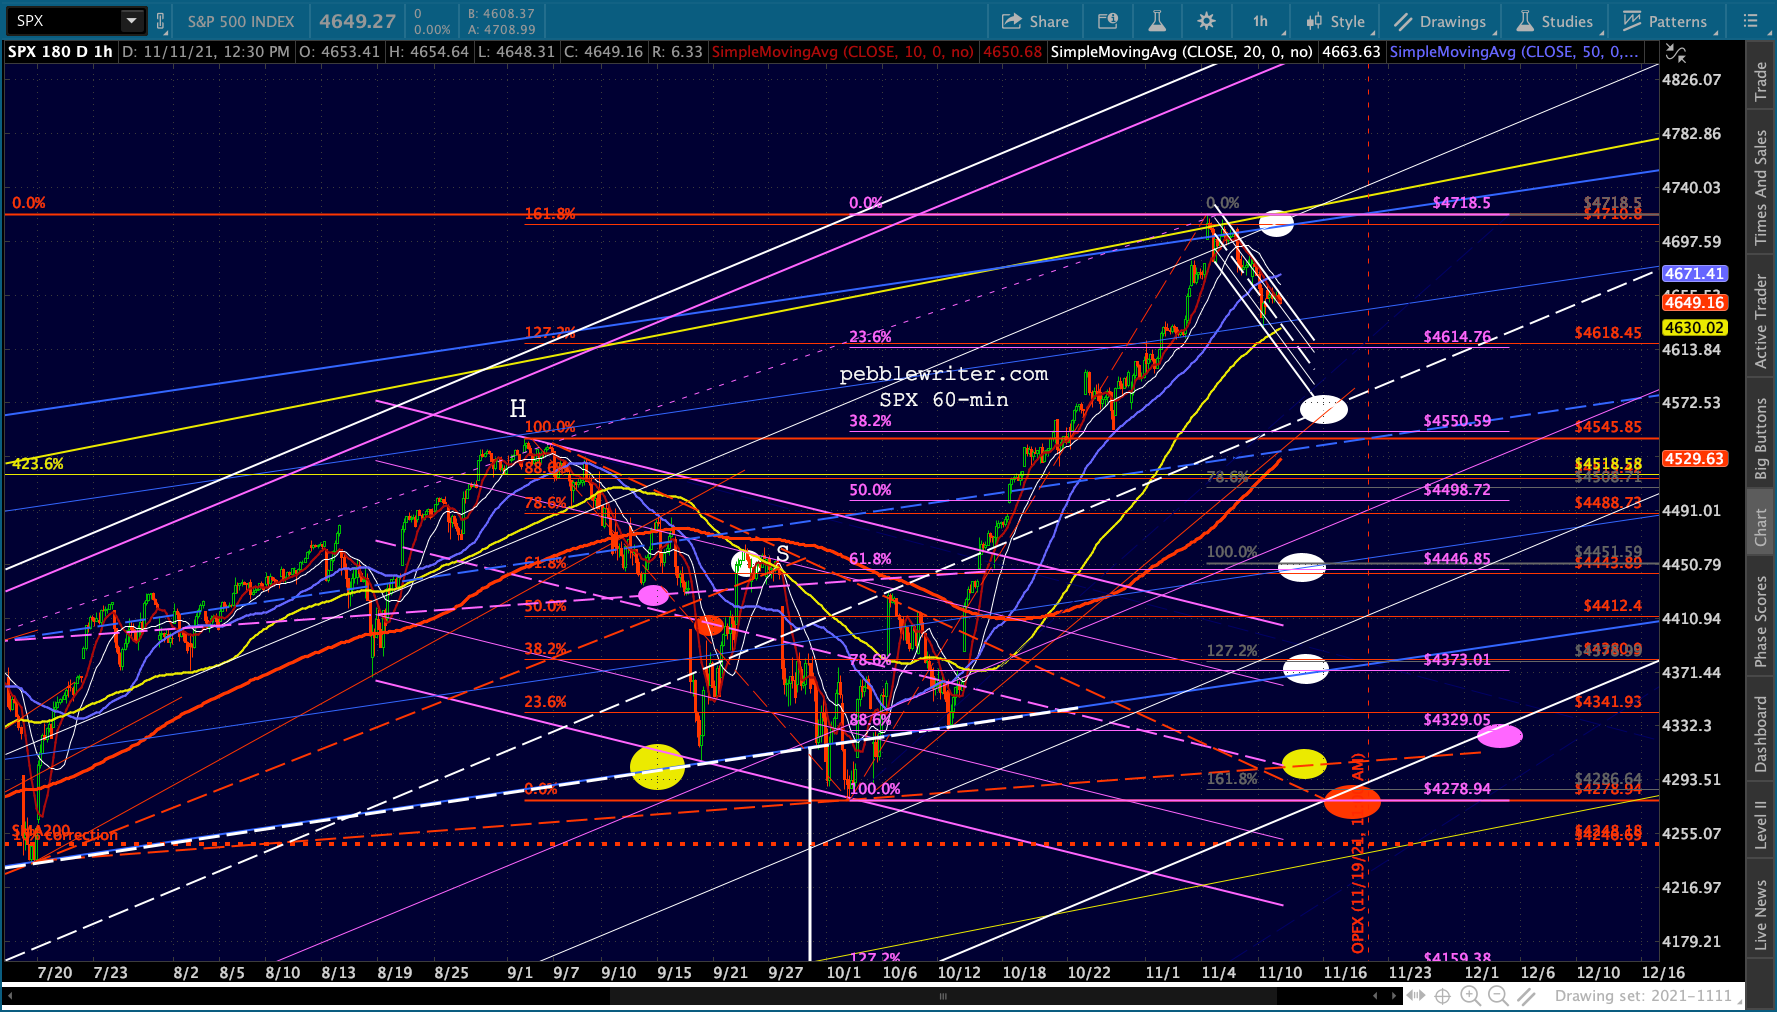
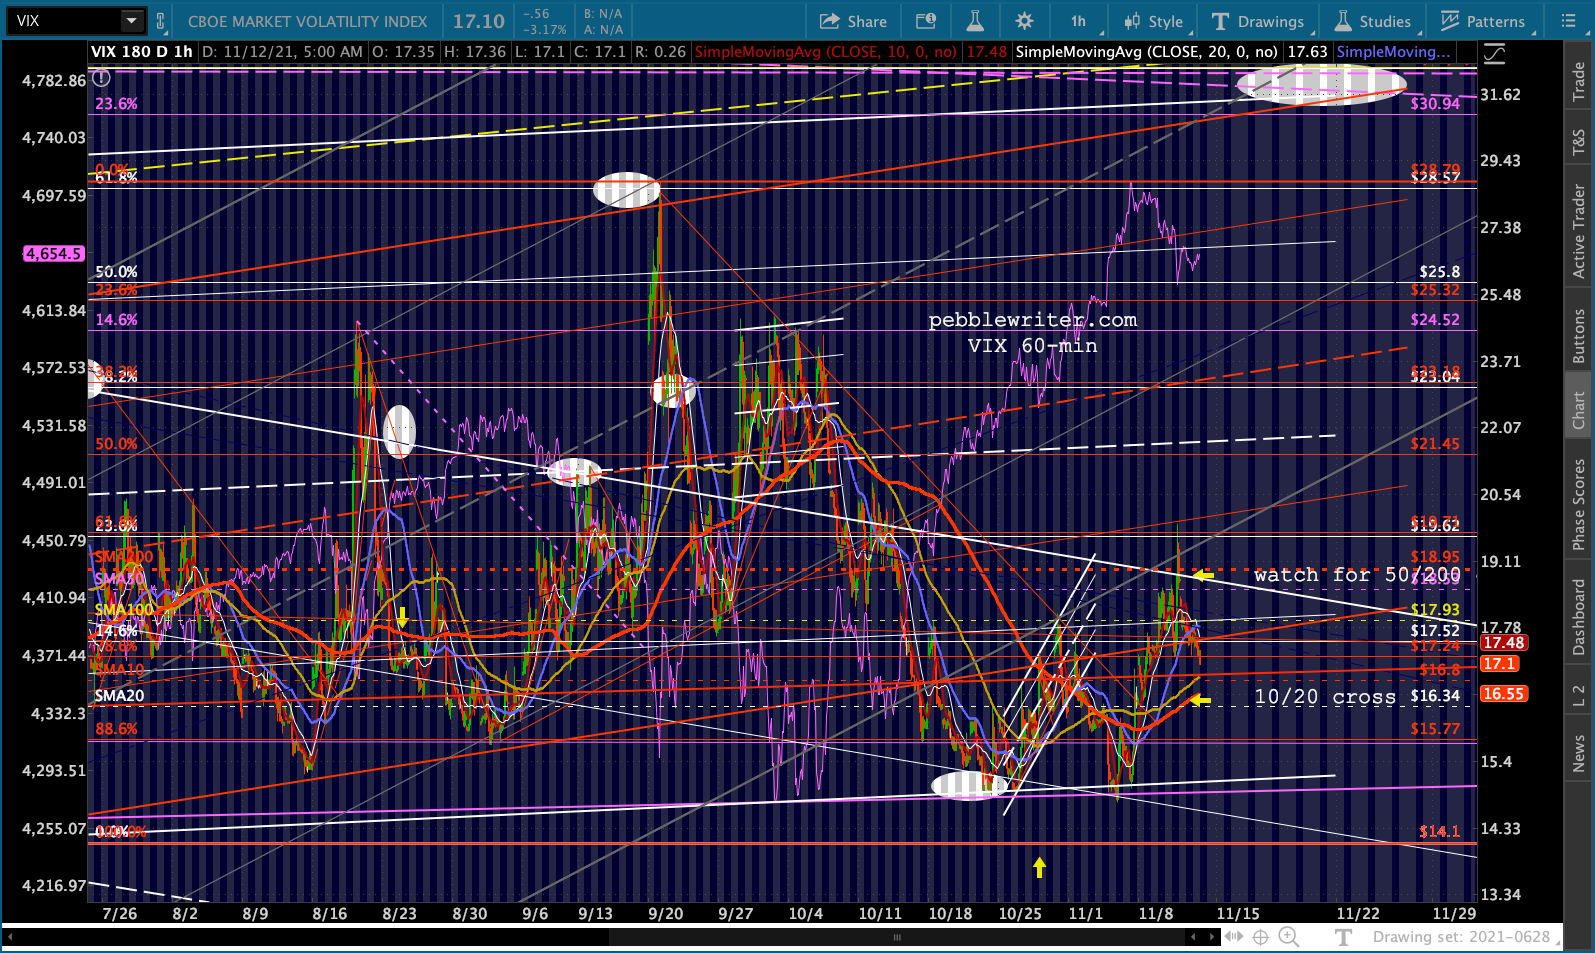
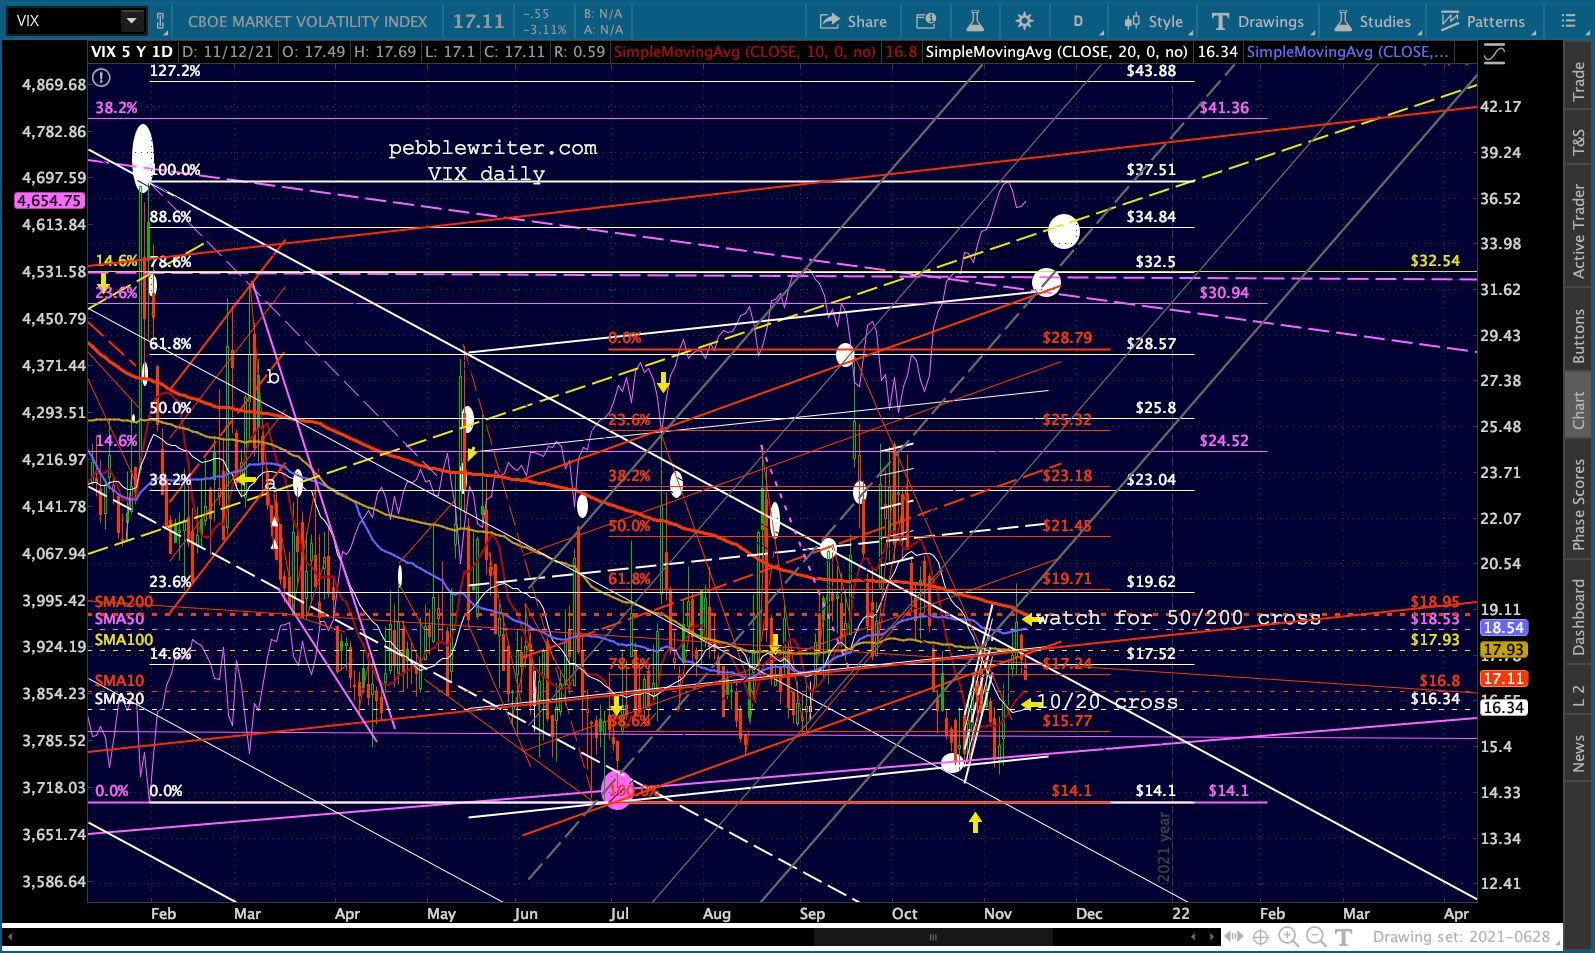
The rest of this morning’s charts… Bottom line, VIX’s drop back into the white channel is offsetting (so far) CL’s continuing decline.