

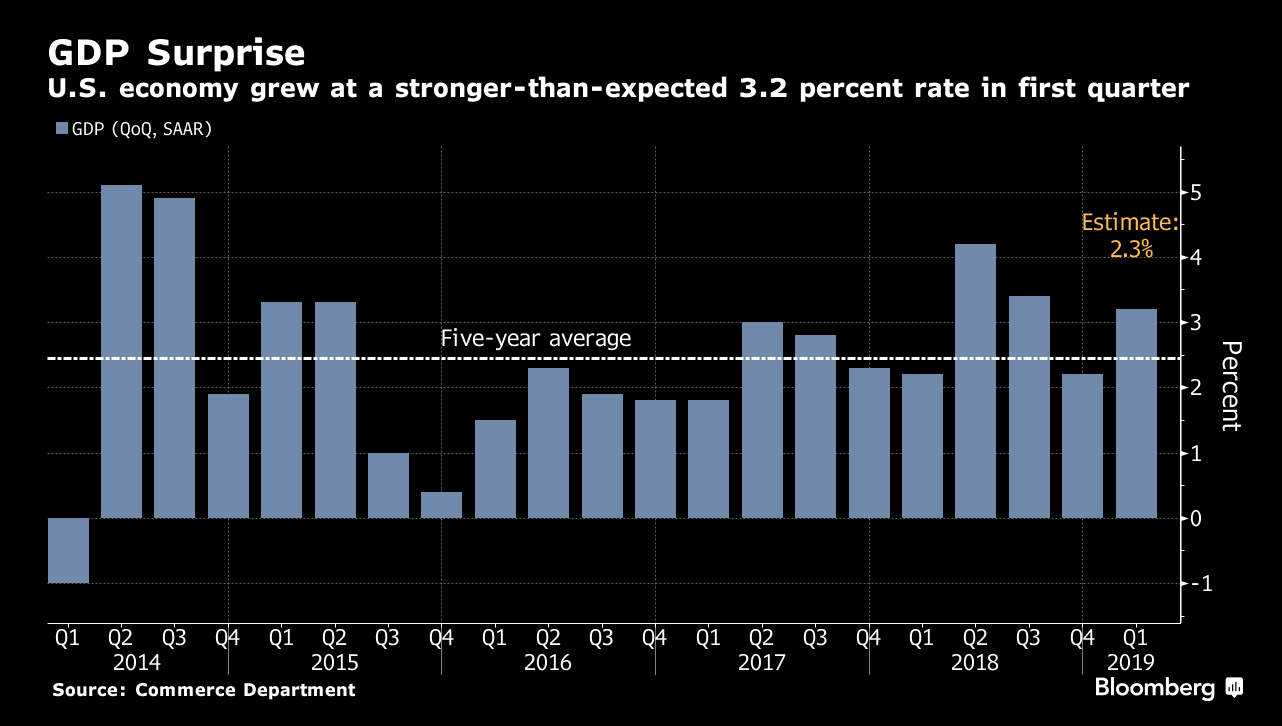
Q1 GDP came in at 3.2%, a big beat versus the 2.3% most expected.
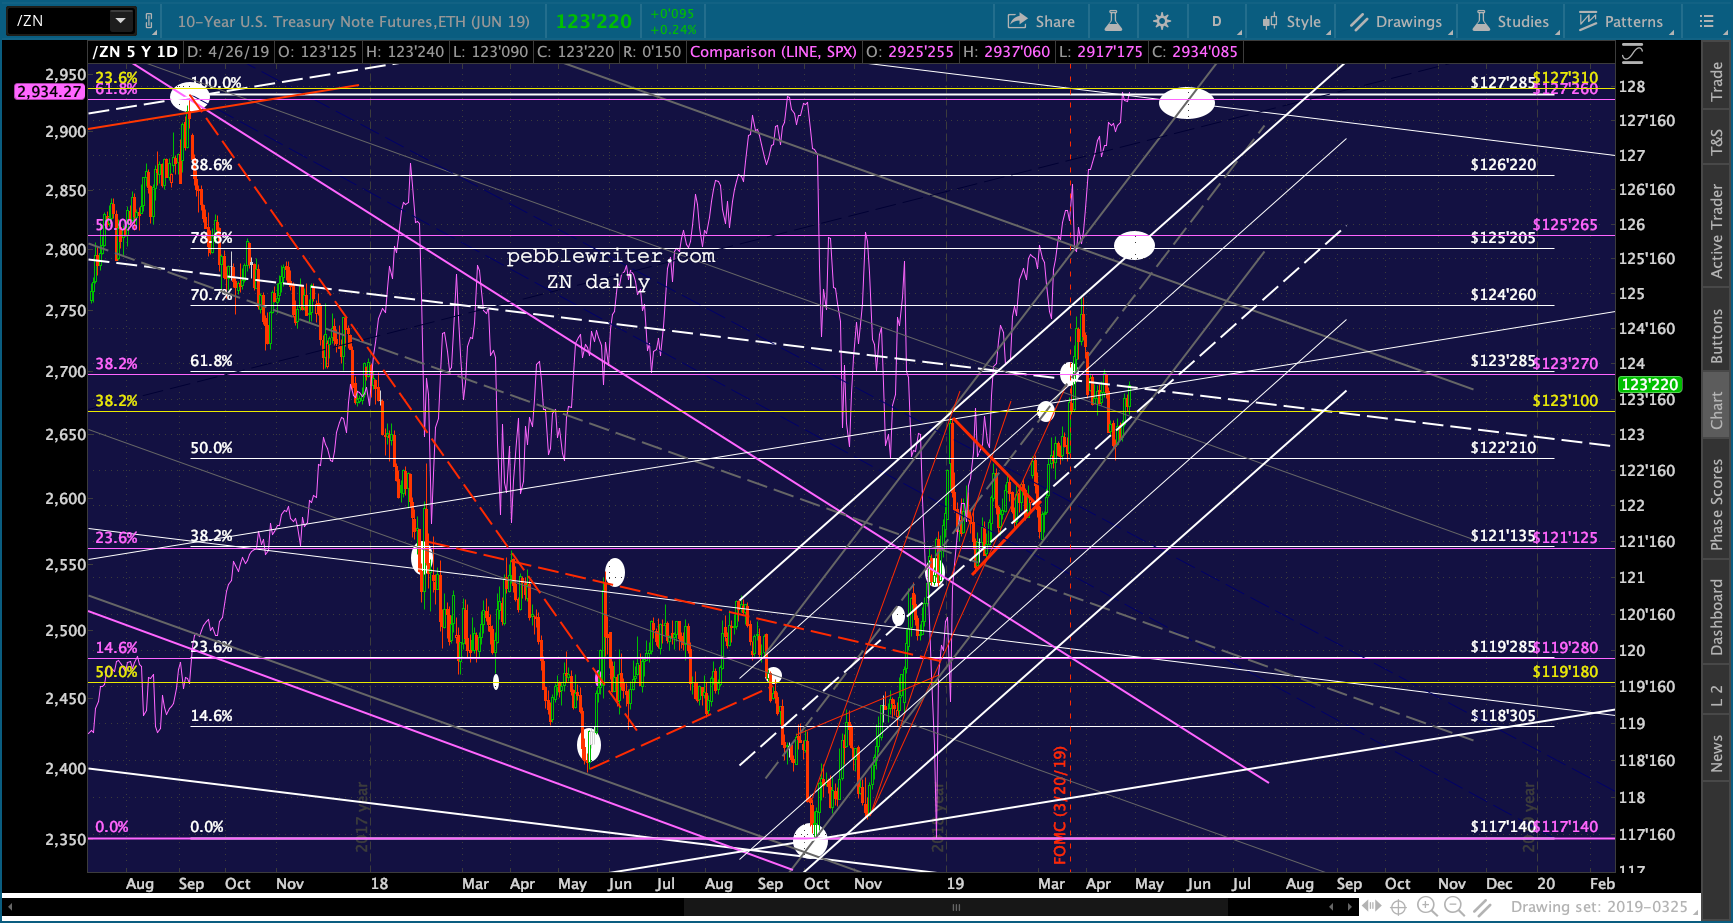
 Futures, which nailed our SMA10 target yesterday and had been in the process of breaking down, shot up to the top of the triangle pattern we’ve been watching — not enough to register as a breakout.
 It will be interesting to see how the Fed spins the latest data to fit their dovish stance. Our downside narrative remains intact.
continued for members…
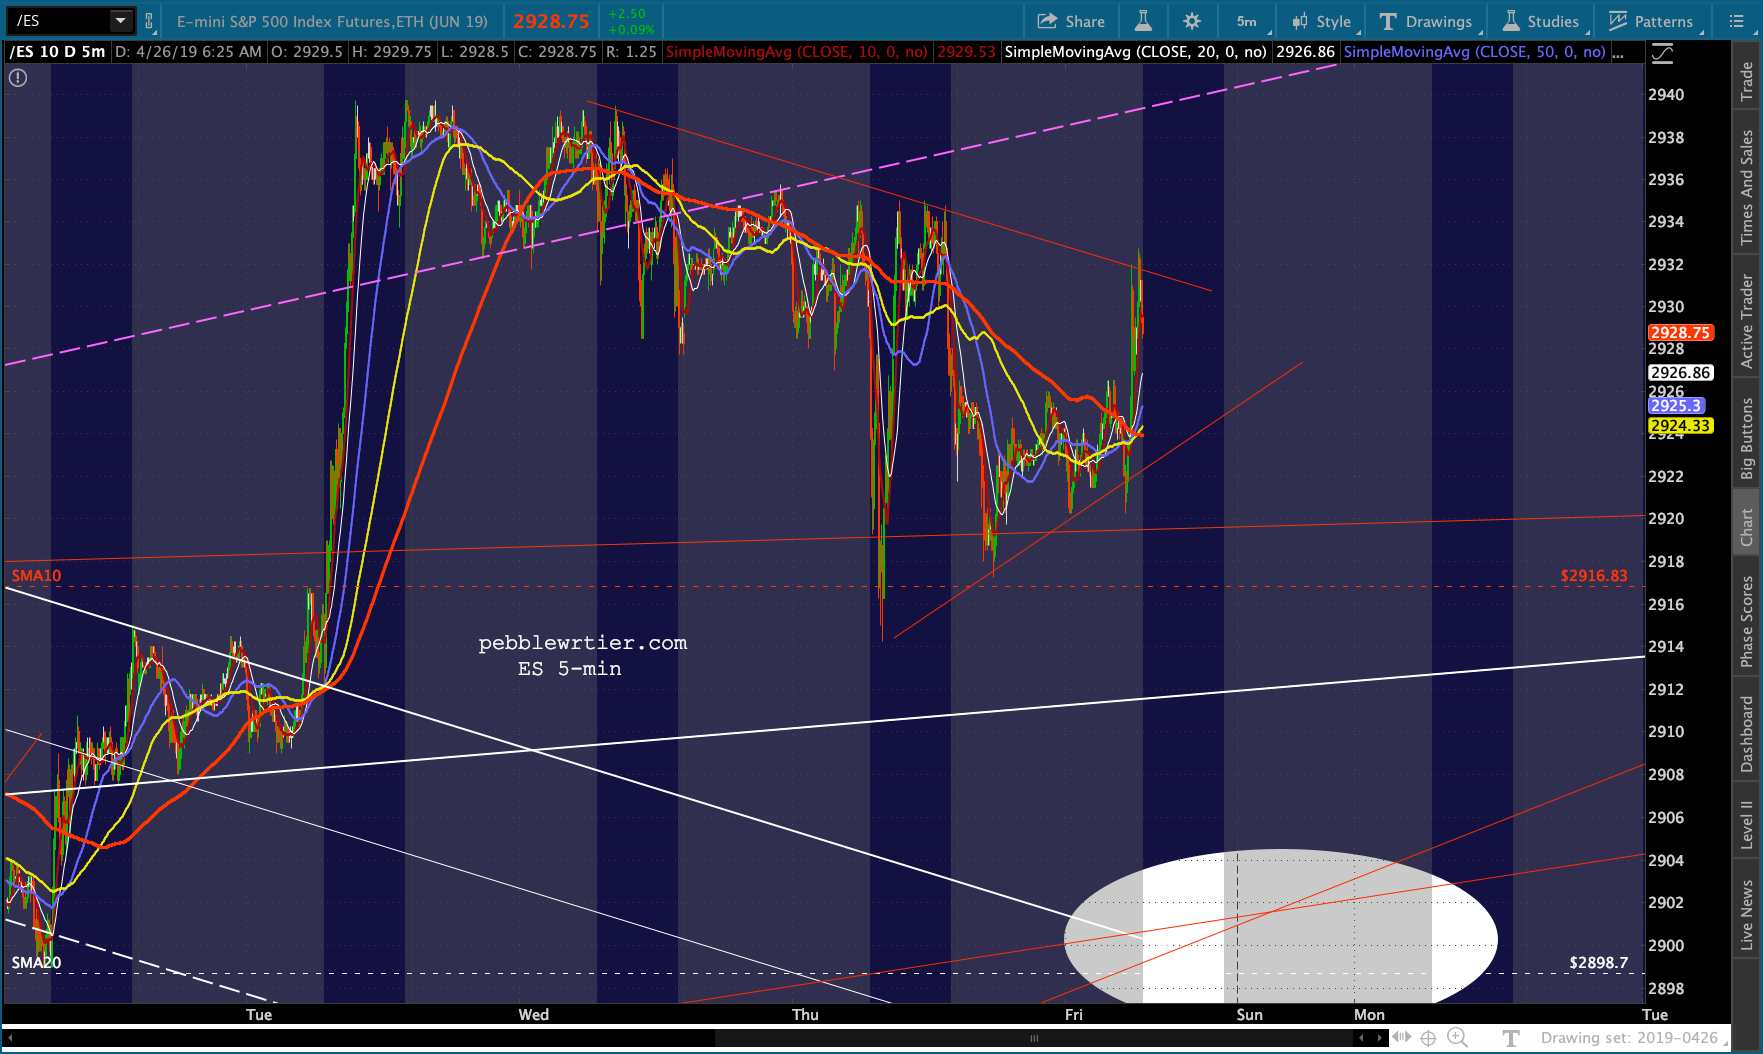
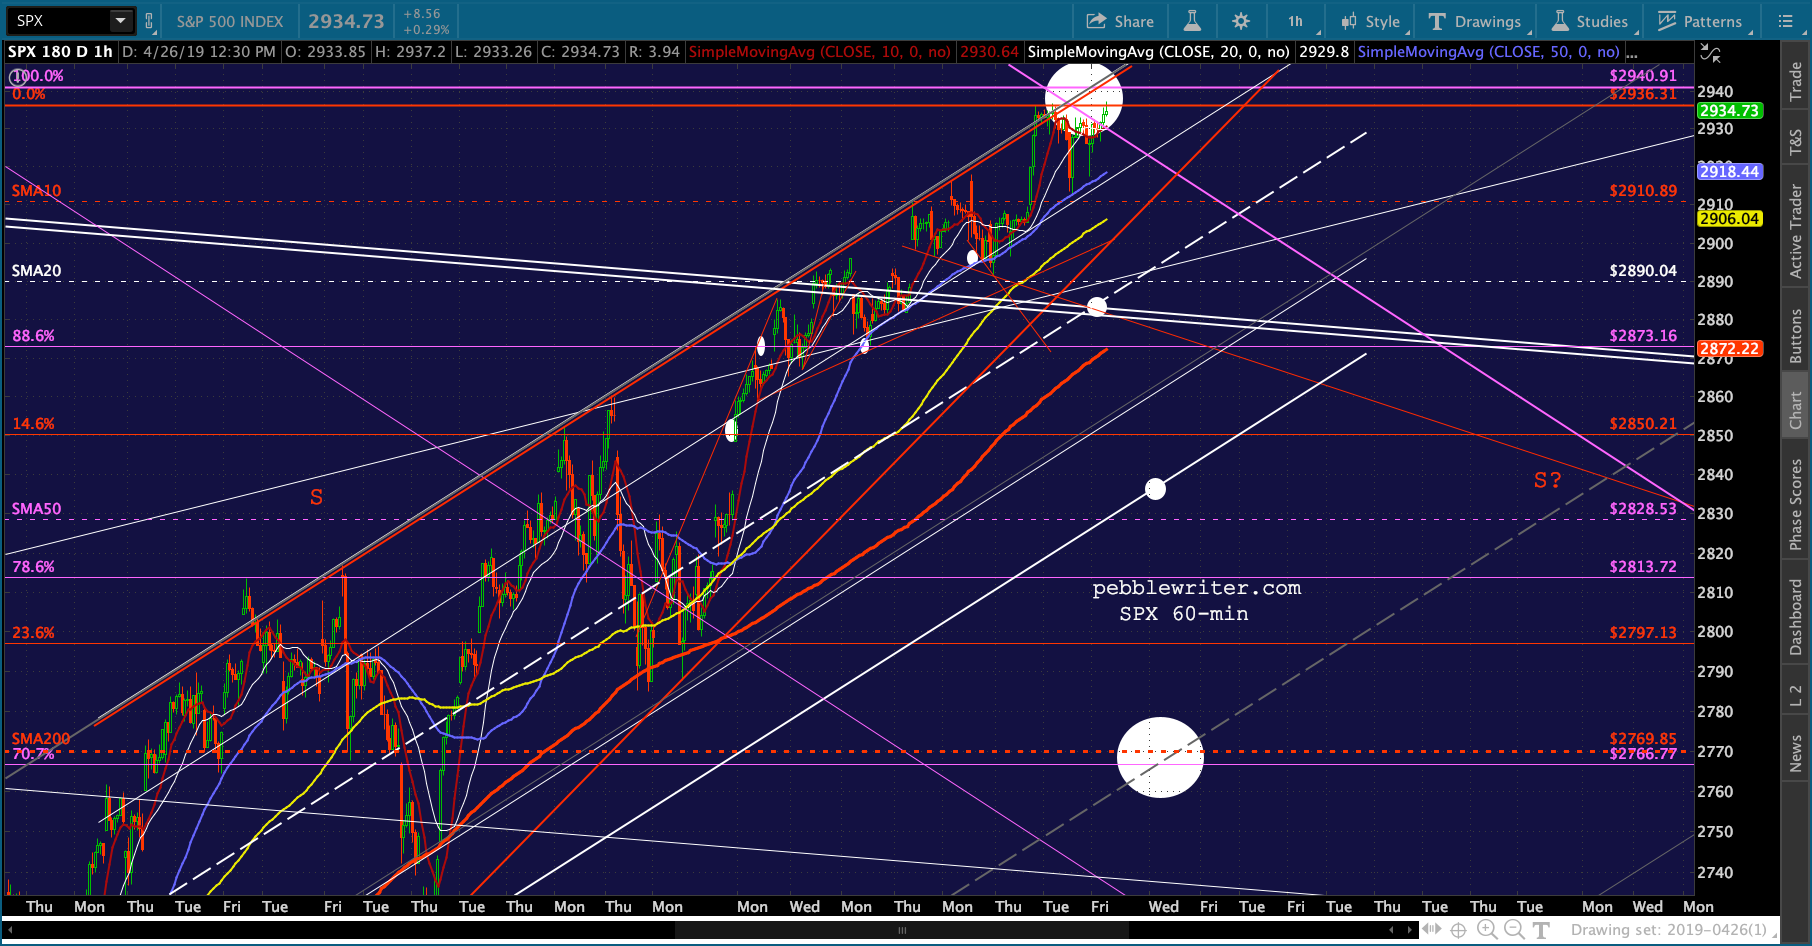
ES’ chart before…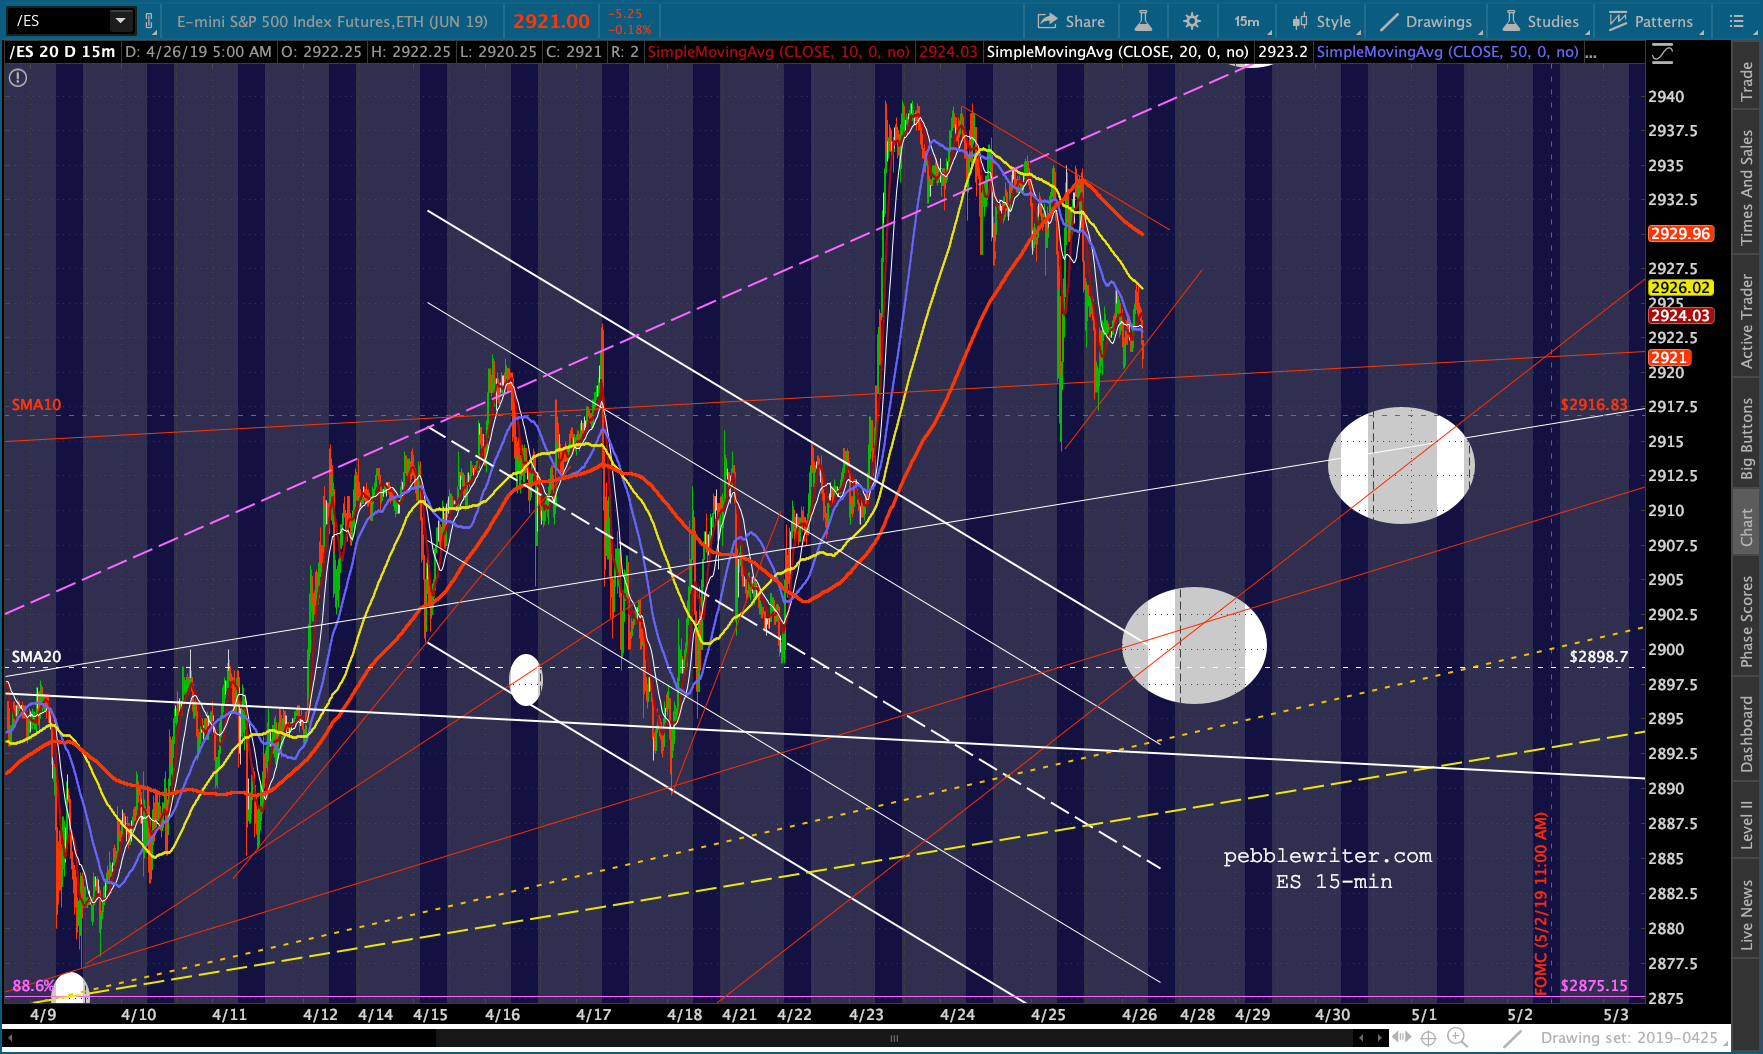 …and after.
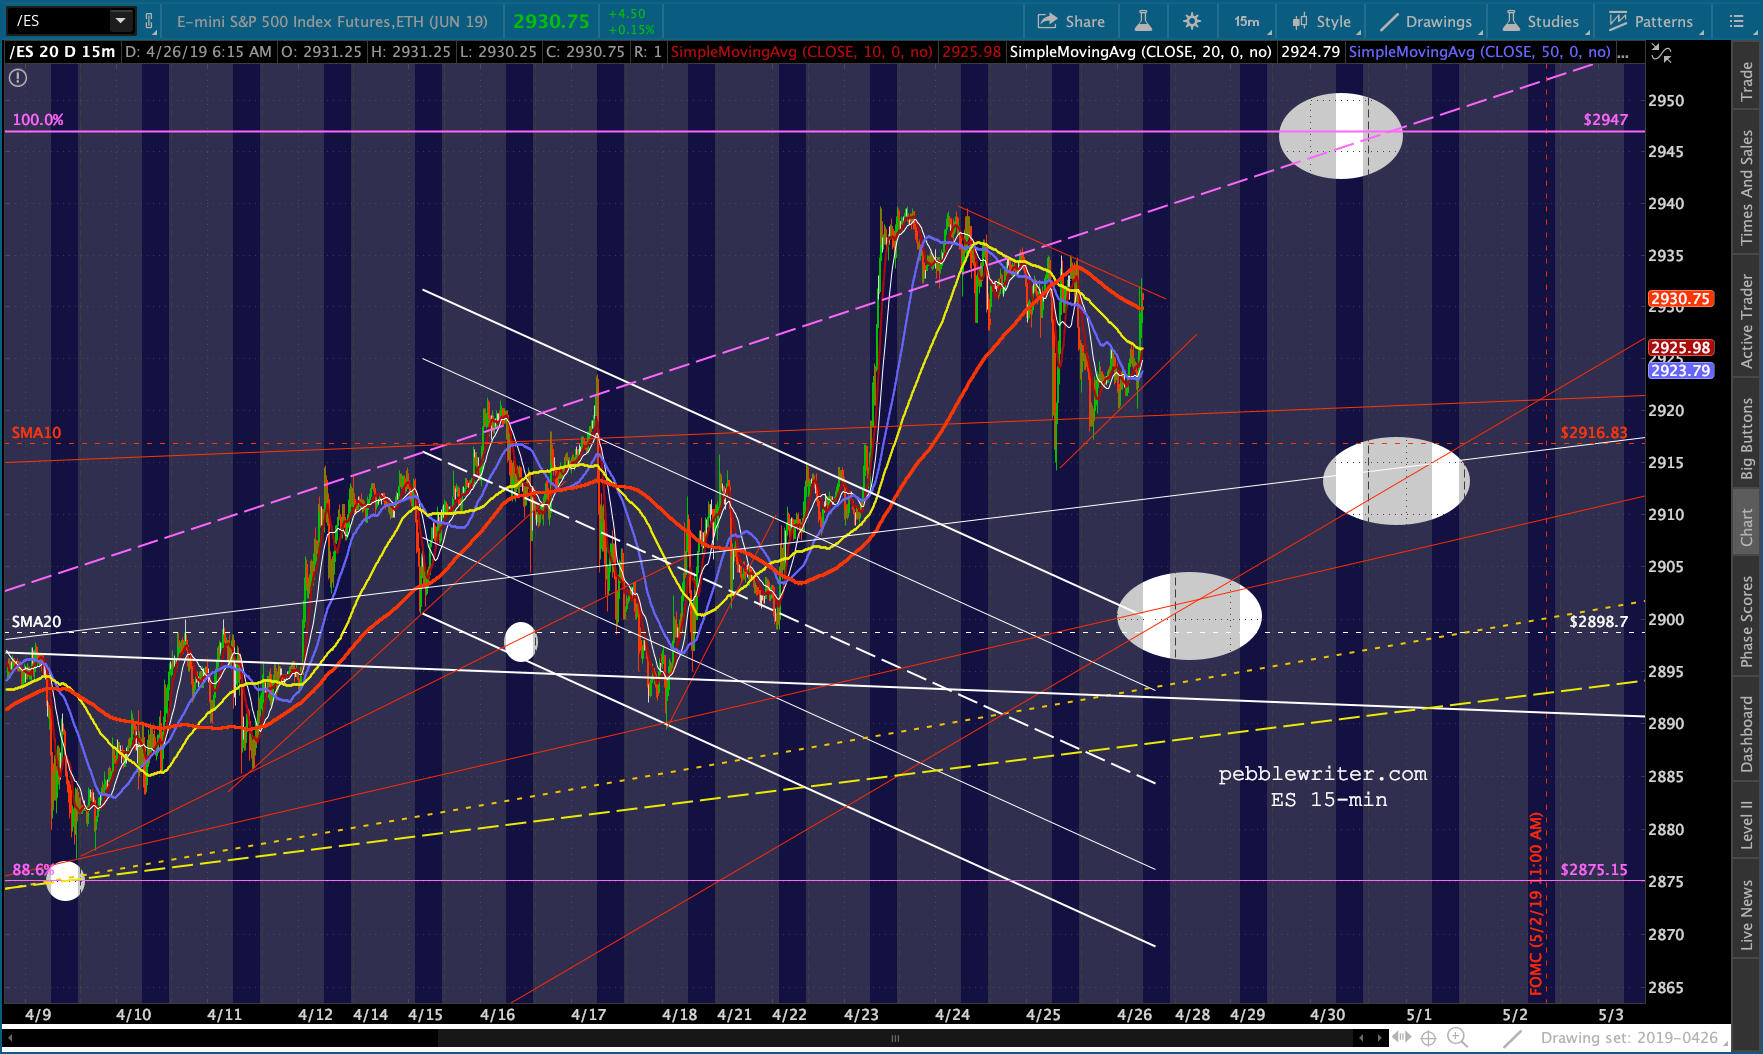 SPX has well-defined downside targets…
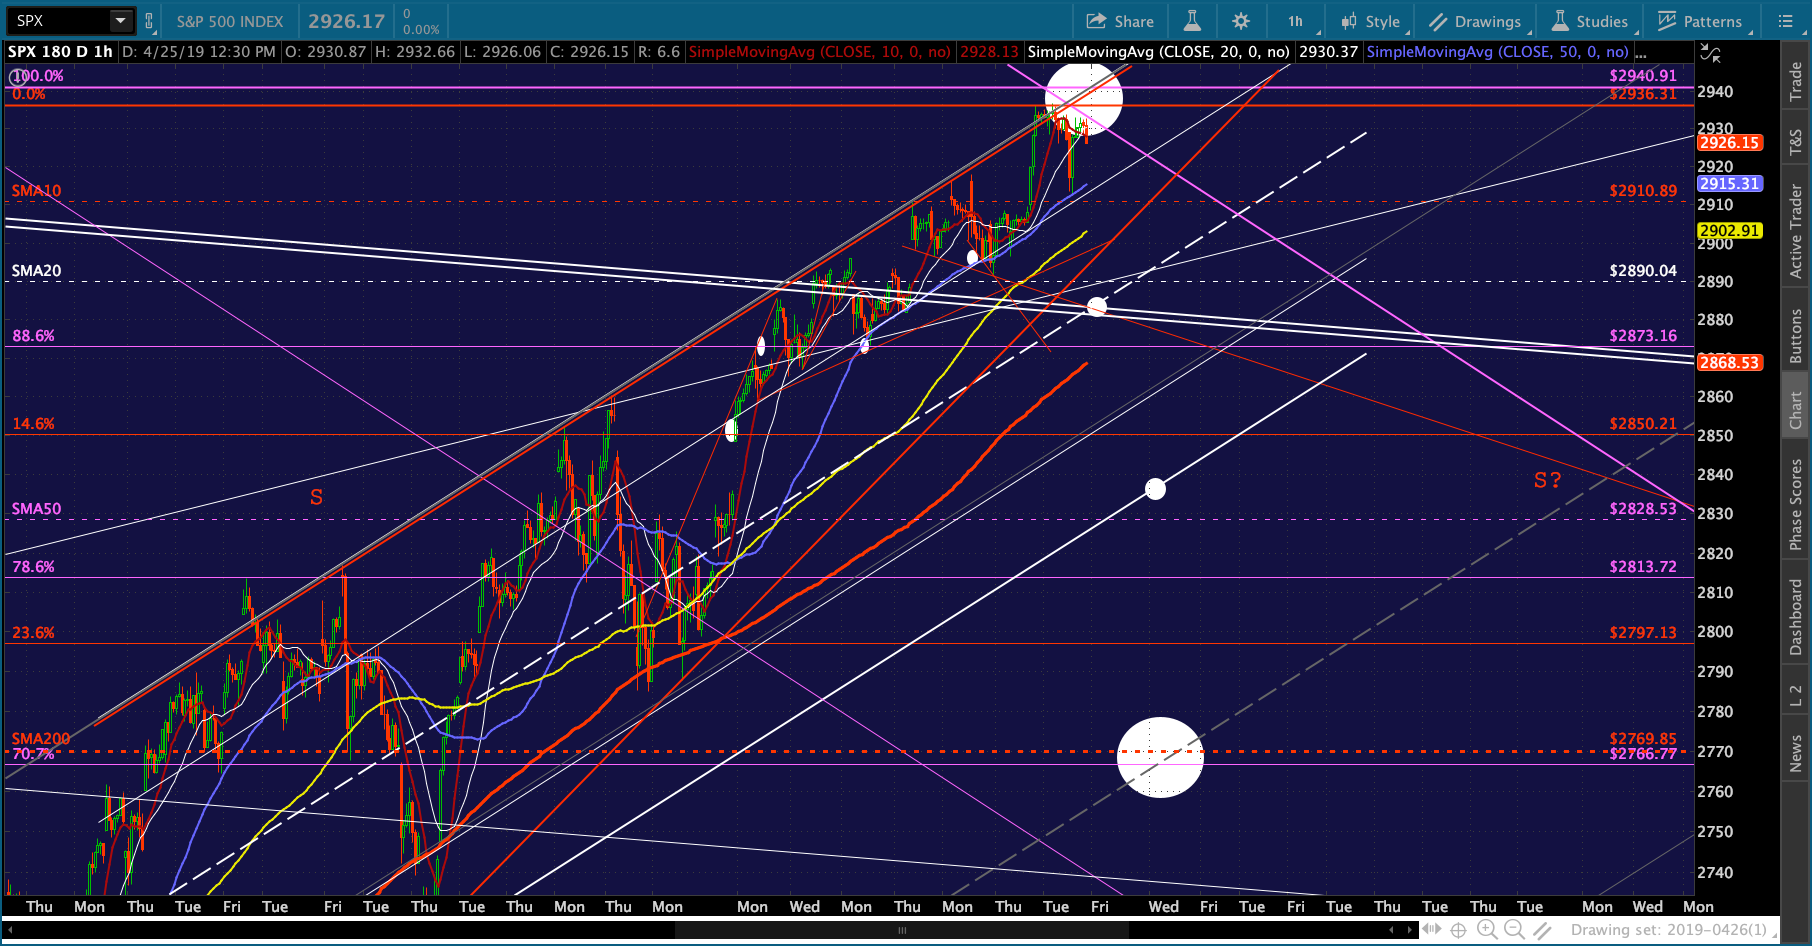 …provided VIX can hold the rising TL and its 10 and 20-day moving averages.
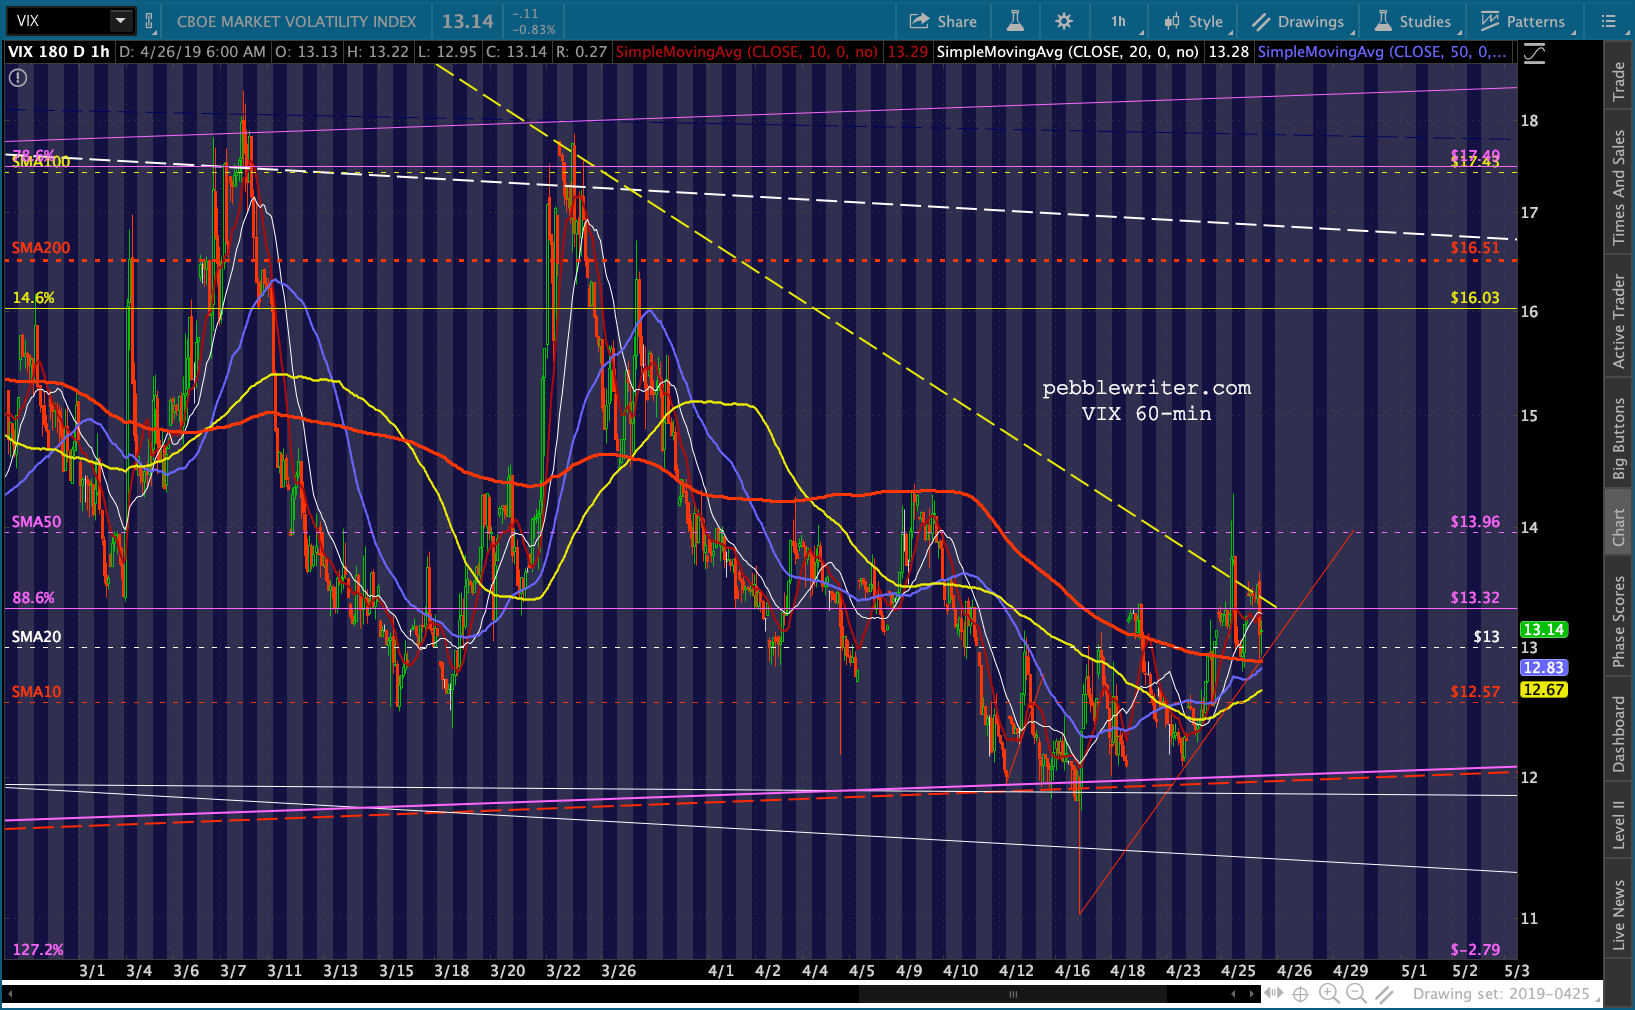 USDJPY continues to cooperate…
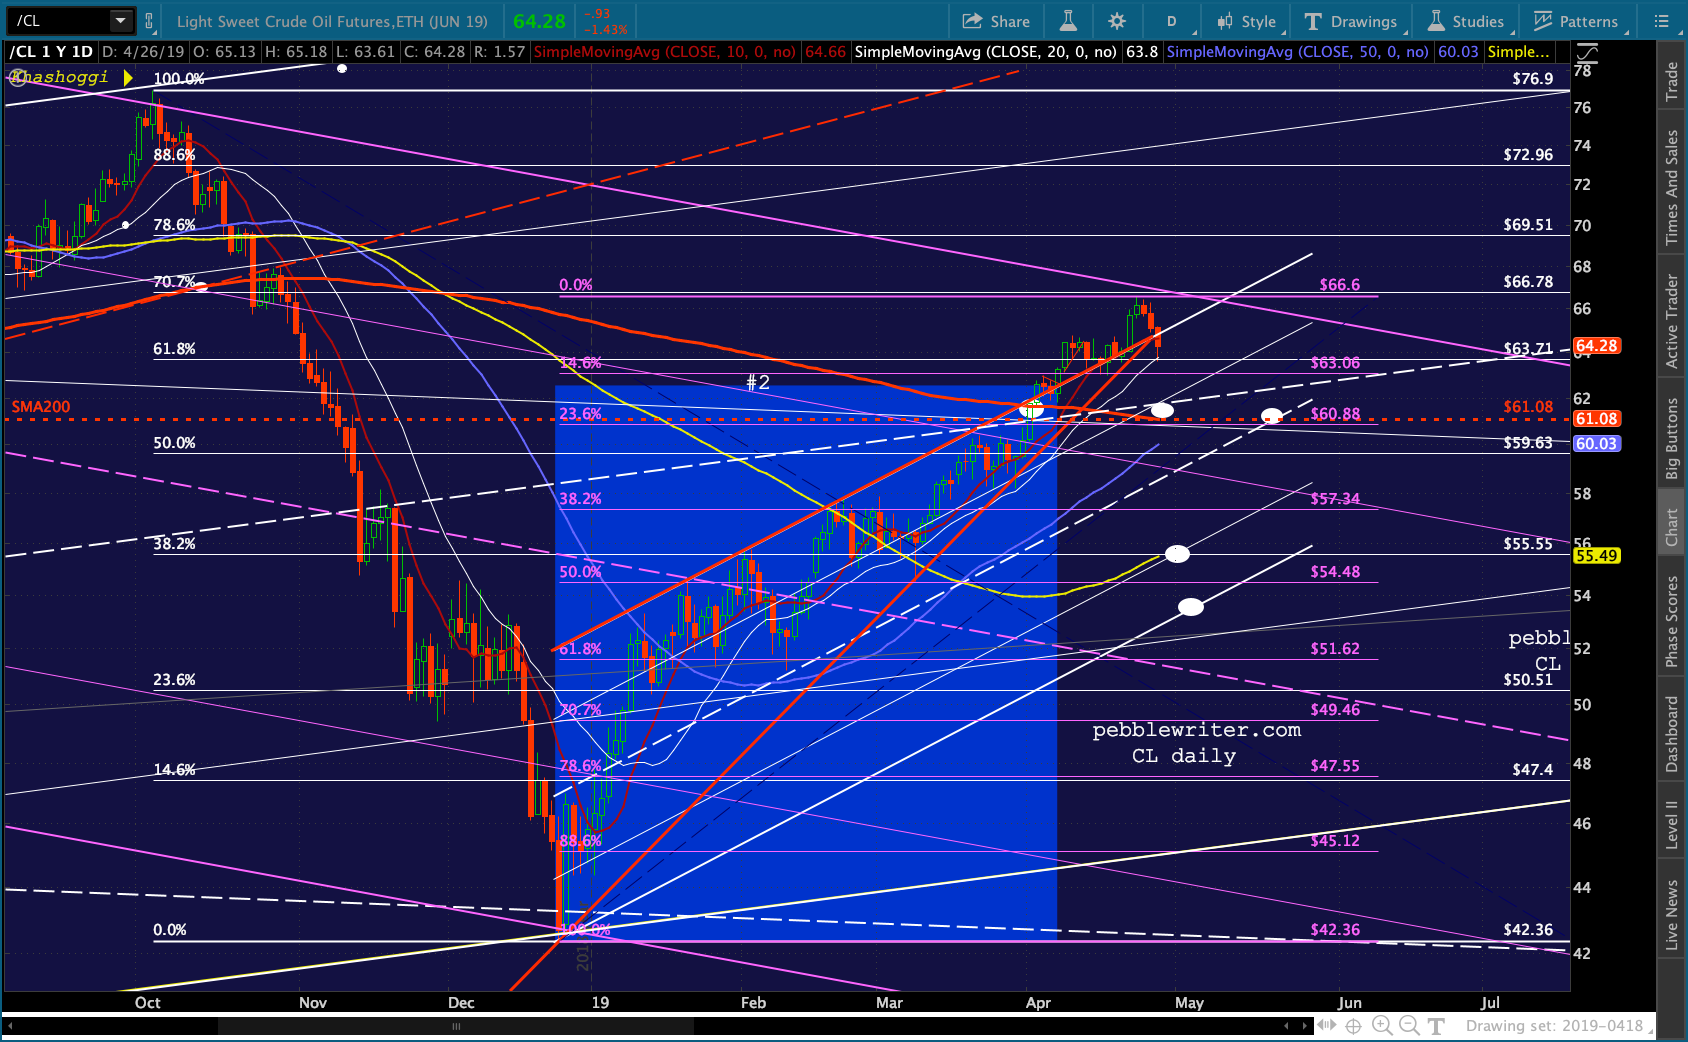
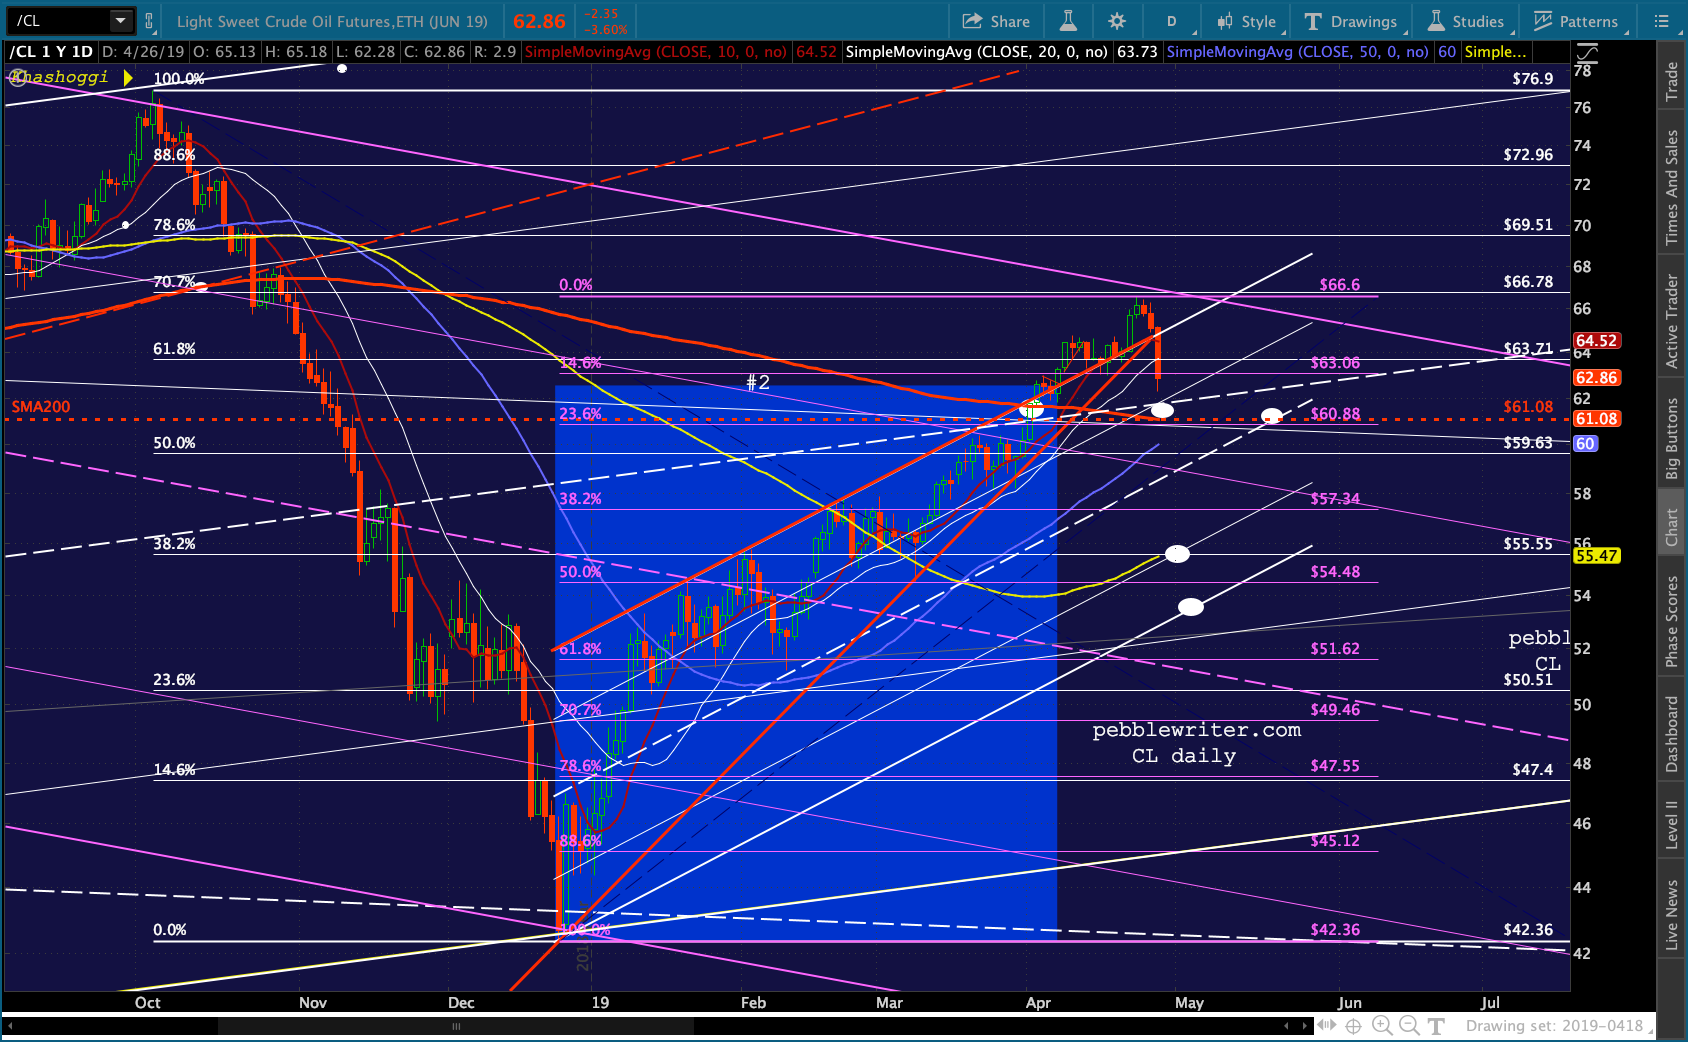
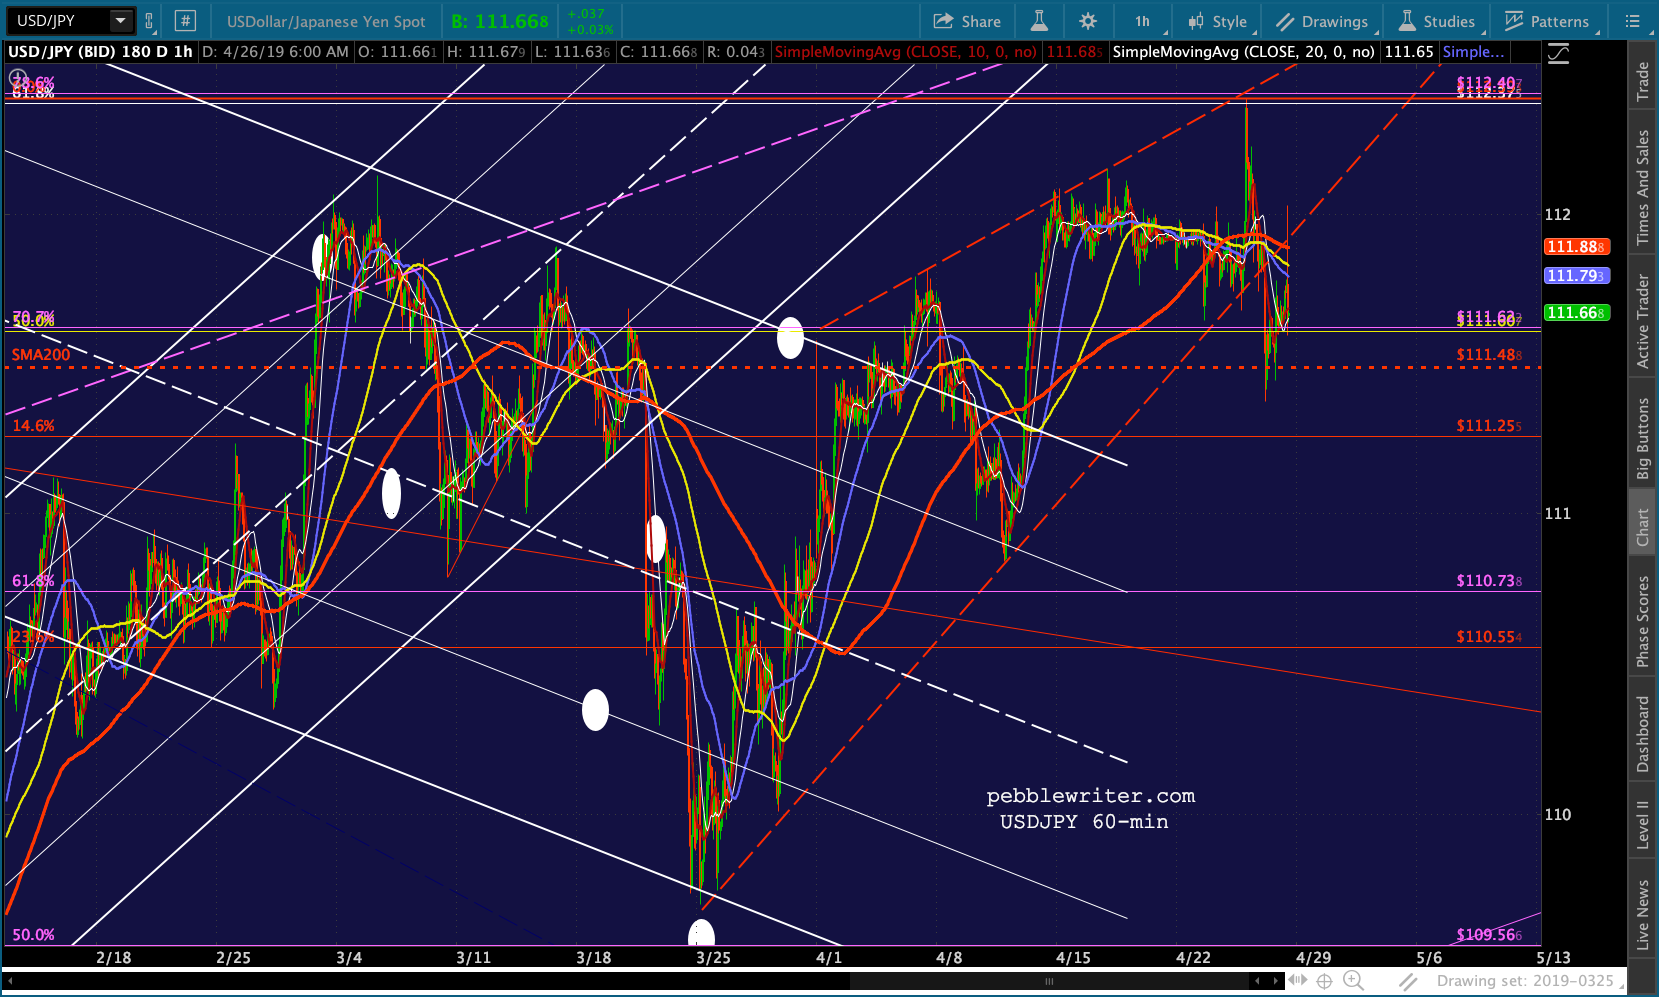 …as do RB and CL.
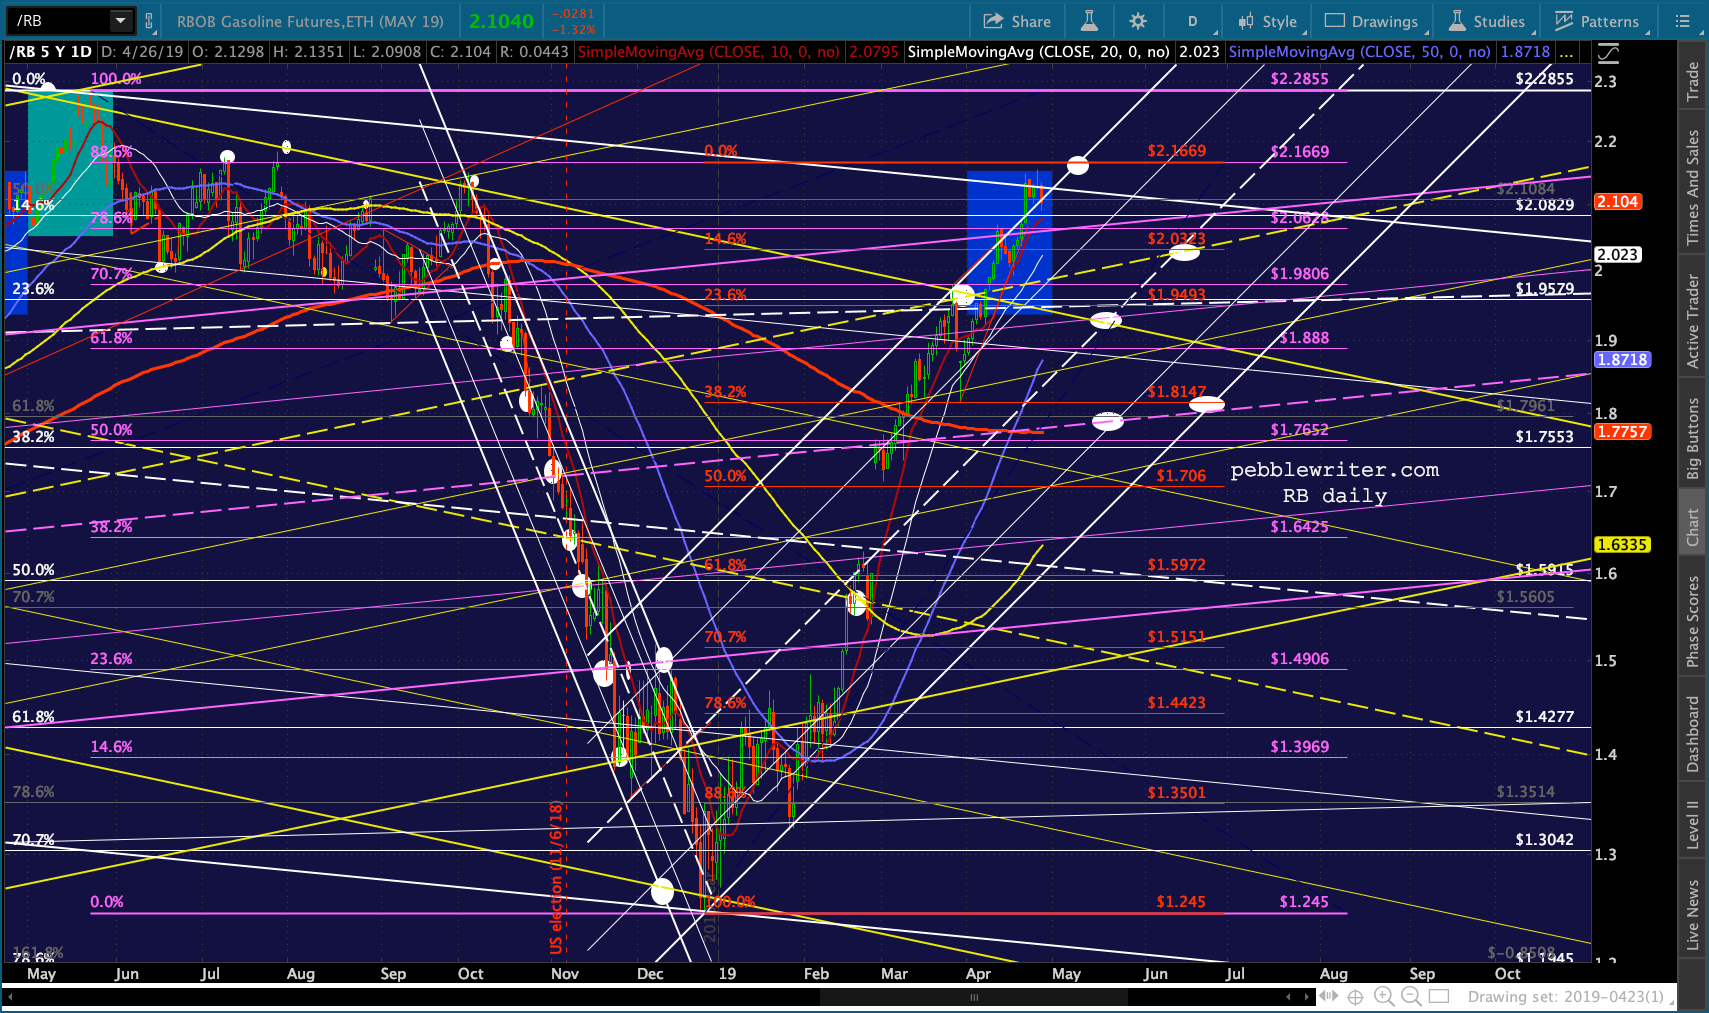
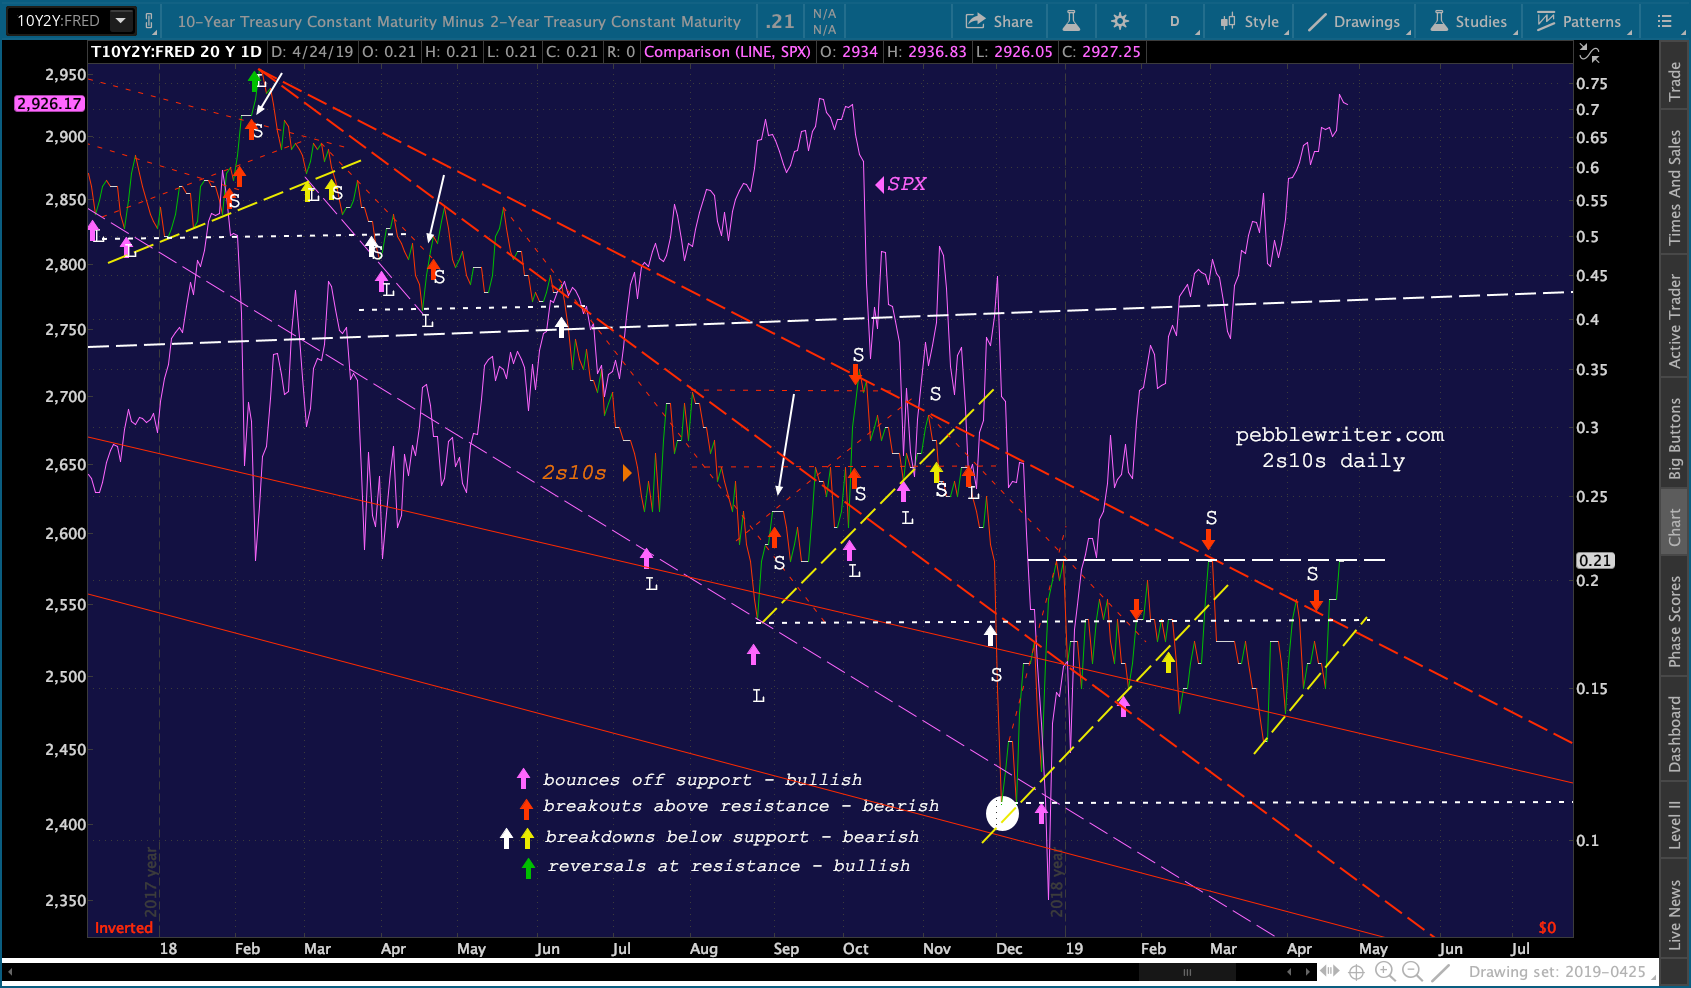
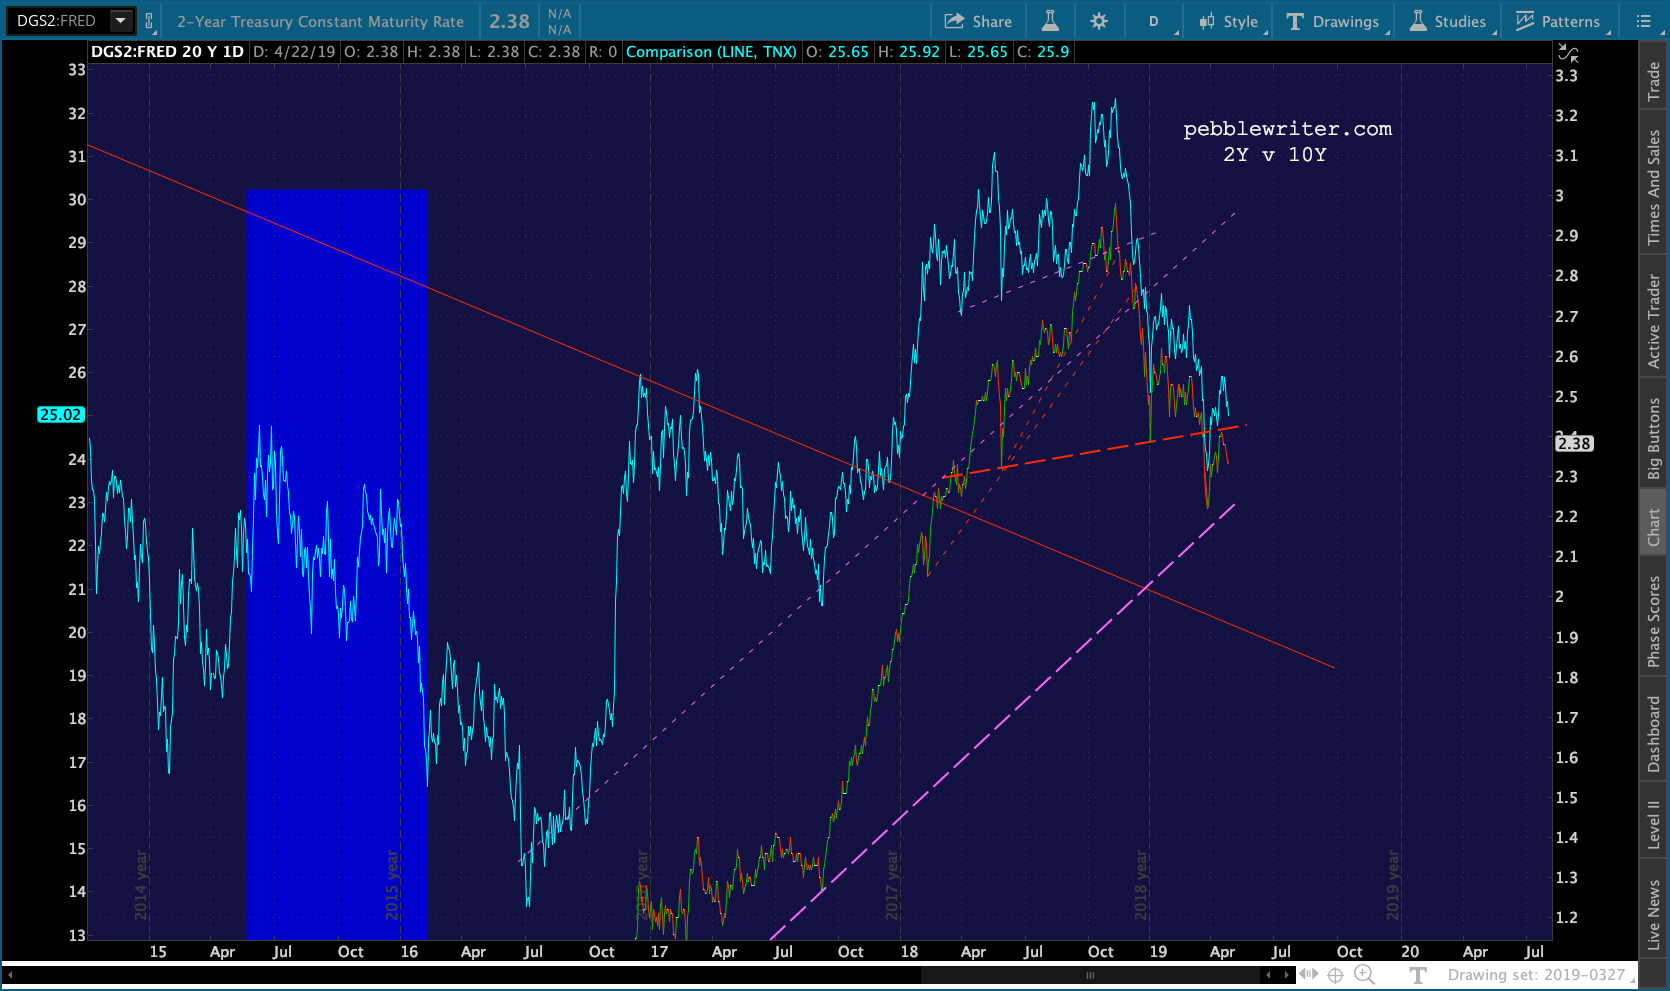
 One might imagine a higher interest rate scenario arising from such economic data — one which would drive 10Y yields higher. But, in this case, flow matters more than expectations. And, right now, flow reflects equity investors’ doubts that the Fed can
 continue to prop up stocks maintain a dovish stance.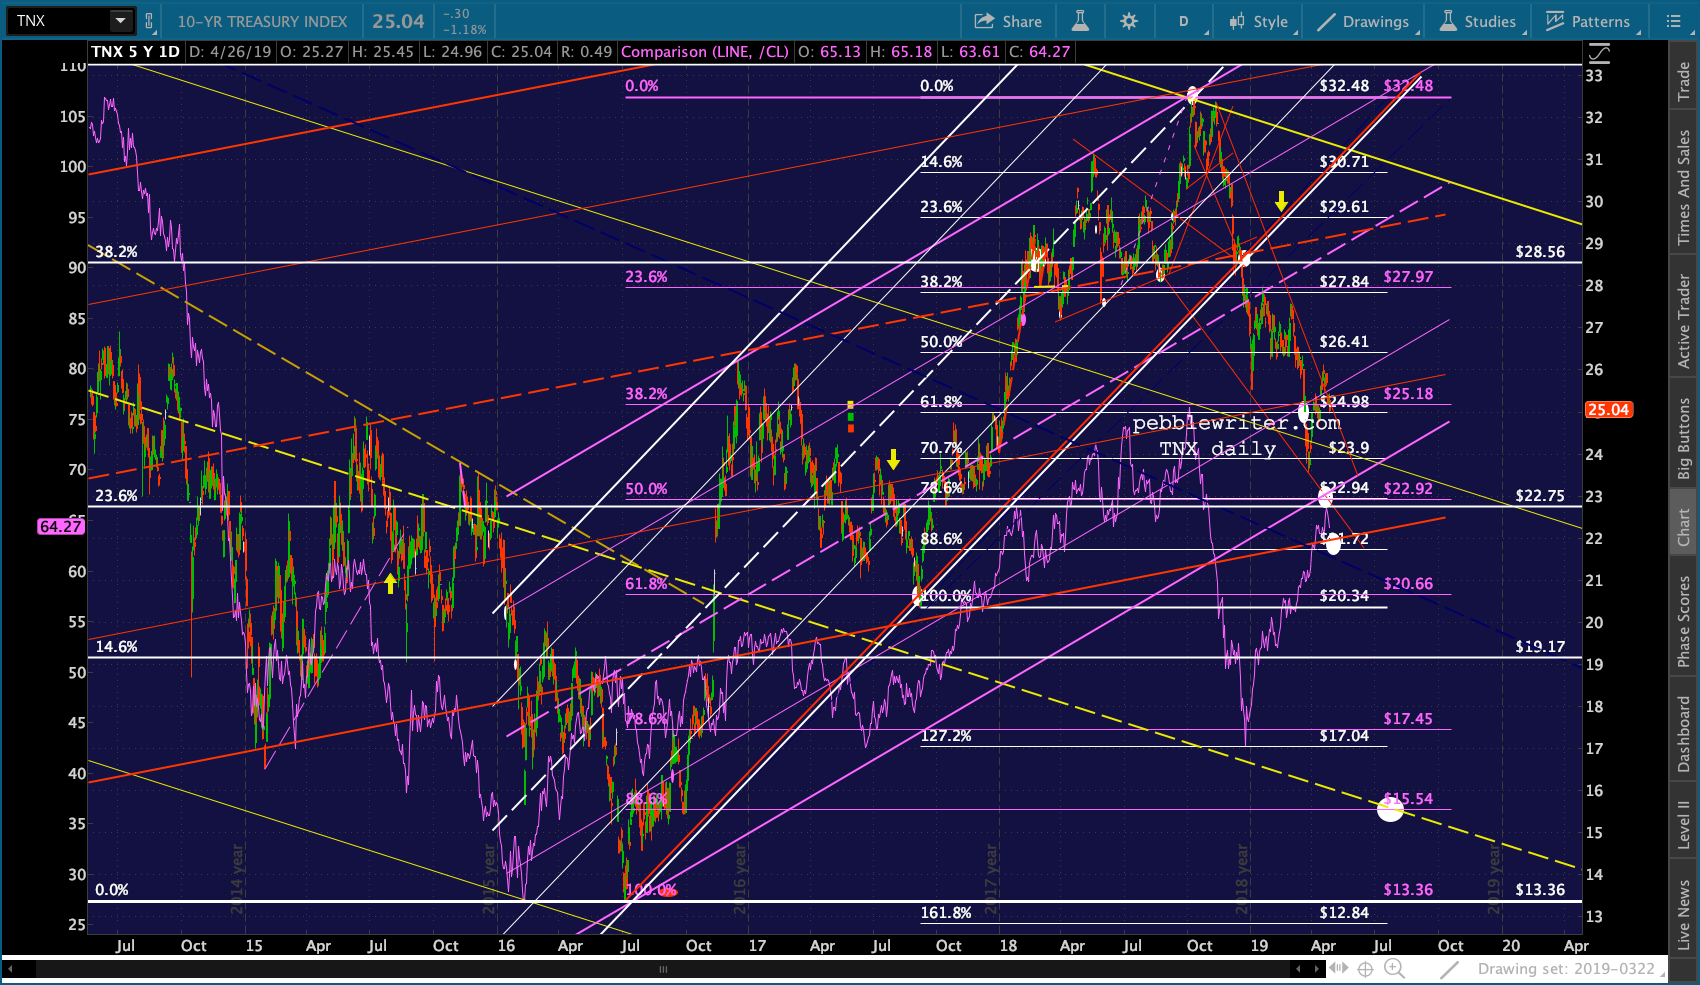
 UPDATE: 3:50 PM
More late-session VIX action – just enough to help ES/SPX break out of the triangle but, so far at least, not propel them to new highs.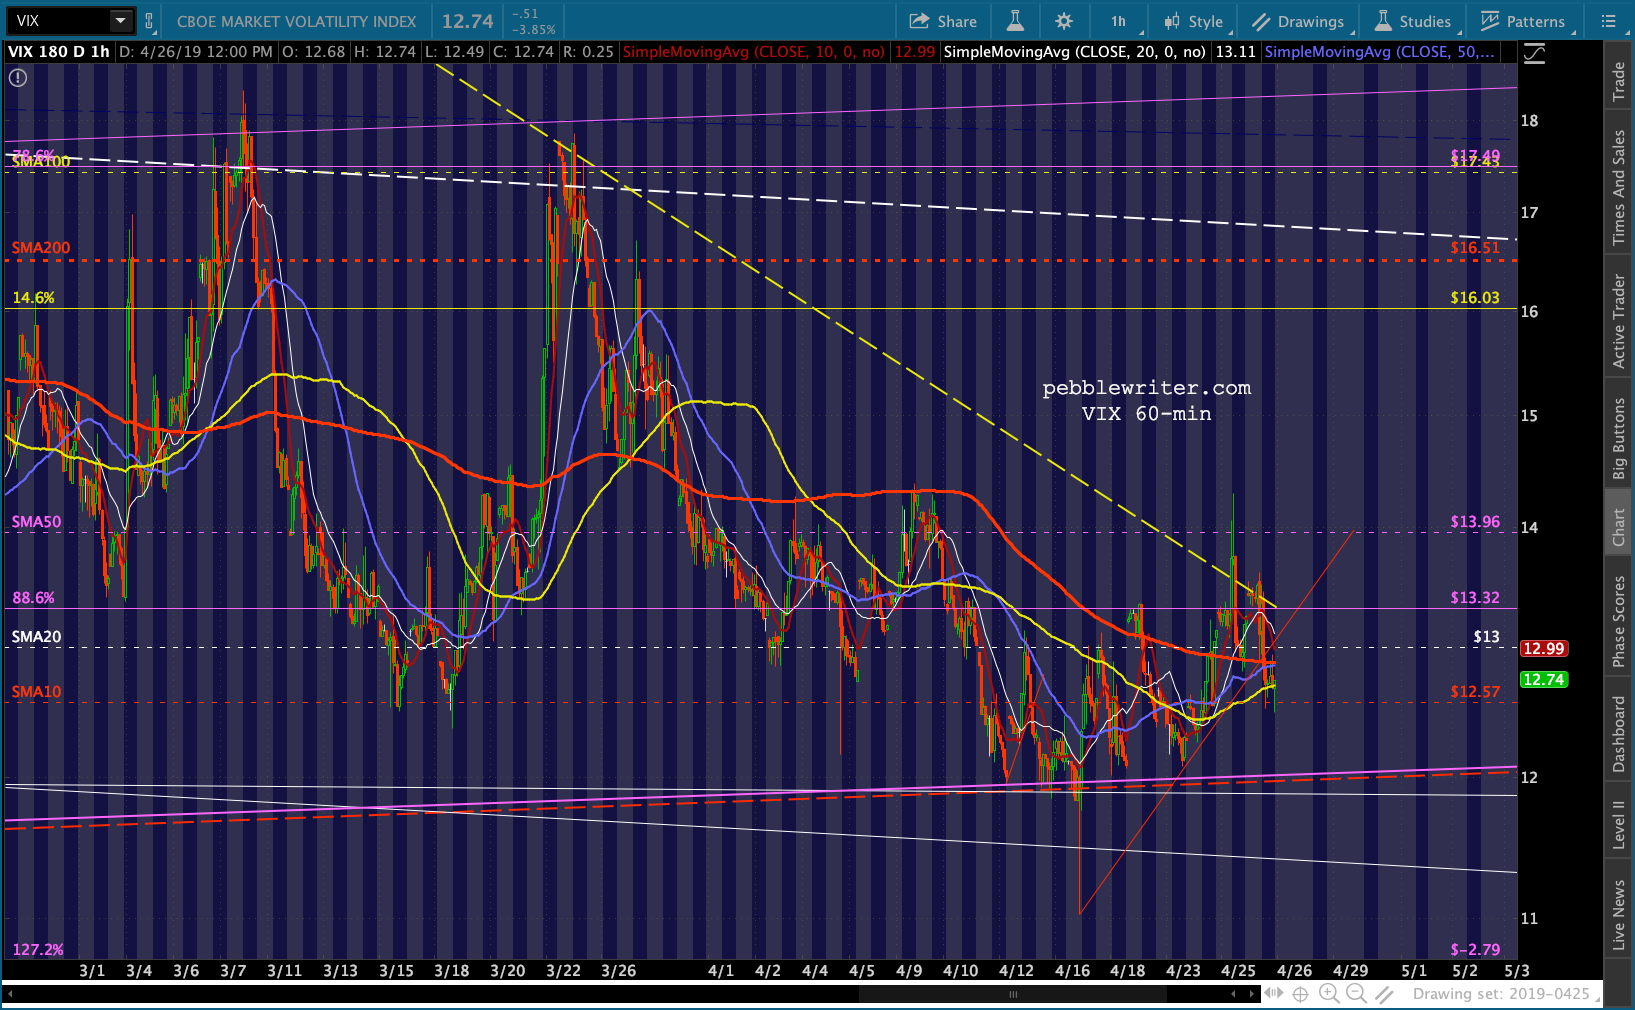 Everything but VIX looks blatantly bearish. But, this is an OPEX weekend at the tail end of a low-volume holiday week, so the risk is higher than usual of a headfake.
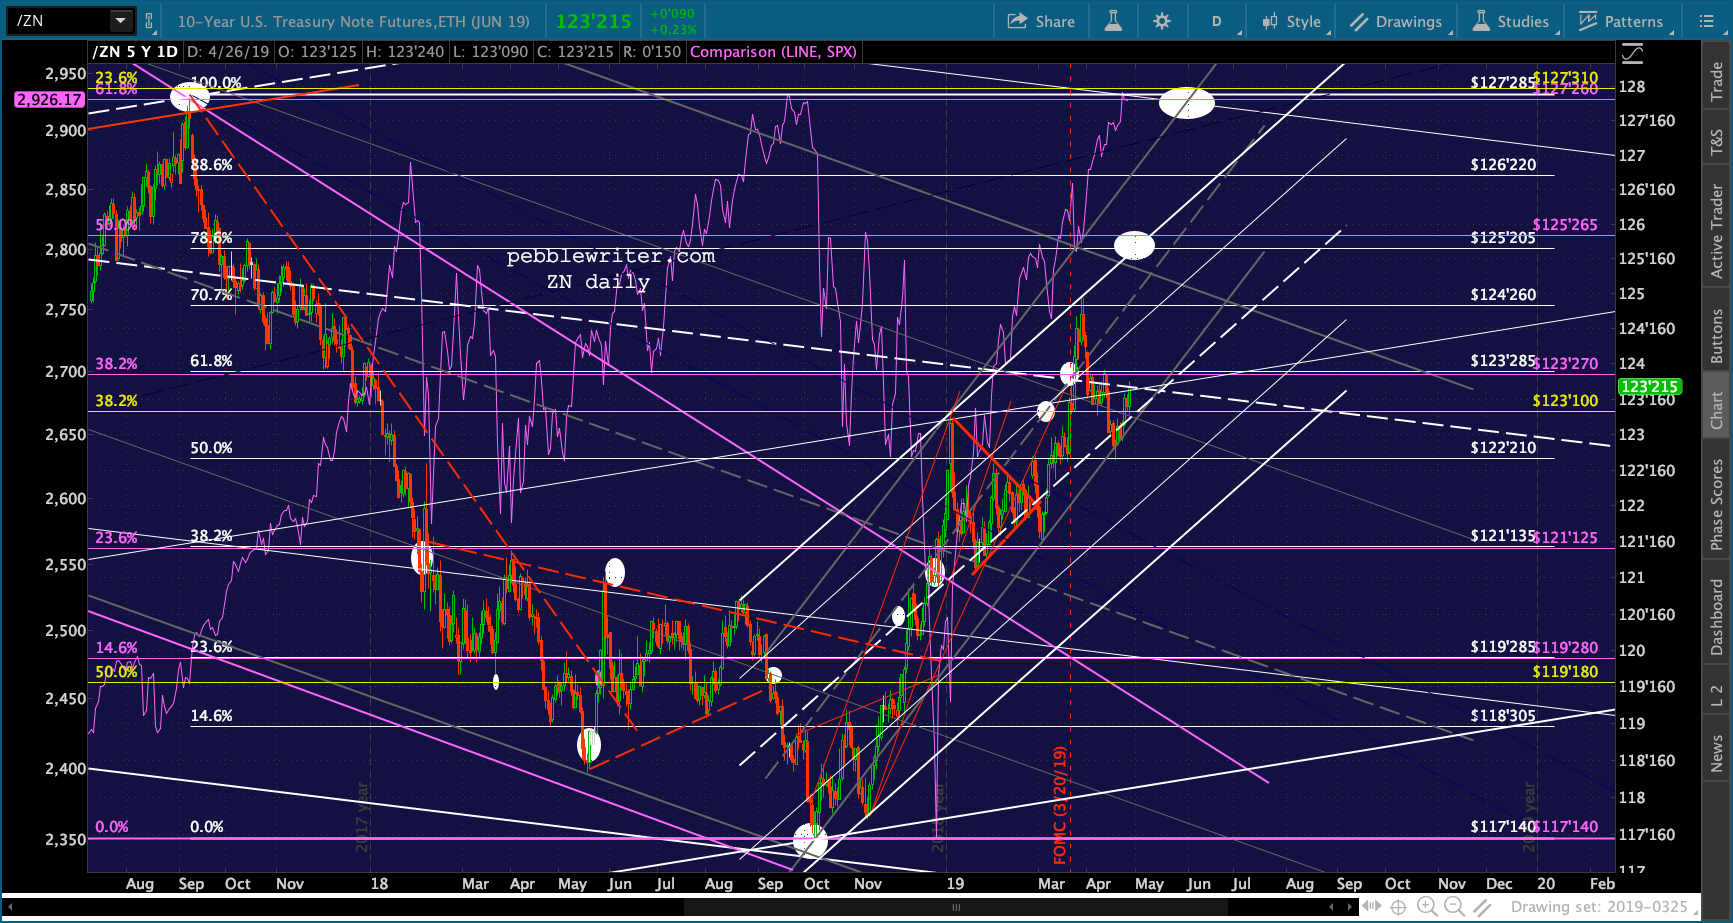
Rates continue to sink…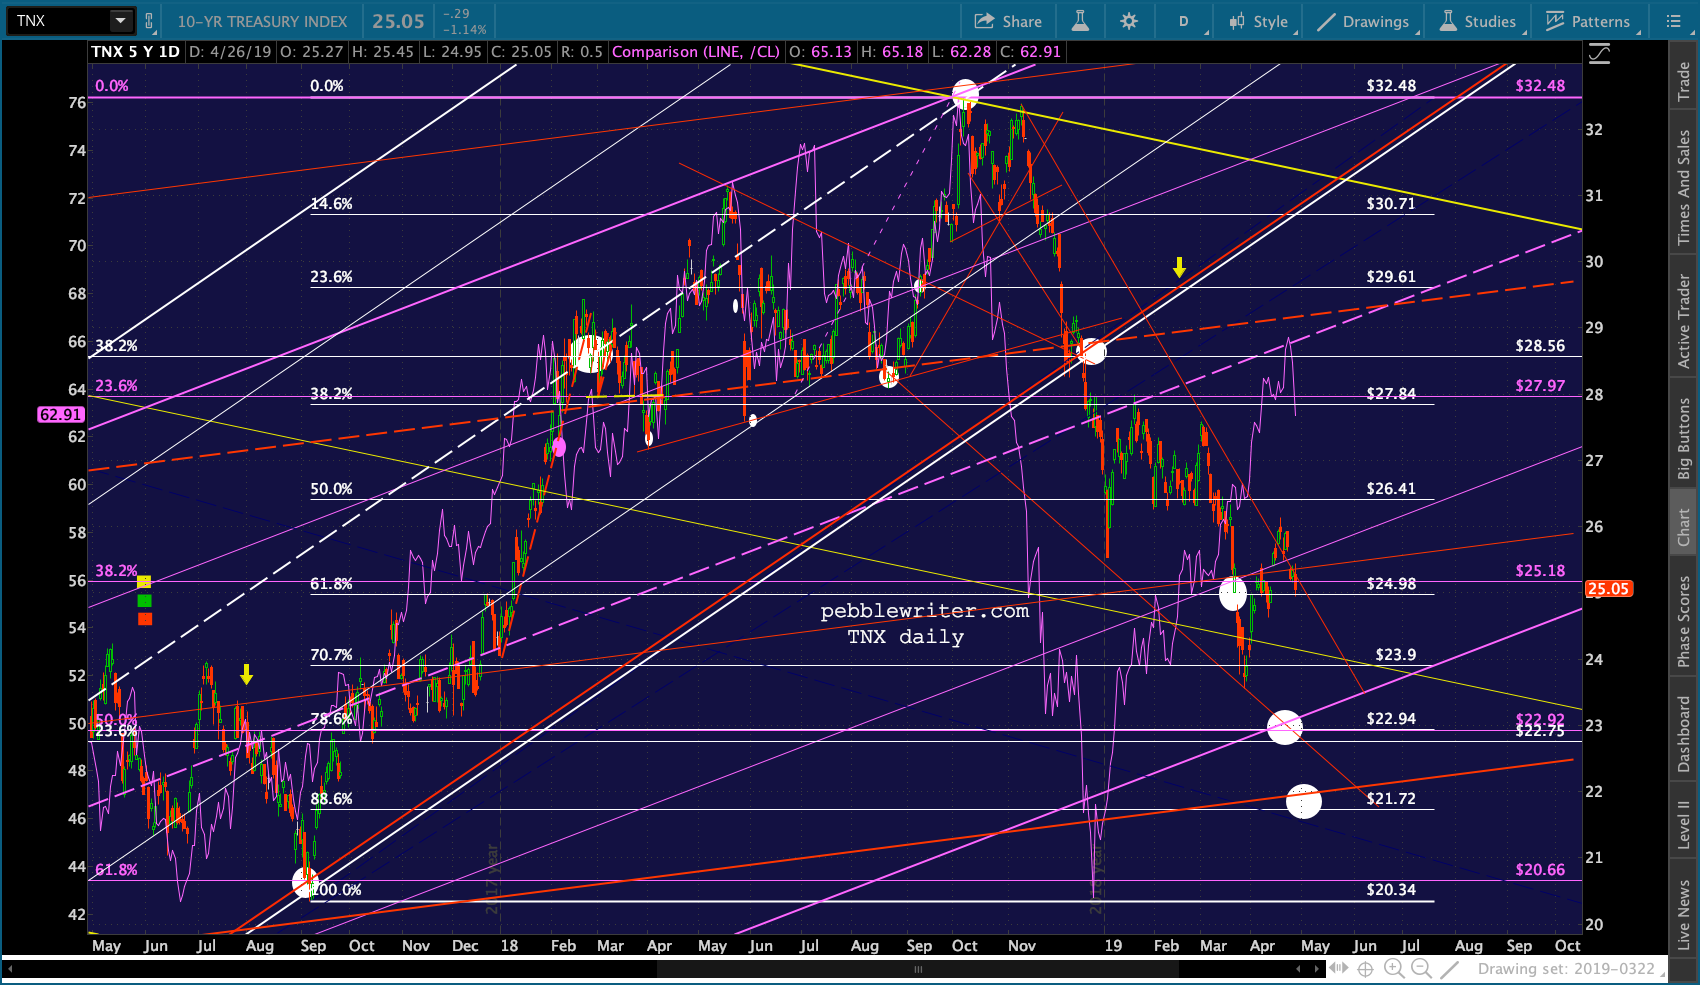
 USDJPY remains broken down (though has slipped above its SMA200.)
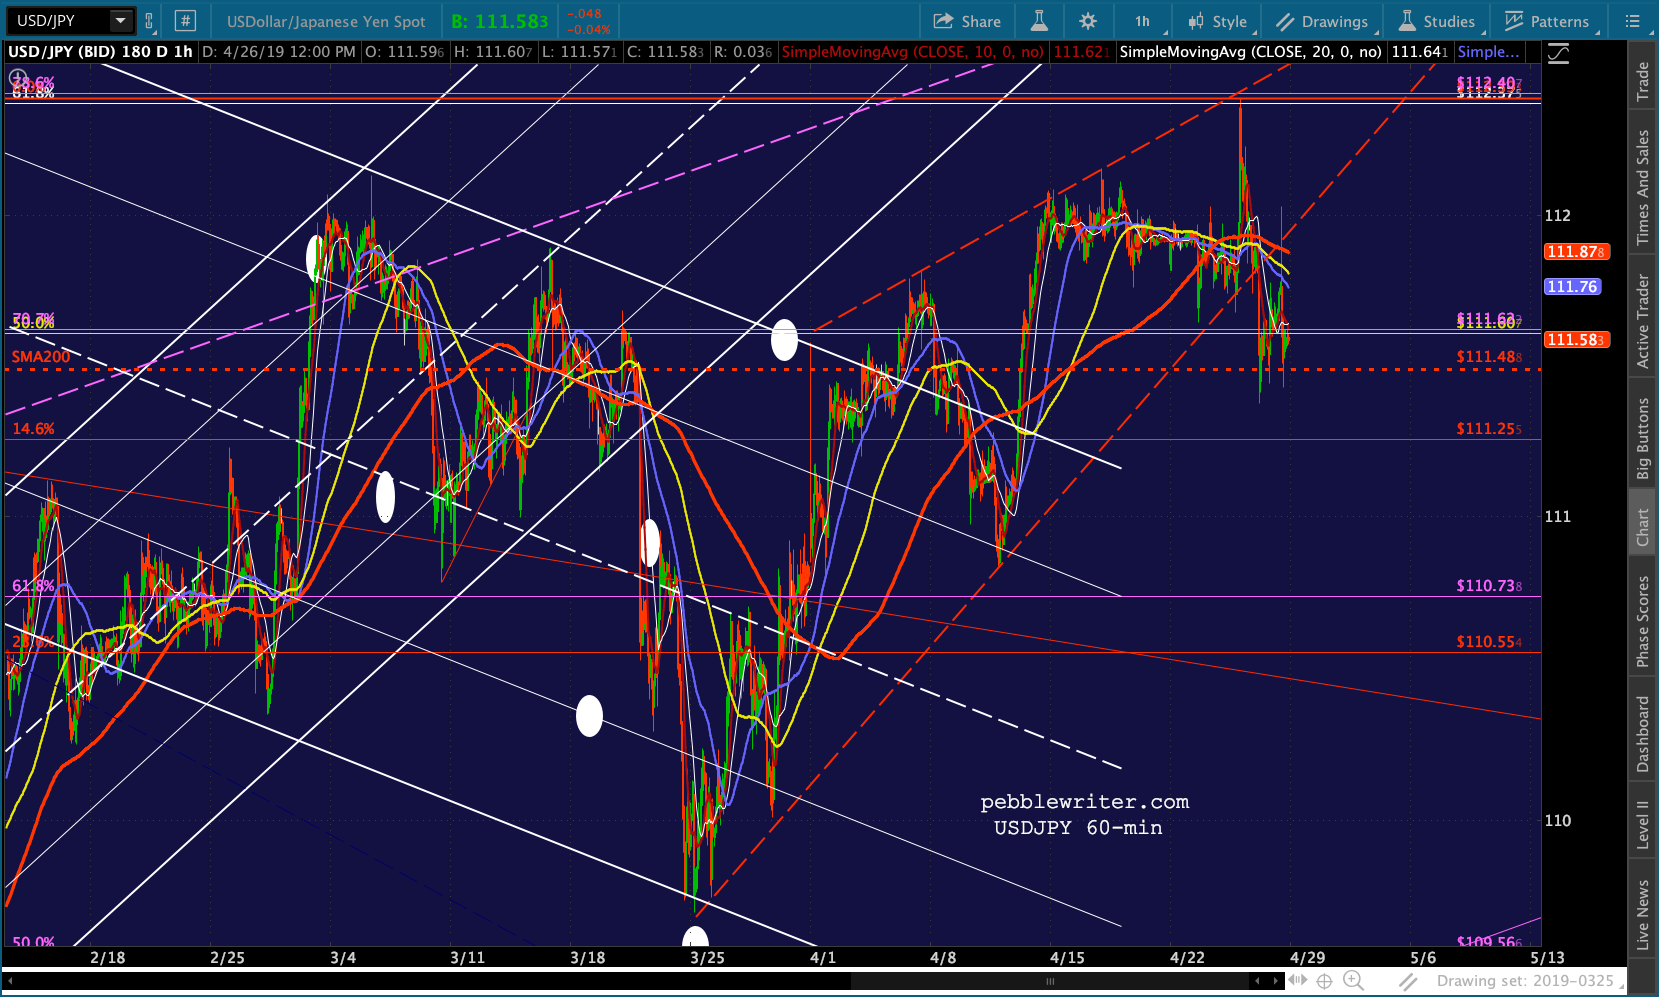 RB and CL are having a bad day…
 …as is TSLA.
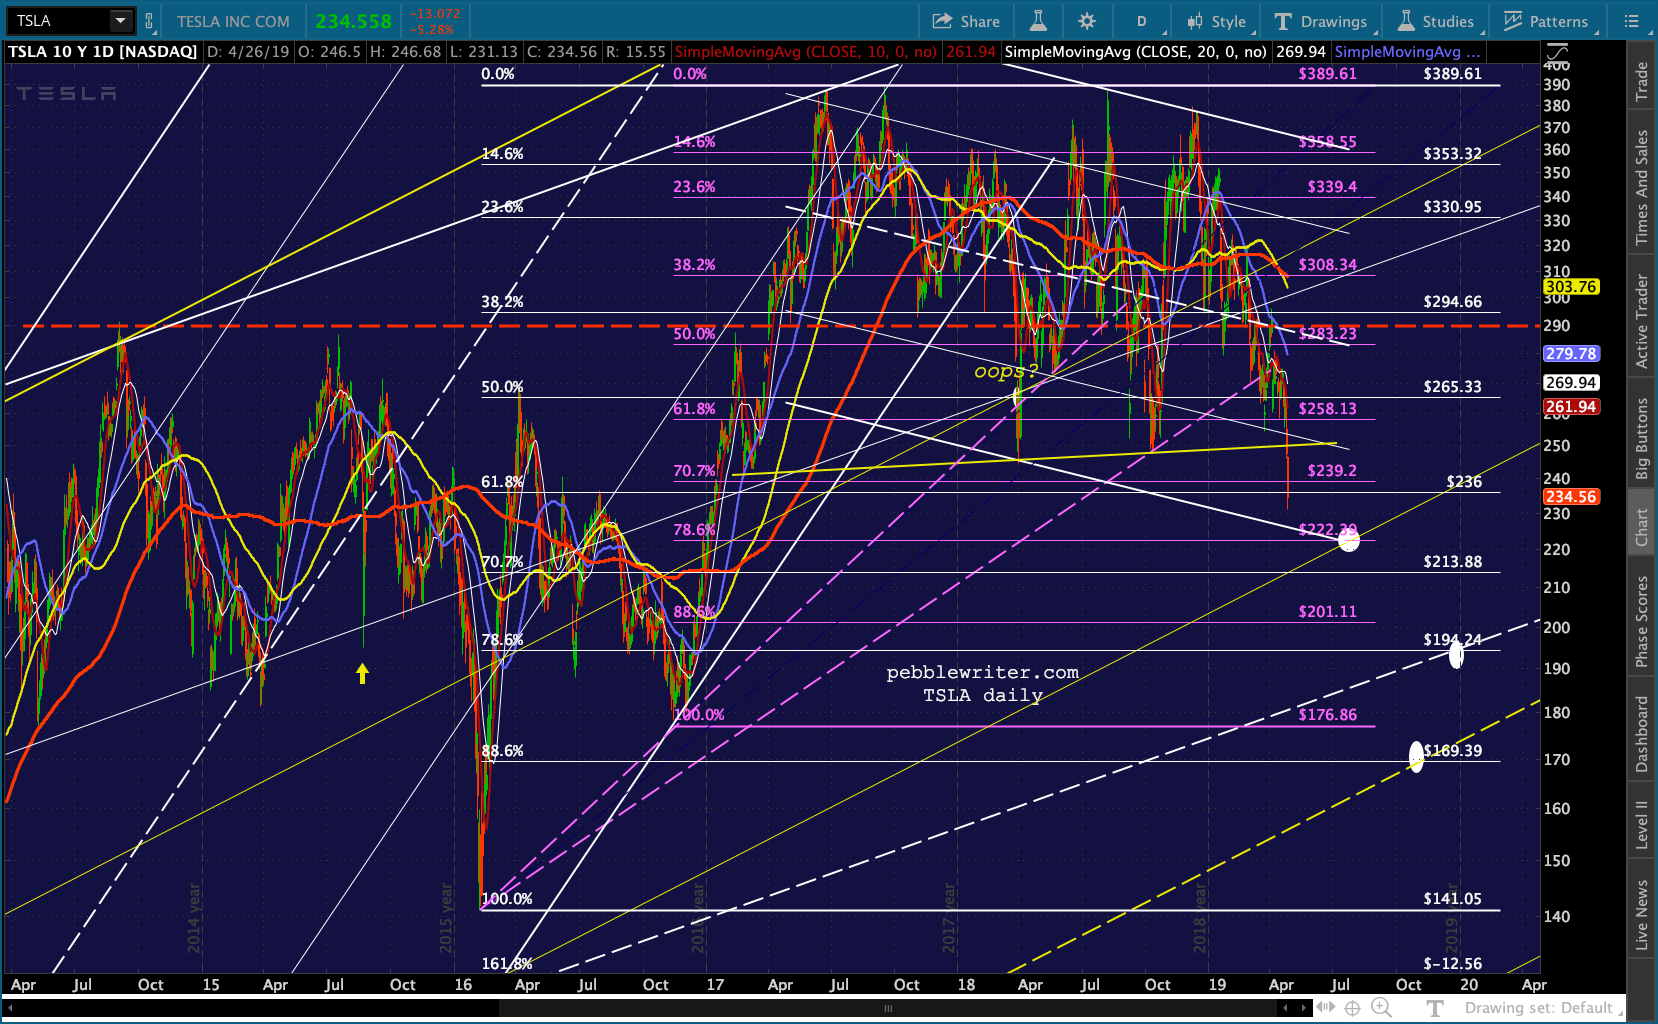 This leaves SPX and ES close to all-time highs, but no breakouts.
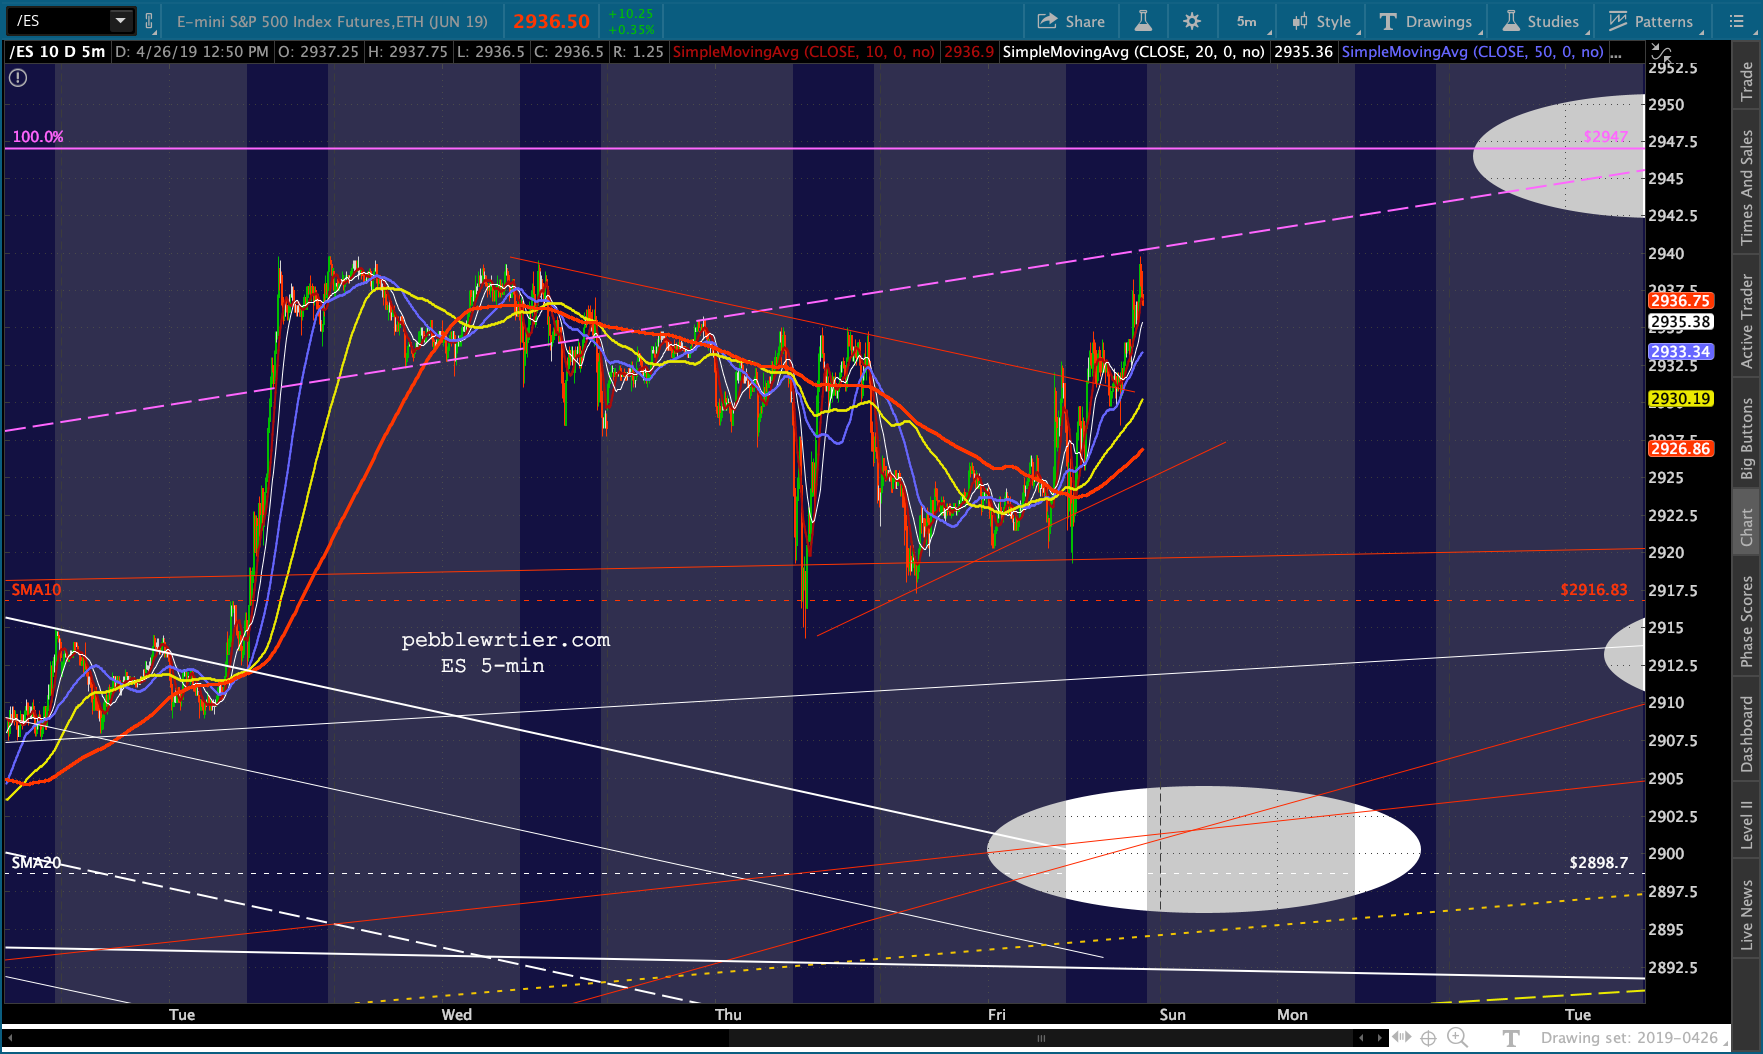
 UPDATE: 4:00 PM
Even though SPX’s final candle reads 2939.72 for its high, the final mark for SPX reads 2939.88 – only 1.03 below the all-time high.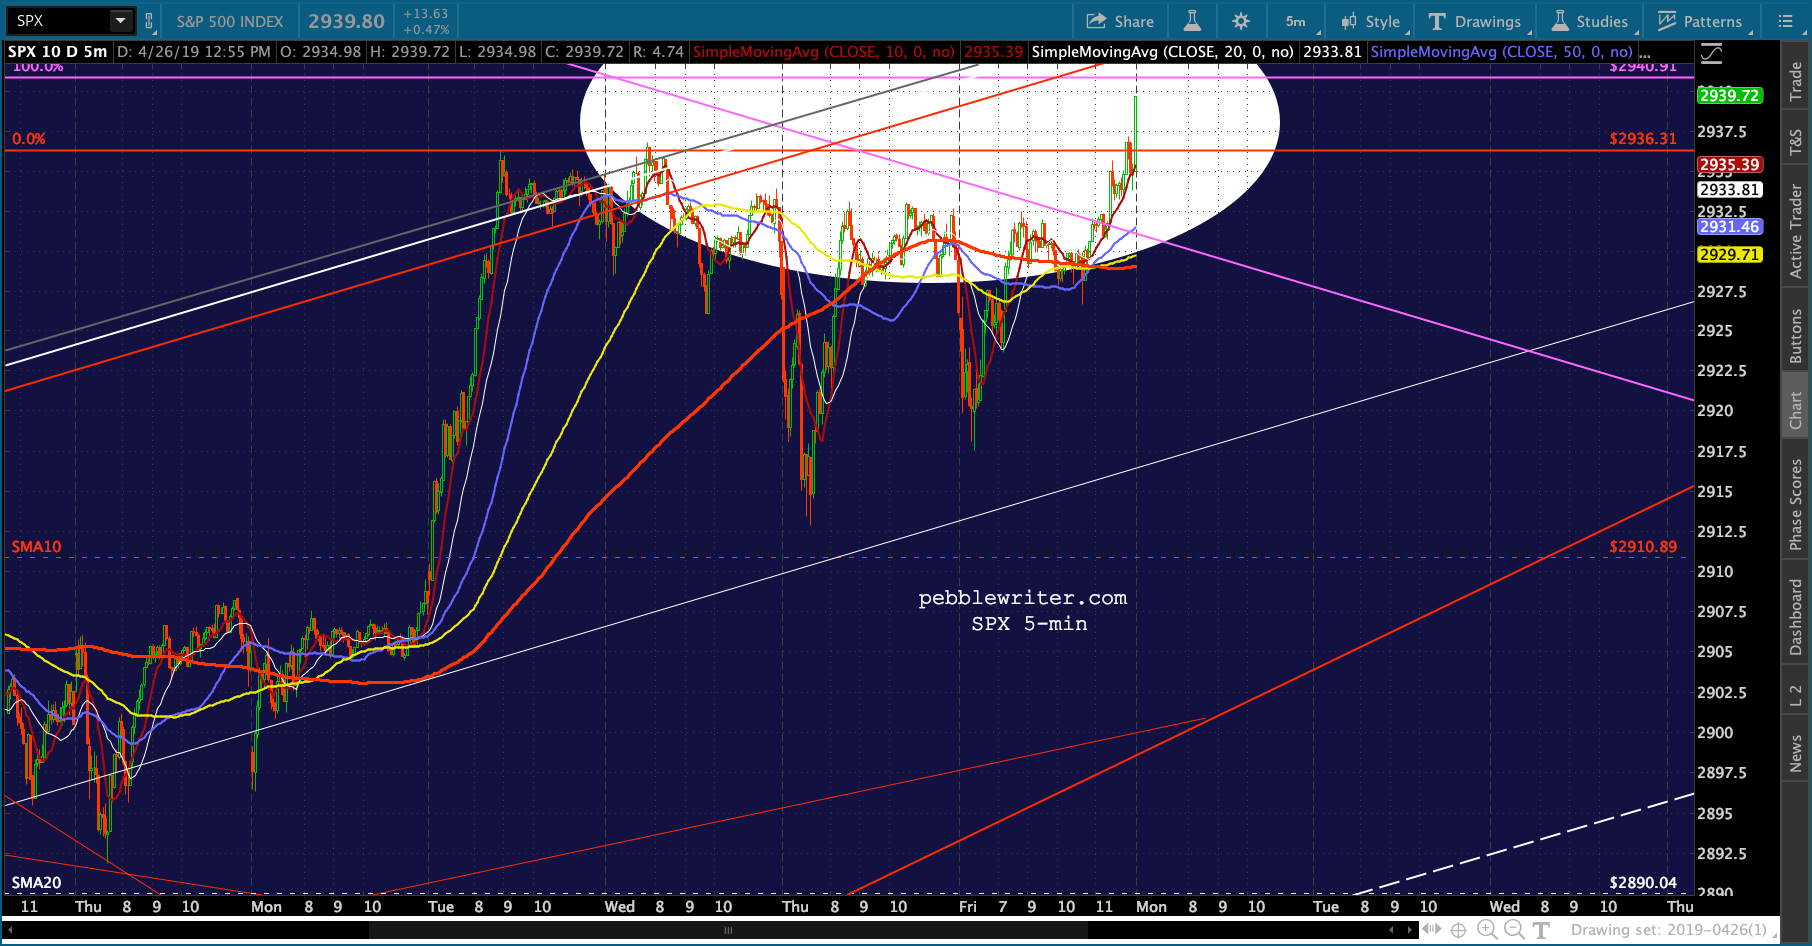 For those watching gold, note that it has bounced nicely off our last target — the SMA200 and a channel bottom if you draw the chart adjusting for contract changes.
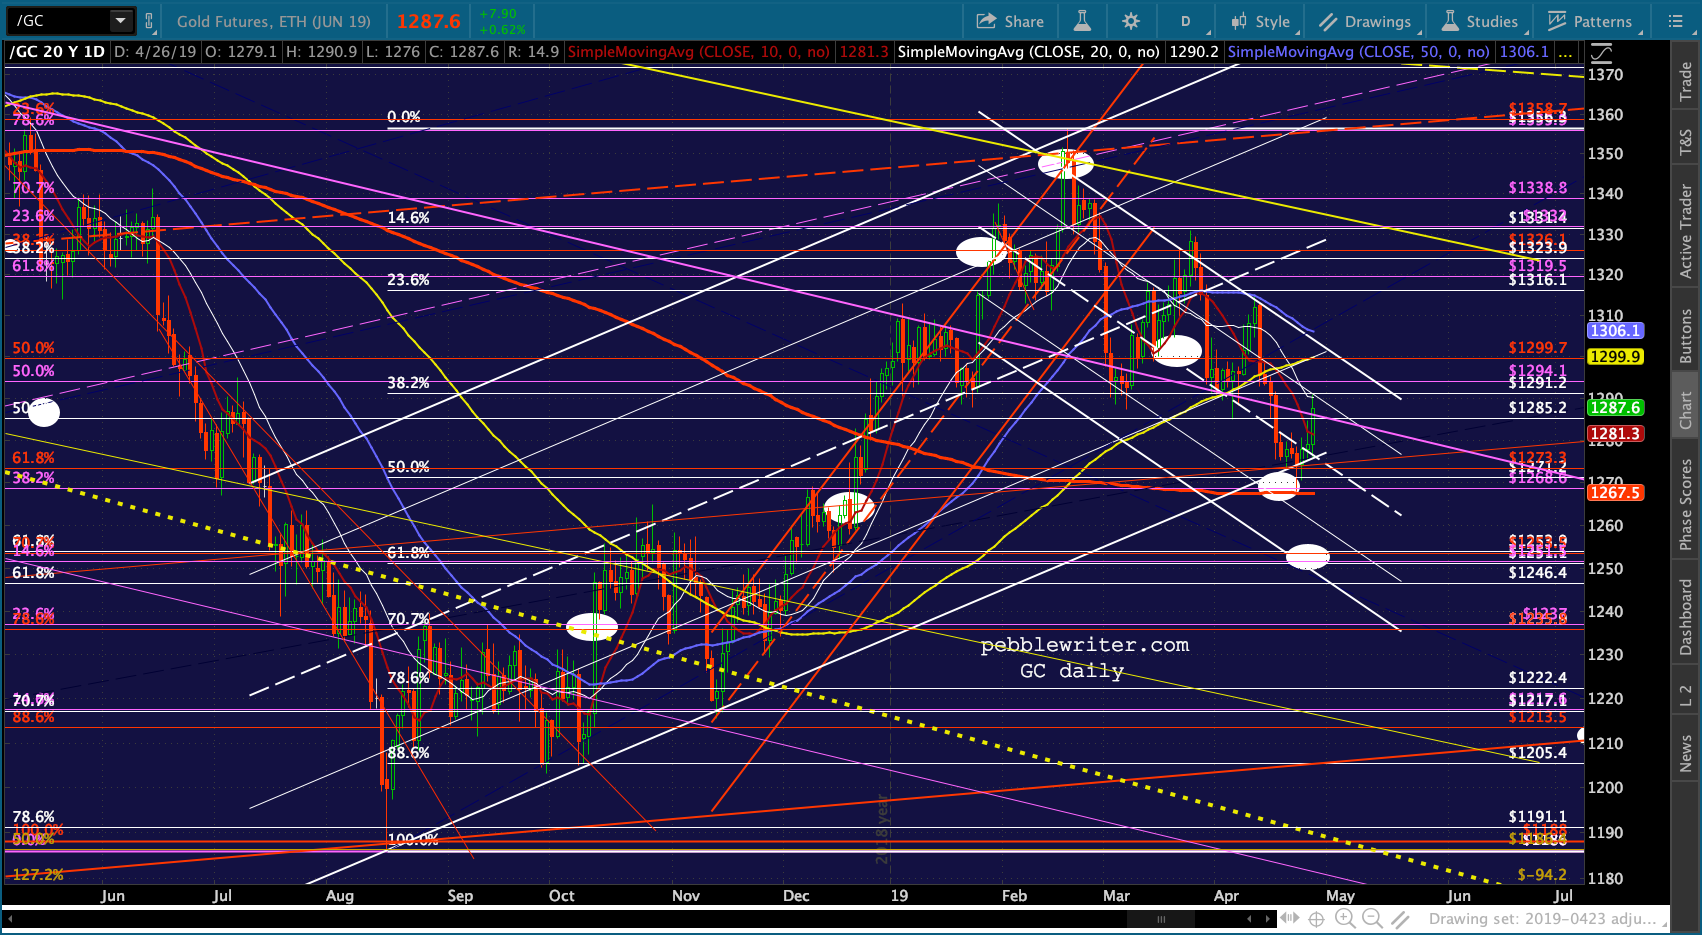 If you don’t adjust for contract changes, you end up with the same target prices but very different price levels on previous highs and lows, which wreaks havoc with Fibs, channels, TLs, etc.
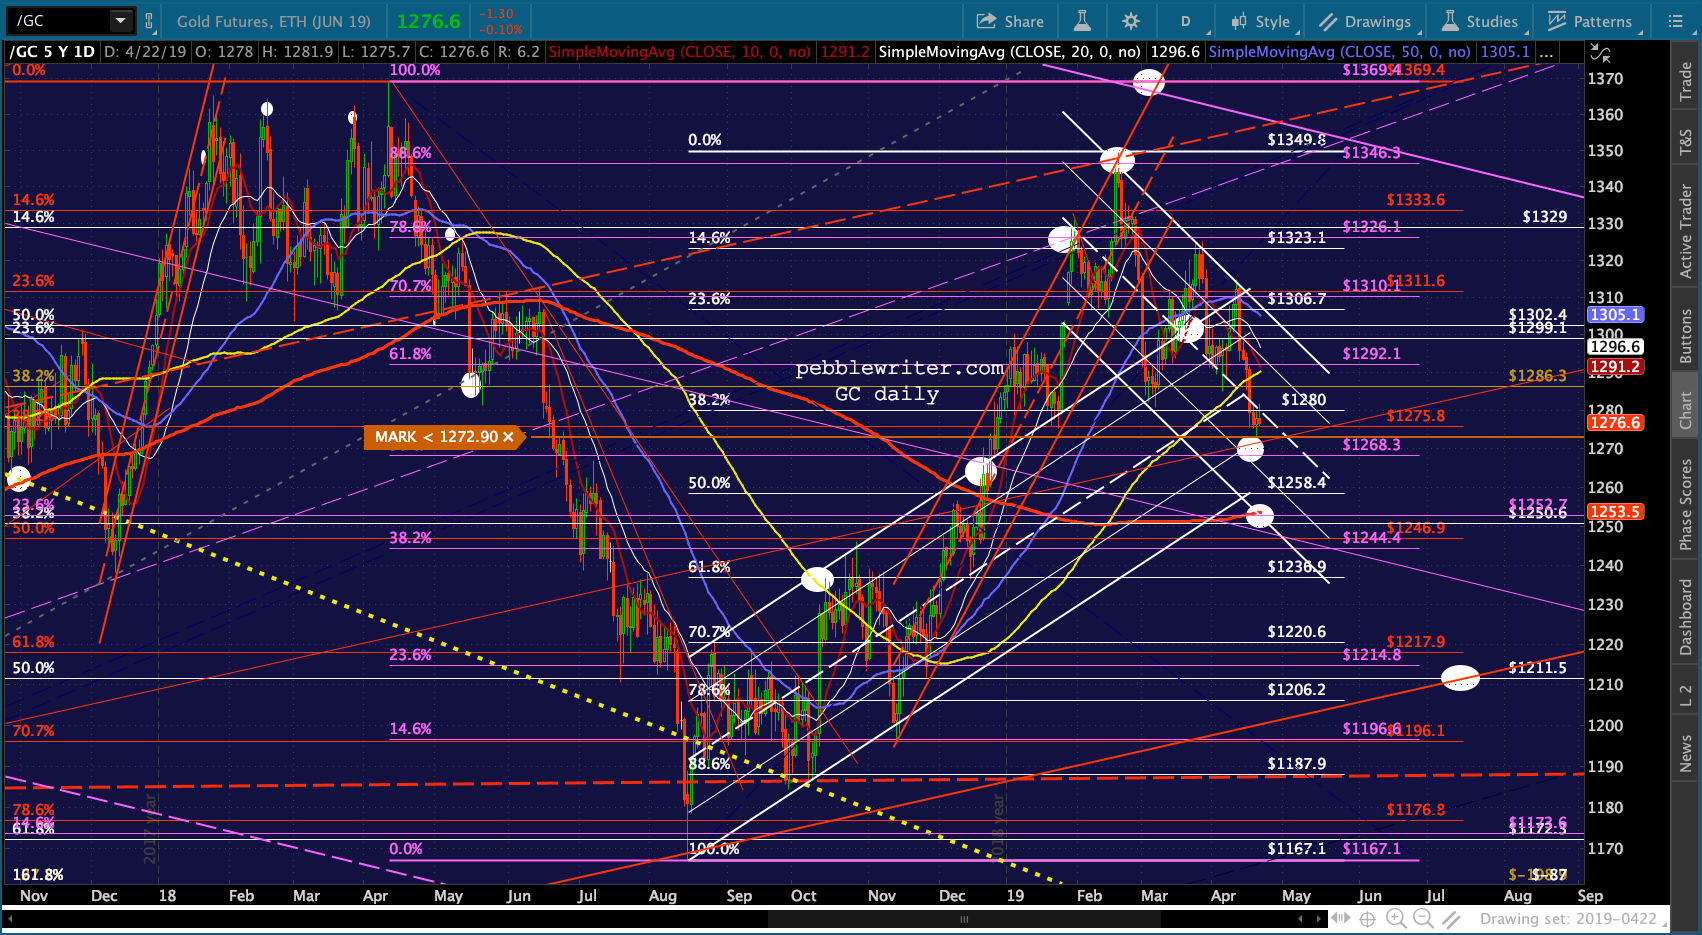 There is no right or wrong way to do this. In charting, you’re trying to figure out what other traders are observing and will do as a result of those observations. So, the safe technique is to chart it both ways and try to anticipate what others might decide based on their point of view.
This also applies to the decision whether to chart on logarithmic or arithmetic scale. It pays to do it both ways as you often get very different results when dealing with larger price moves and longer time periods.