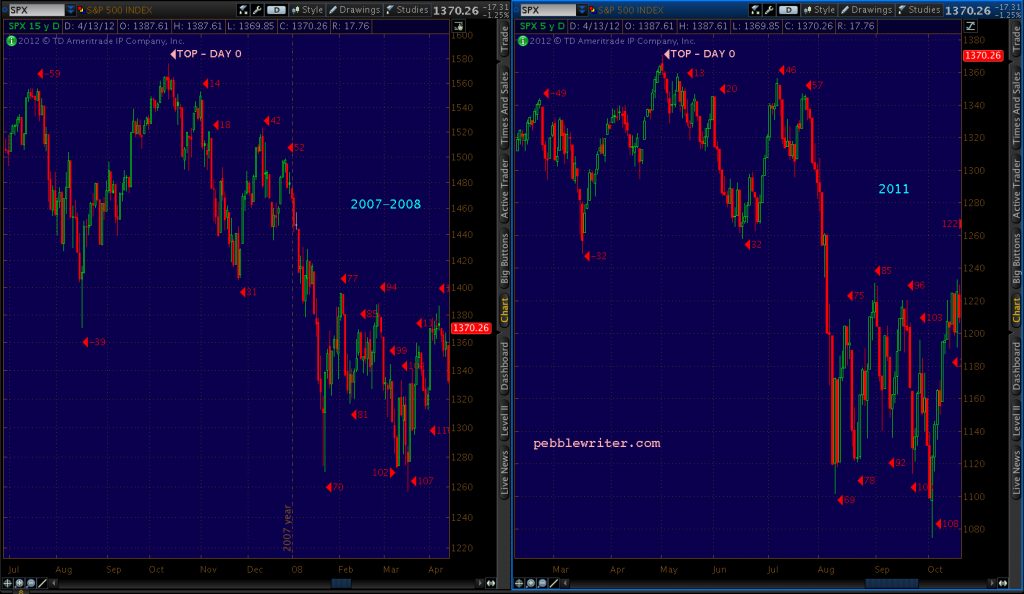

Poor Anthropic. They planned an IPO at the time of year when the market is practically guaranteed to be on the rise, and in the midst of a generational rally in everything AI related. The NVDA fiasco has certainly flipped the script.
The reality is that while the market was making new all-time highs every other day, it was diverging from the real economy in an almost imperceptible way. Economic data, like market data, is a composite of results. It’s generally presented as an average or mean. So if half the population is filthy rich and the other half is barely scraping by, the data might suggest the the economy is doing just fine. This is the data that makes the headlines.
But, every once in a while, the divergence between the haves and have nots reaches the point where it’s obvious the data doesn’t fully reflect the reality. We’ve adopted a term for it: a K-shaped economy. It’s what we’re in right now. The divergence can be seen by the dashed red line on the chart below, and it’s higher than it’s ever been.
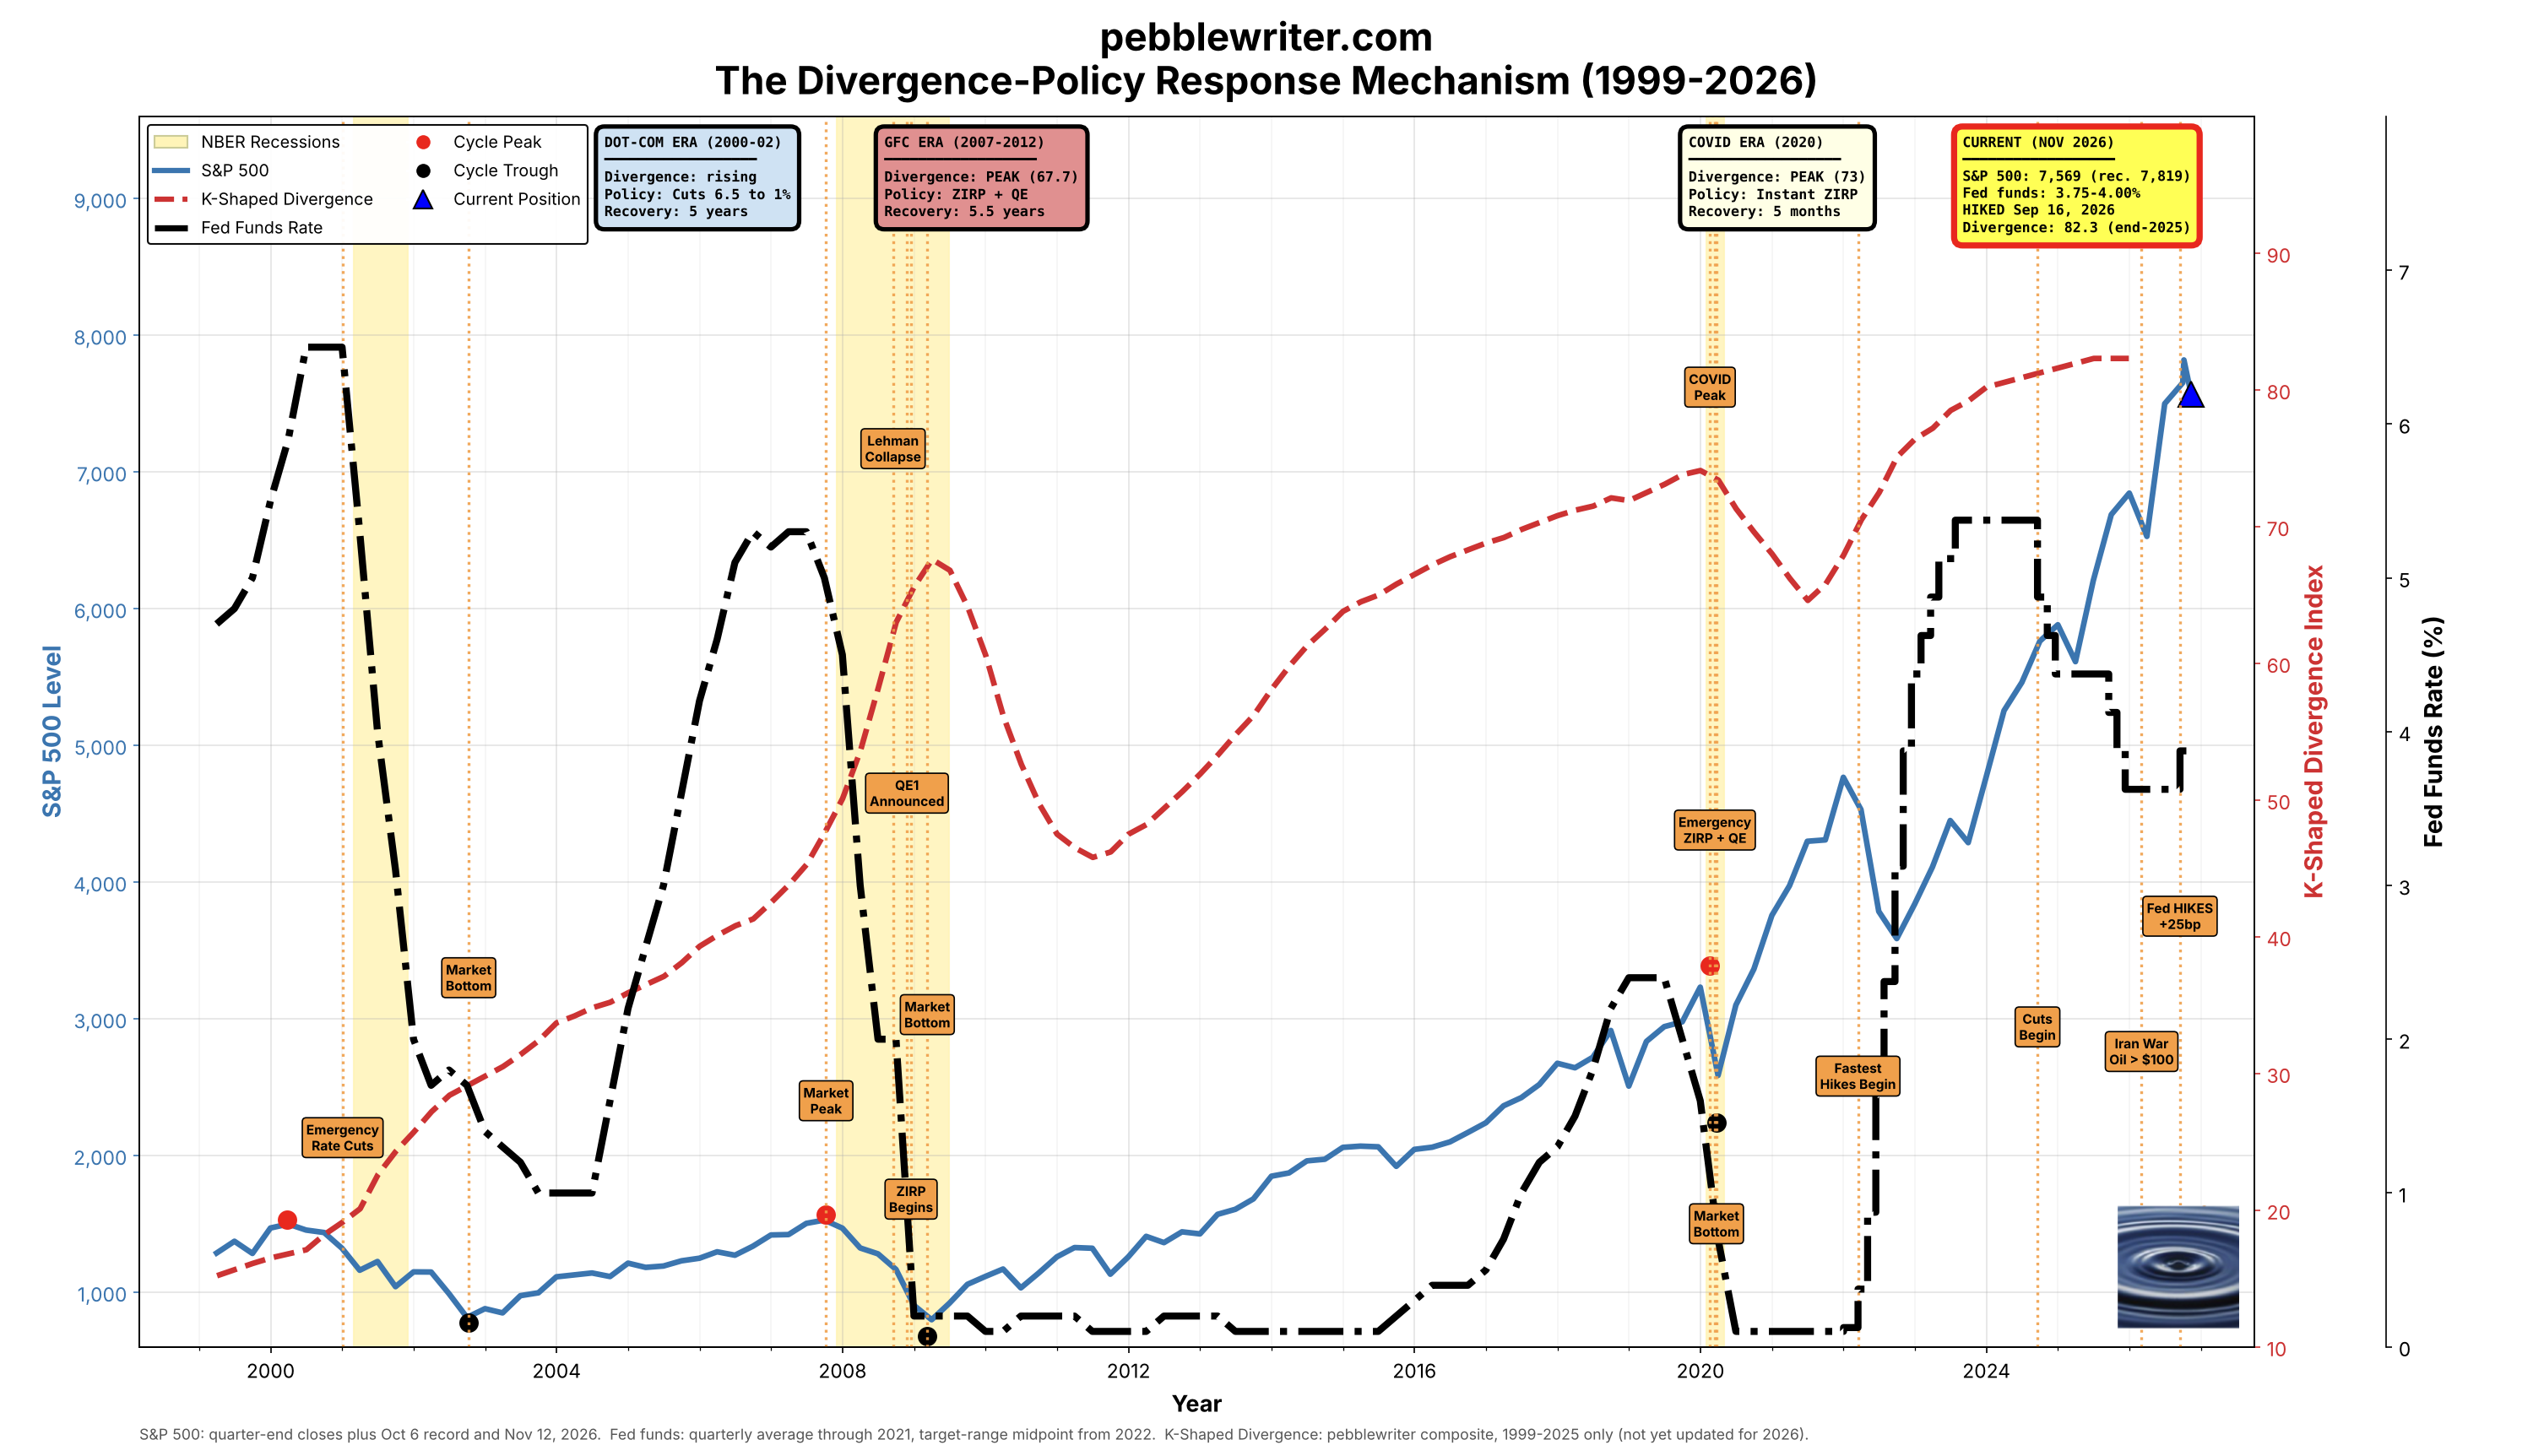
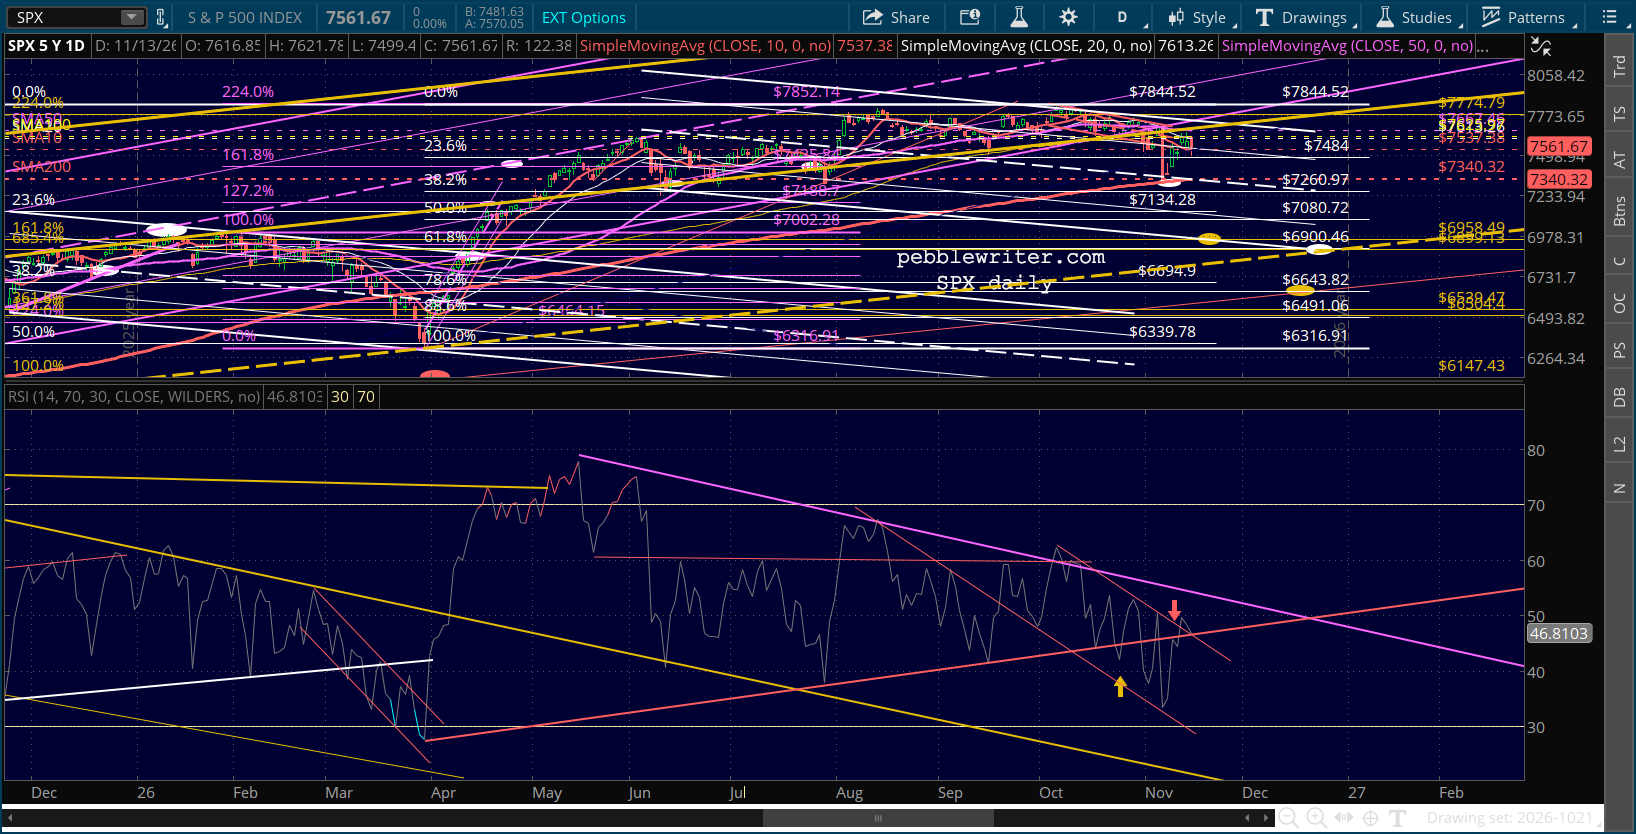
Many have noticed the similarities between 2000 and today.The fragility of the markets, at/near all-time highs and marked by very narrow leadership, is hard to miss.
- At the 2000 peak, the value of the top 10 stocks made up 27% of SPX. Today, it’s 43%, and the bottom 250 stocks have collapsed to only 7%.
- Back then, the top 10% of households held 82% of equities and mutual funds. Today, it’s over 88%.
- The 3.7% inflation in Aug 2000 was the highest in nearly 10 years when CPI was 6.4%.
So far the broader indices aren’t that much lower, though the tech sector is getting killed. If the previous highs don’t hold, it’ll have plenty of company. We’ve seen this movie before.
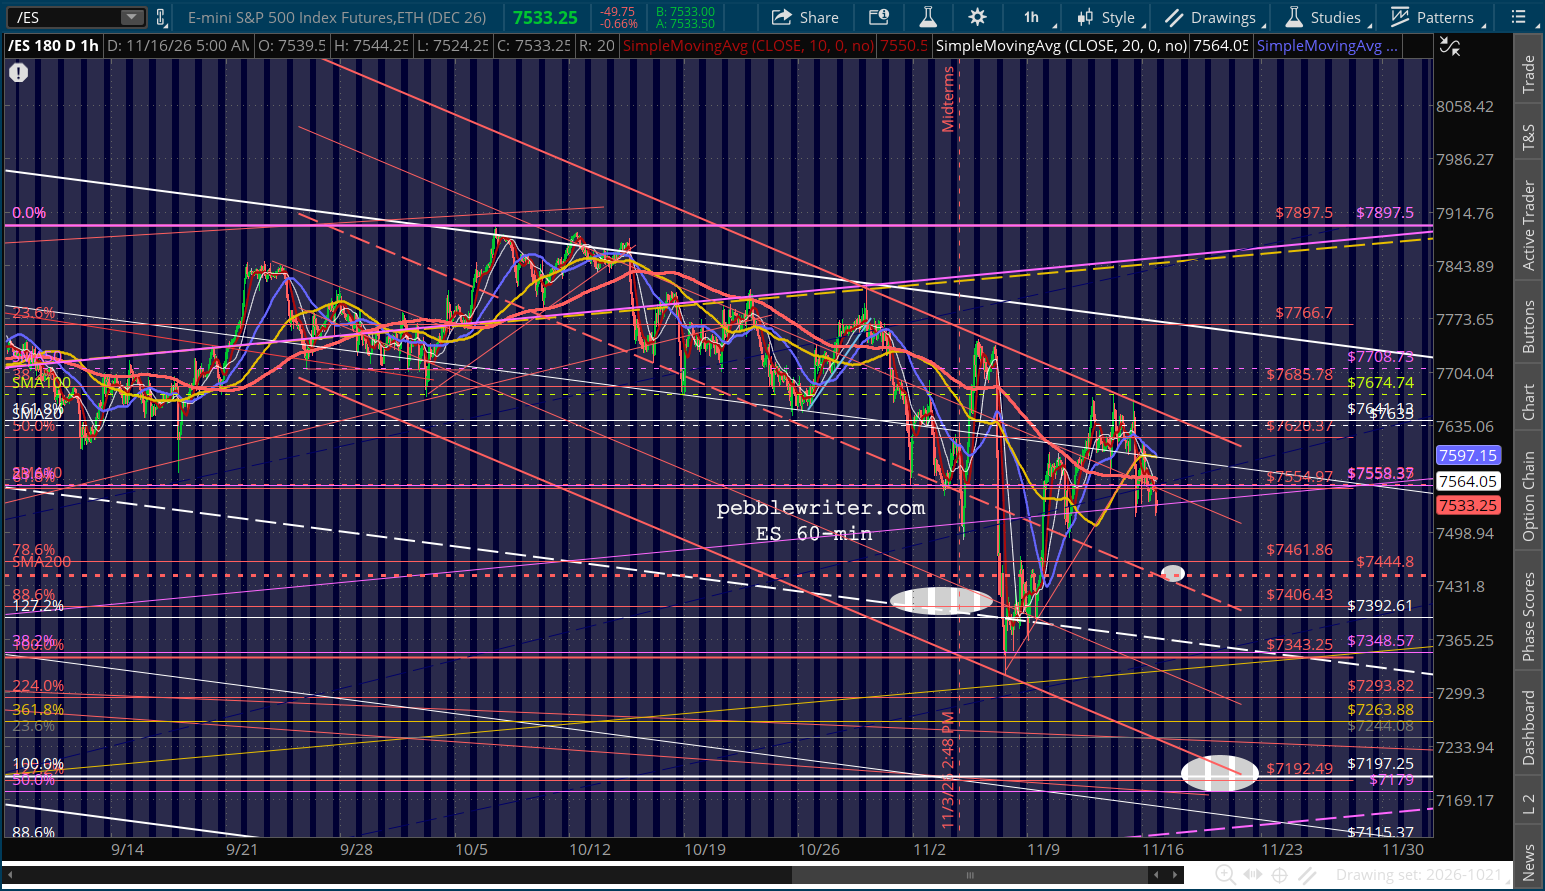
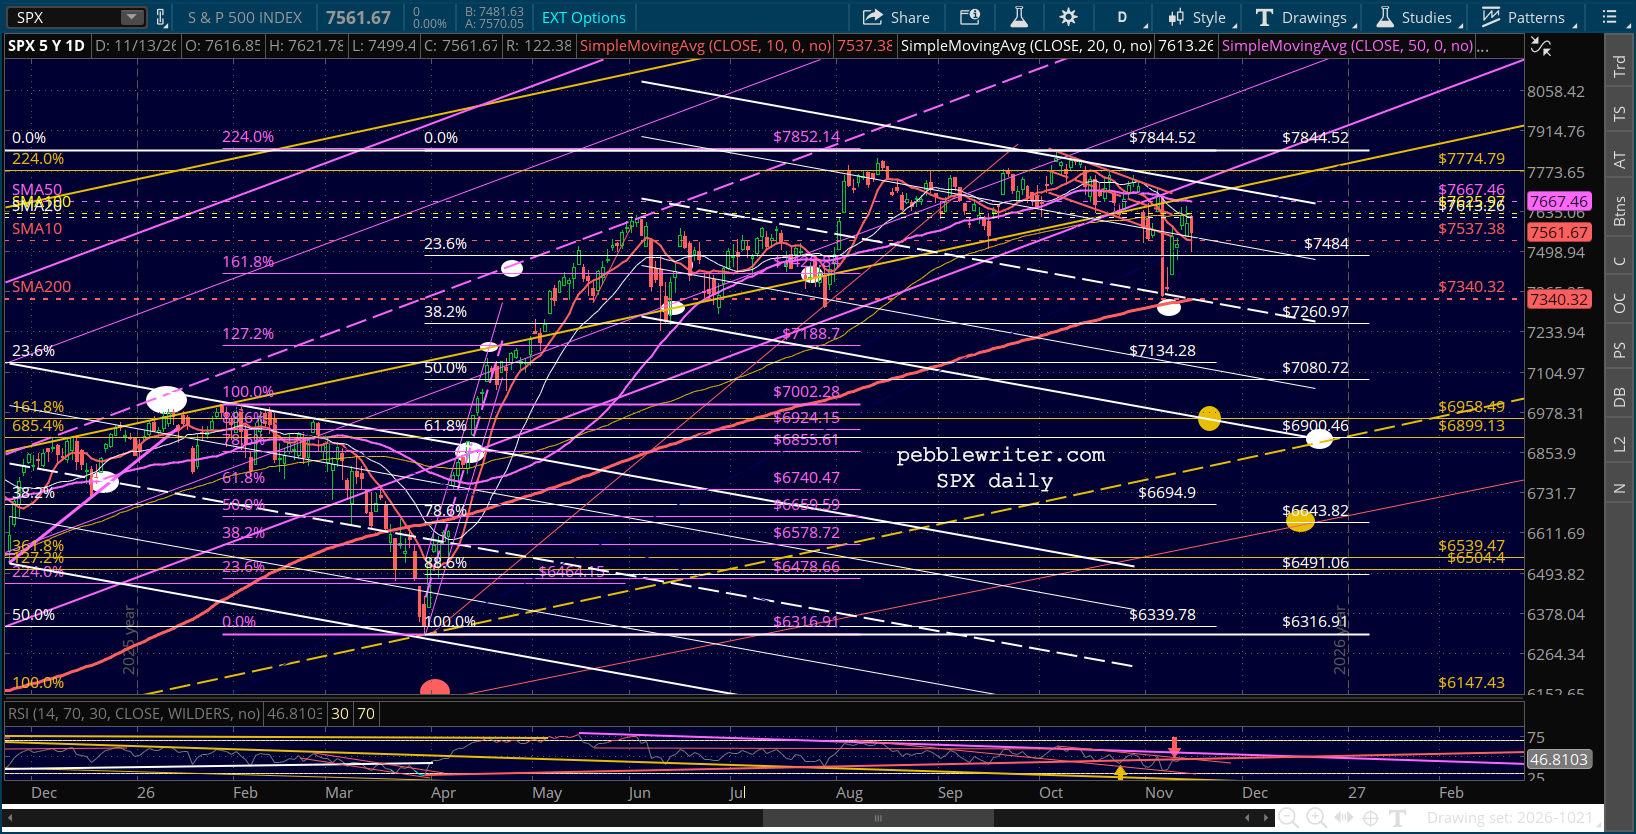
continued for members…
Leave a Reply
You must be logged in to post a comment.