If the past couple of days seem somewhat familiar, it’s because we saw a similar pattern in March. After backtesting the 2.24 Fib extension (2728.79) on March 8, ES rebounded sharply — closing barely in the red for the day and roaring 50 points higher the following day. It didn’t stop until it had piled on 233 points — about 8.5%. Repeated bounces off a horizontal line of support can be great for stocks – indicating that it’s safe to buy. The only hitch is if the third bounce only extends as far as the initial one. In such a case, we have the potential for a Head & Shoulders Pattern — which is quite bearish.
We’ve seen it happen twice already: the neckline between Apr 3 and May 8 which targeted 2806 (ES reached 2799) and on a larger scale between Mar 12 and May 28 which targets 2638 (a 10.9% from the April highs.)
This one is a little suspect, however, as ES bounced back above the neckline (for now) at 2806. In so doing, it also broke out of the falling purple channel,
The bulls have the reins as long as they can keep ES above 2806 — broken above the neckline and broken out of the falling purple channel. But, if it should fall back below 2806, then the H&S targeting 2638 will be back in business and we’ll set up a much bigger H&S (with the 2.24 Fib as the neckline) targeting 2495. This would be a 15.7% drop from the all-time highs.
Bottom line — if this break out turns out to be a head fake, watch out below.
continued for members…
The big picture:
 VIX is tucked in below its SMA200 for the moment — but, will it stay?
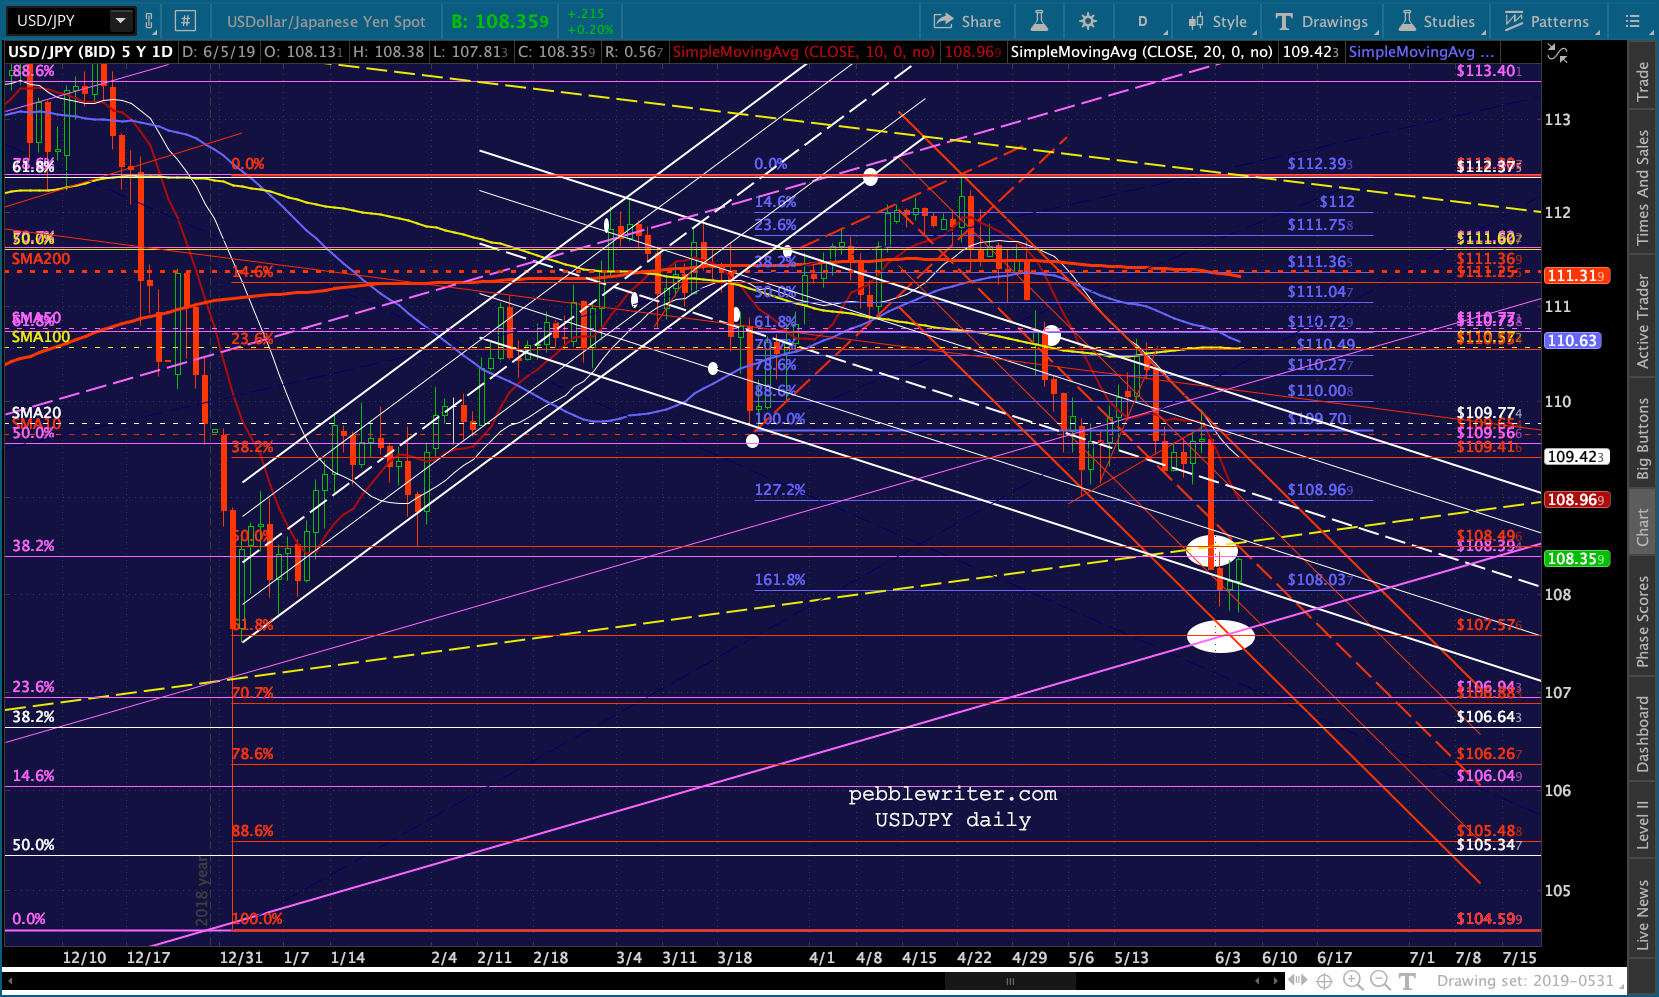
 USDJPY could drop any time now…
 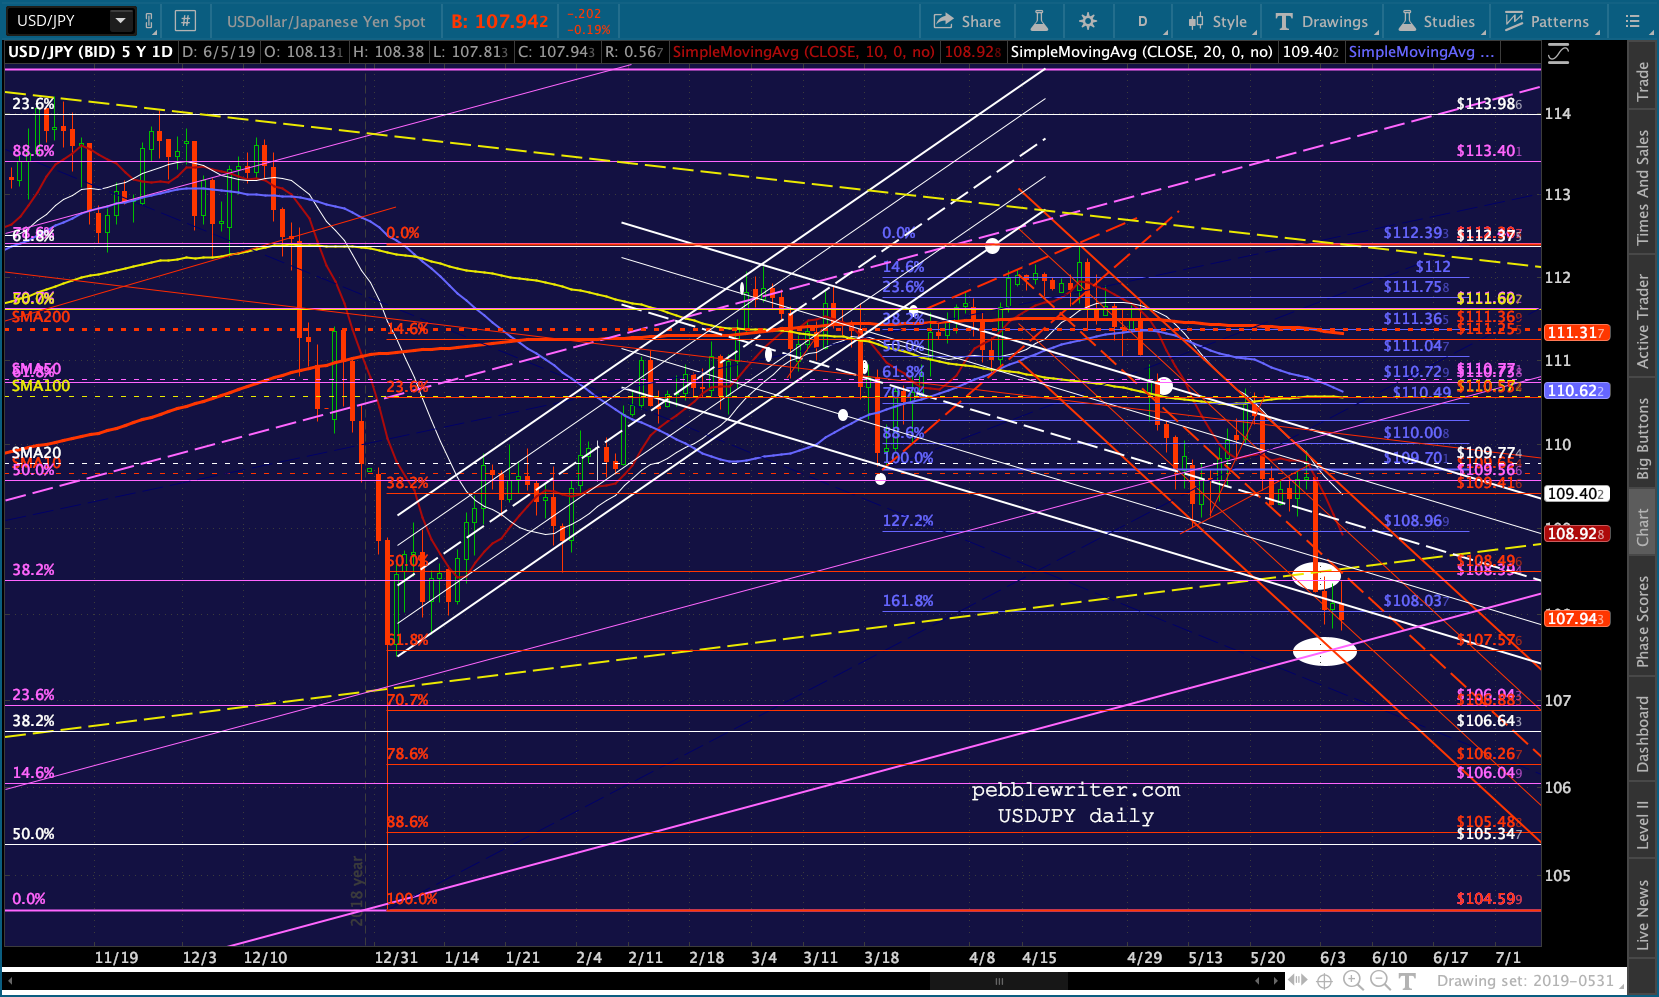 Same with CL…
 It’s worth mentioning that we’re seeing another potential repeat — the channel breakout on May 10. At the time, ES was closely adhering to the falling white channel. It broke out of the channel and poked above the neckline of the completed H&S pattern — about 14 points or so. It’s marked with a yellow arrow in the chart below.
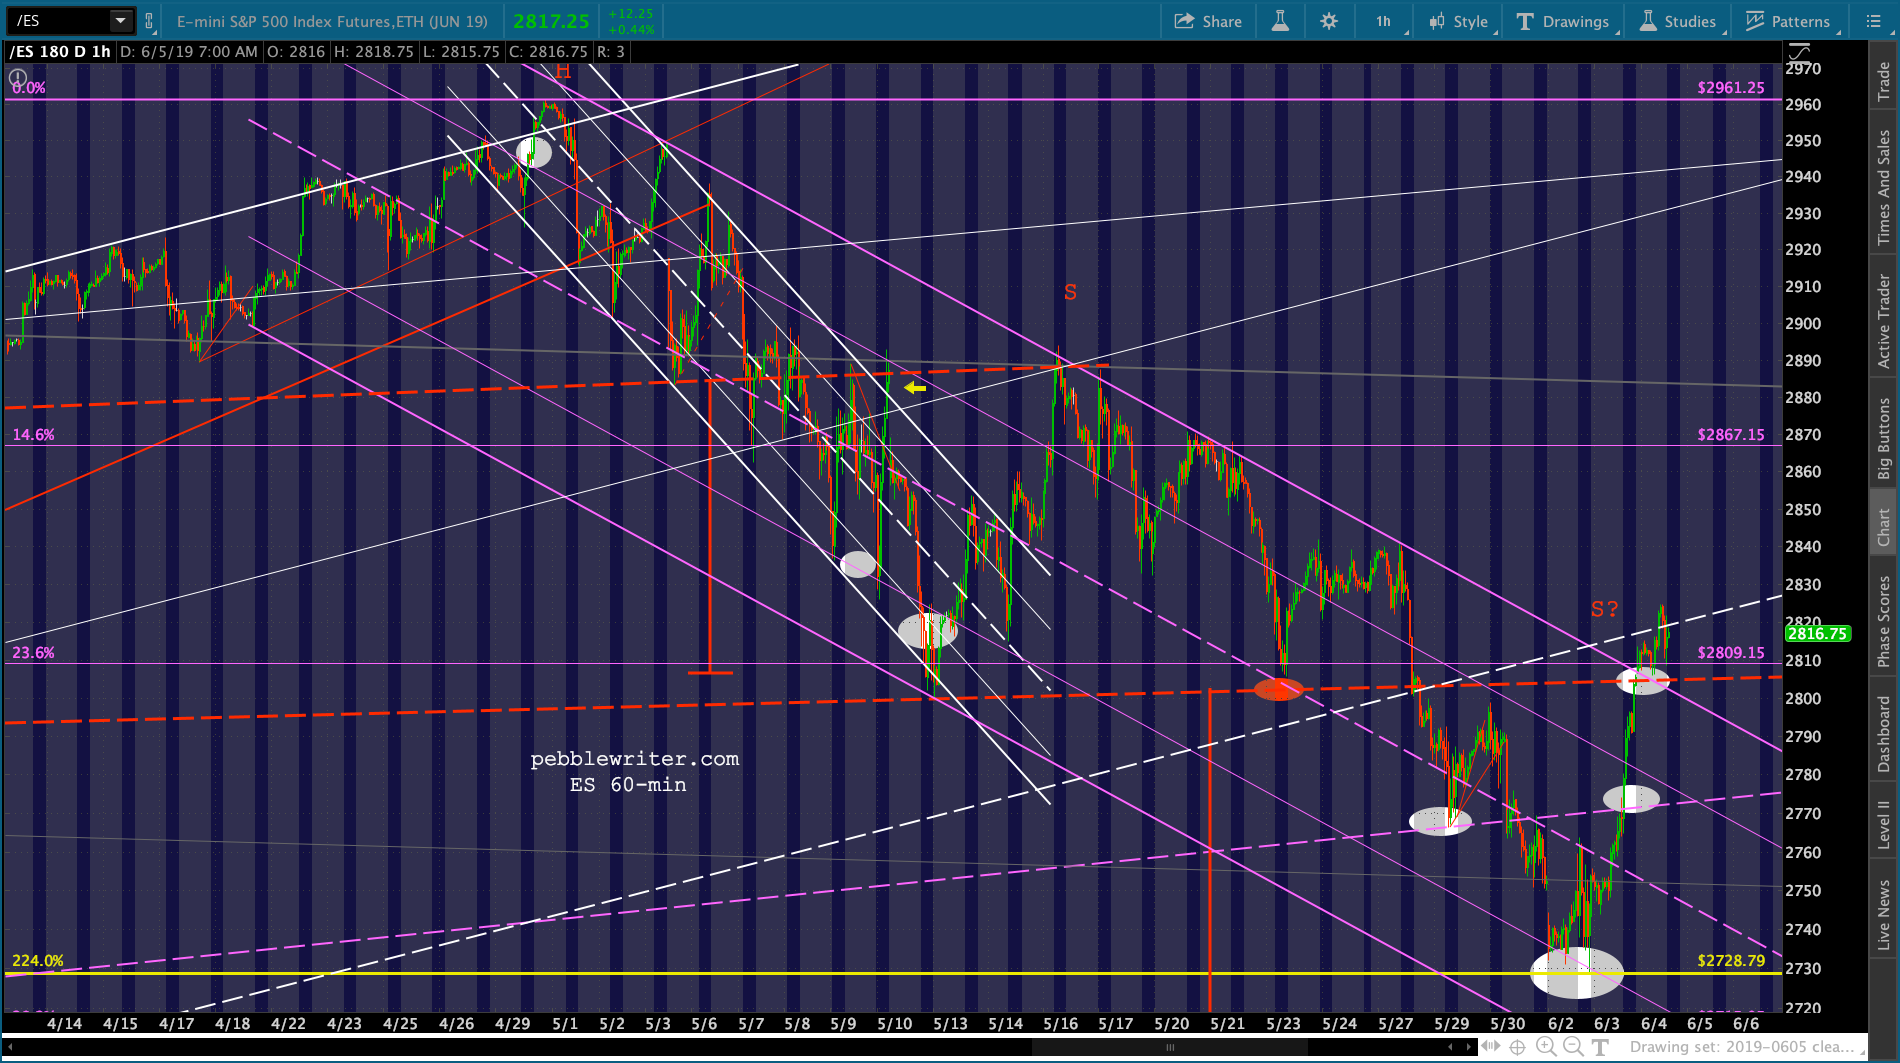 By the close the following day, it had plunged 94 points (about 3.25%) from the previous session’s highs. What made it worse is this happened over a weekend. Those who justifiably went long with the breakout on Friday got slammed.
UPDATE: 1:30 PM
The SPX version of the same patterns. If the falling purple channel holds, SPX will shed 118 points between now and Monday. If the channel expands (doubles) we should tag the .618/1.618 combination at 2578.66 around Jun 17. If I’m right, this is a great shorting opportunity. If not, the next higher resistance is the white midline at 2845ish.


 Note that EURUSD finally tagged the top of the falling purple channel — something that has been postponed since Oct 2018 when it could have tagged both the channel top and SMA200 at the same time.
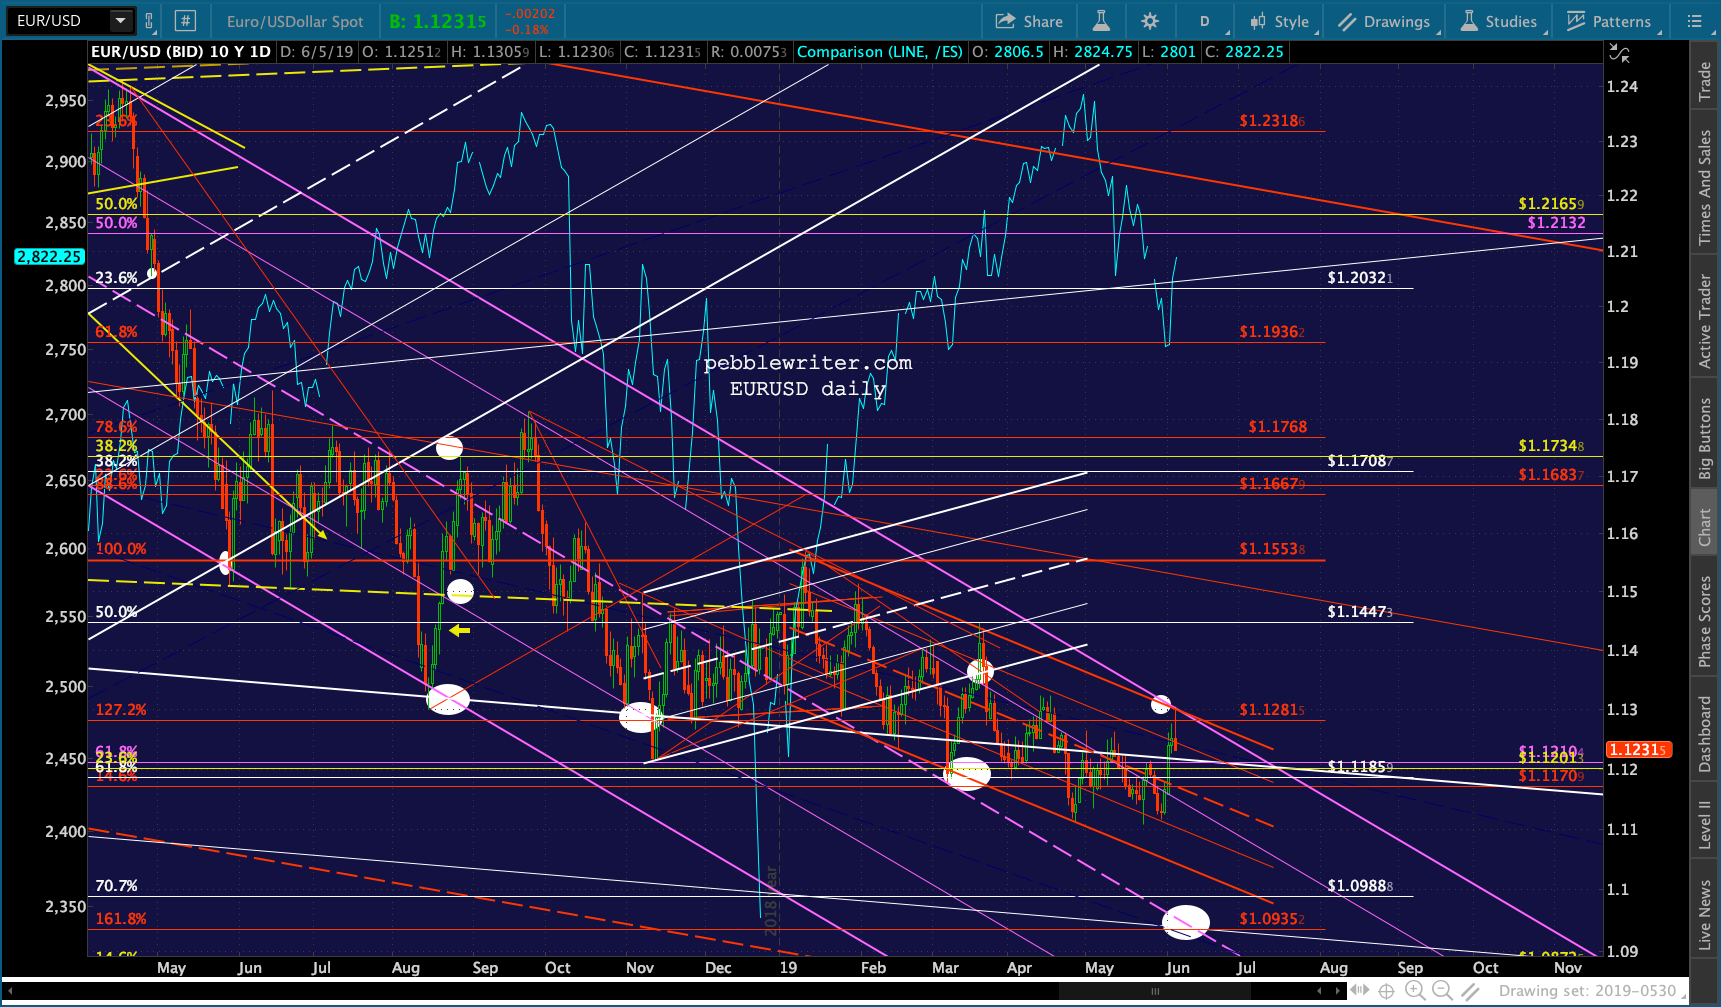 If it falls, that means dollar strengthening which would push the DXY higher. I don’t think it’ll happen until DXY at least tags its white channel bottom – ideally at the SMA200, currently 96.452.
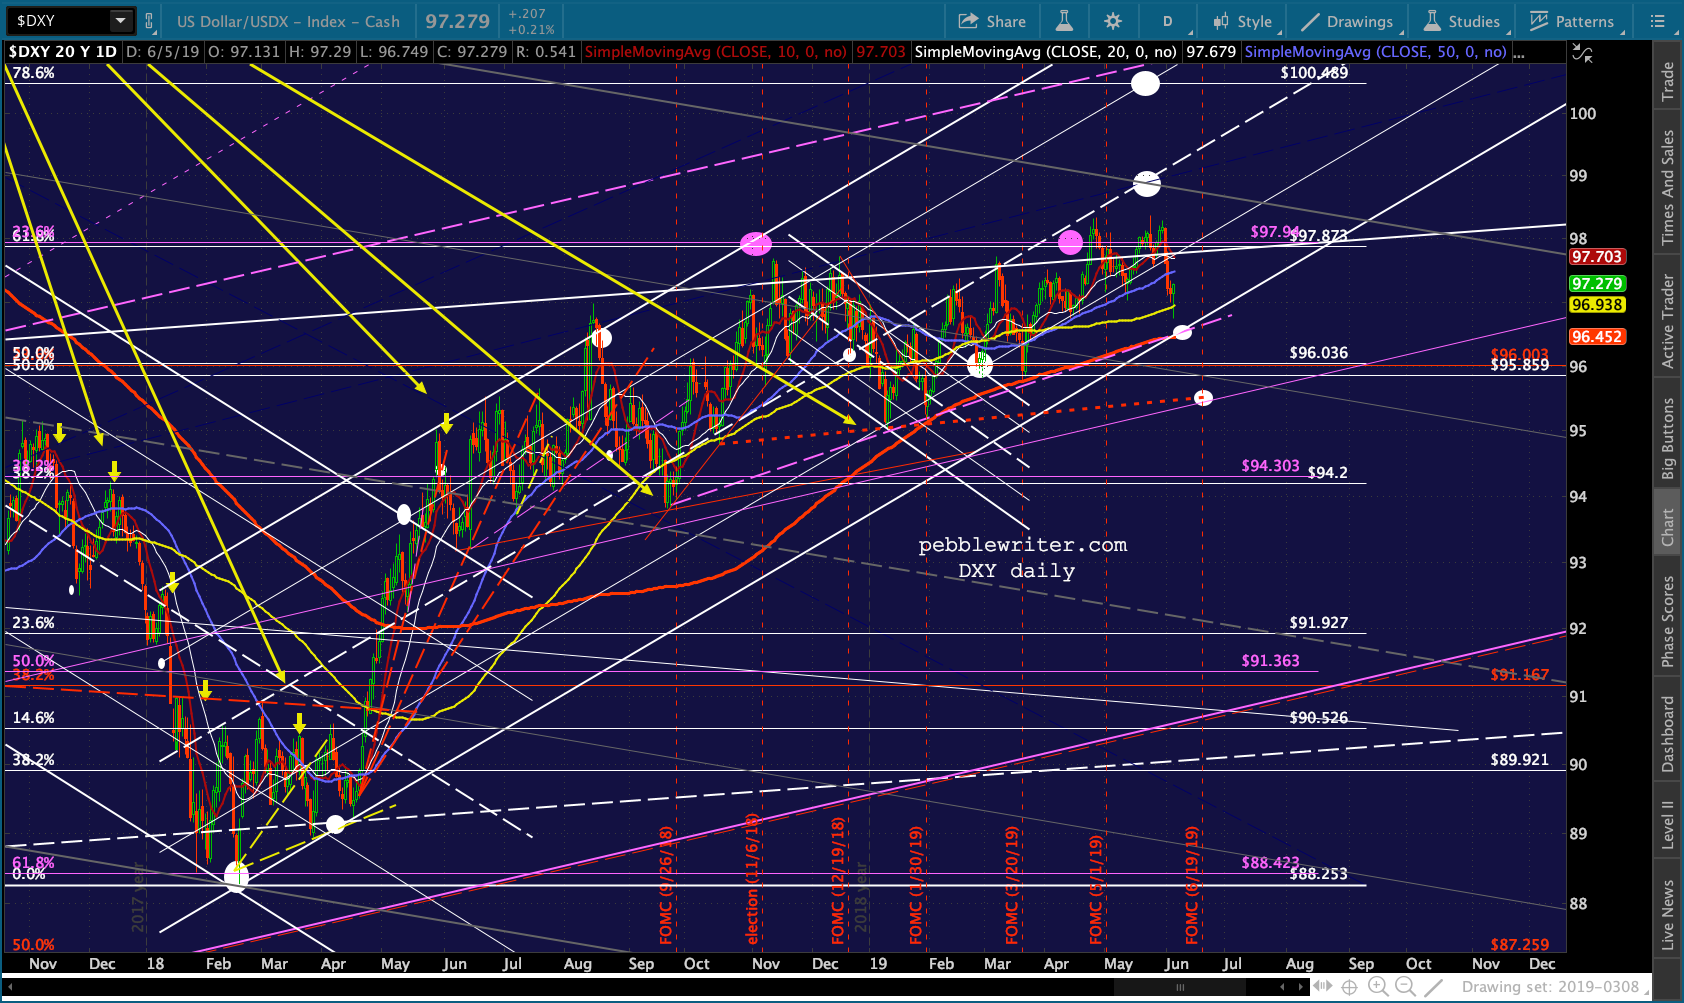
If TPTB wish to keep DXY from breaking out, a strong move lower in EURUSD could be partially offset by a sharp drop in USDJPY. This would be bearish for stocks.