ES came within 4 points of its .618 retracement of the drop from the Jan 4, 2022 highs. SPX came within 12 points of its. From a harmonics standpoint, we’re at a critical potential turning point for equities.
 continued for members…
It’s easiest to see with a clean SPX chart. The IH&S Pattern which completed in mid-April but didn’t break out until mid-May argues for new all-time highs. But, the harmonics argue otherwise – suggesting at least a backtest of the SMA200.

 The ES version:

 And, VIX’s point of view:
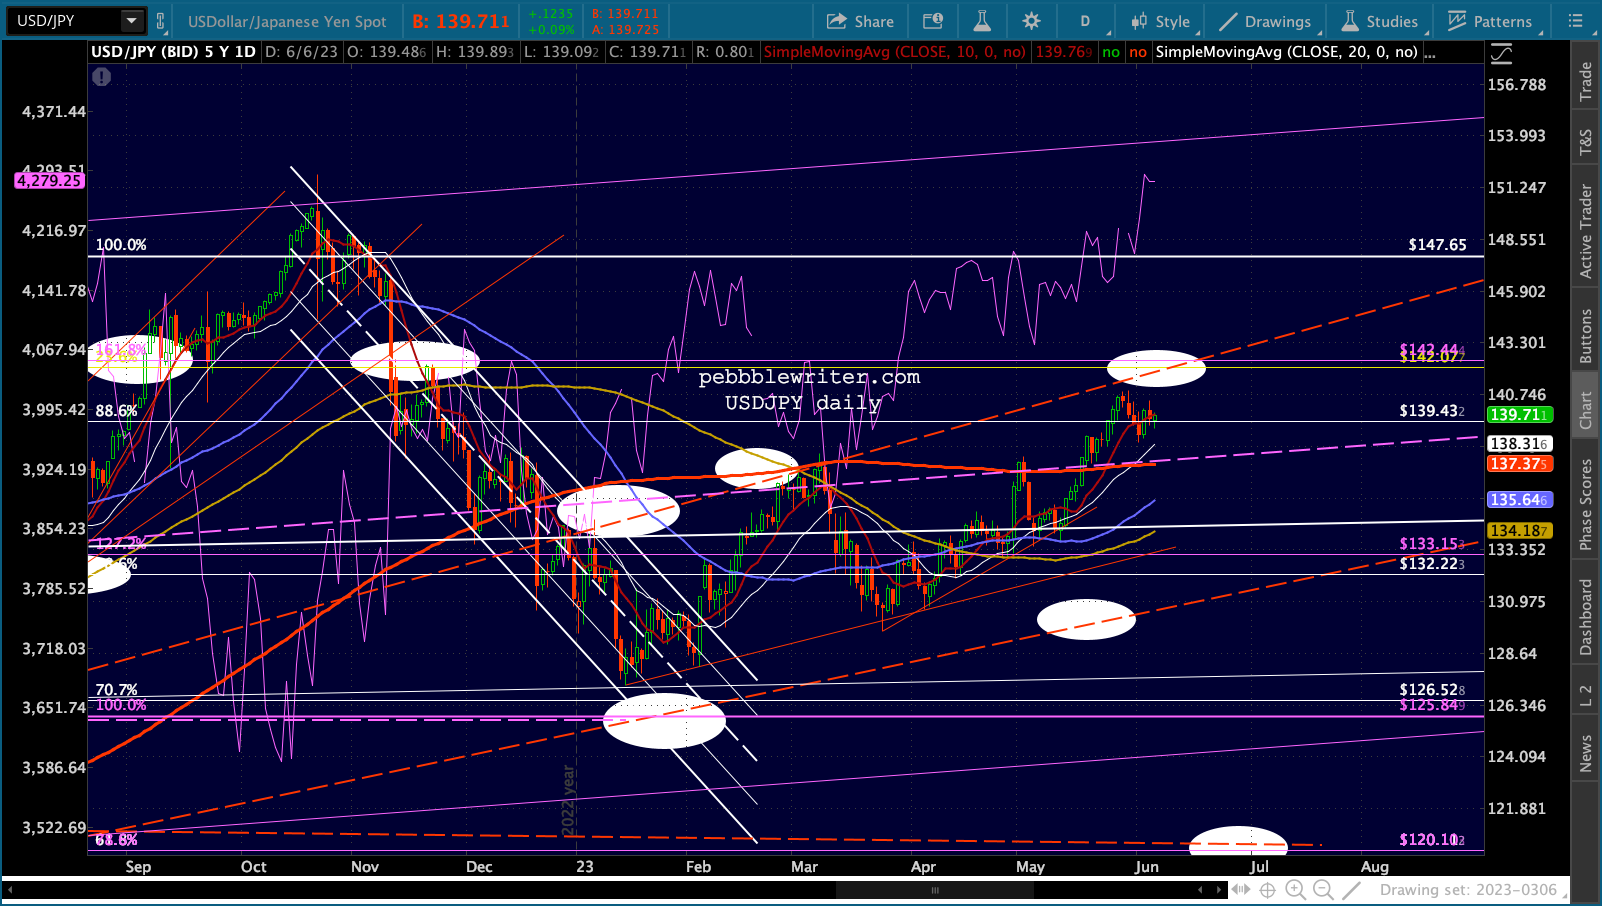
 EURUSD continues its gentle swoon toward SMA200 support, while USDJPY is trying to pull away from its. Together, they should permit DXY to reach its SMA200 in the next week or two (ideally around June 20-22.)

 BTC is finally breaking down as the Binance and Coinbase headlines are taking a toll.

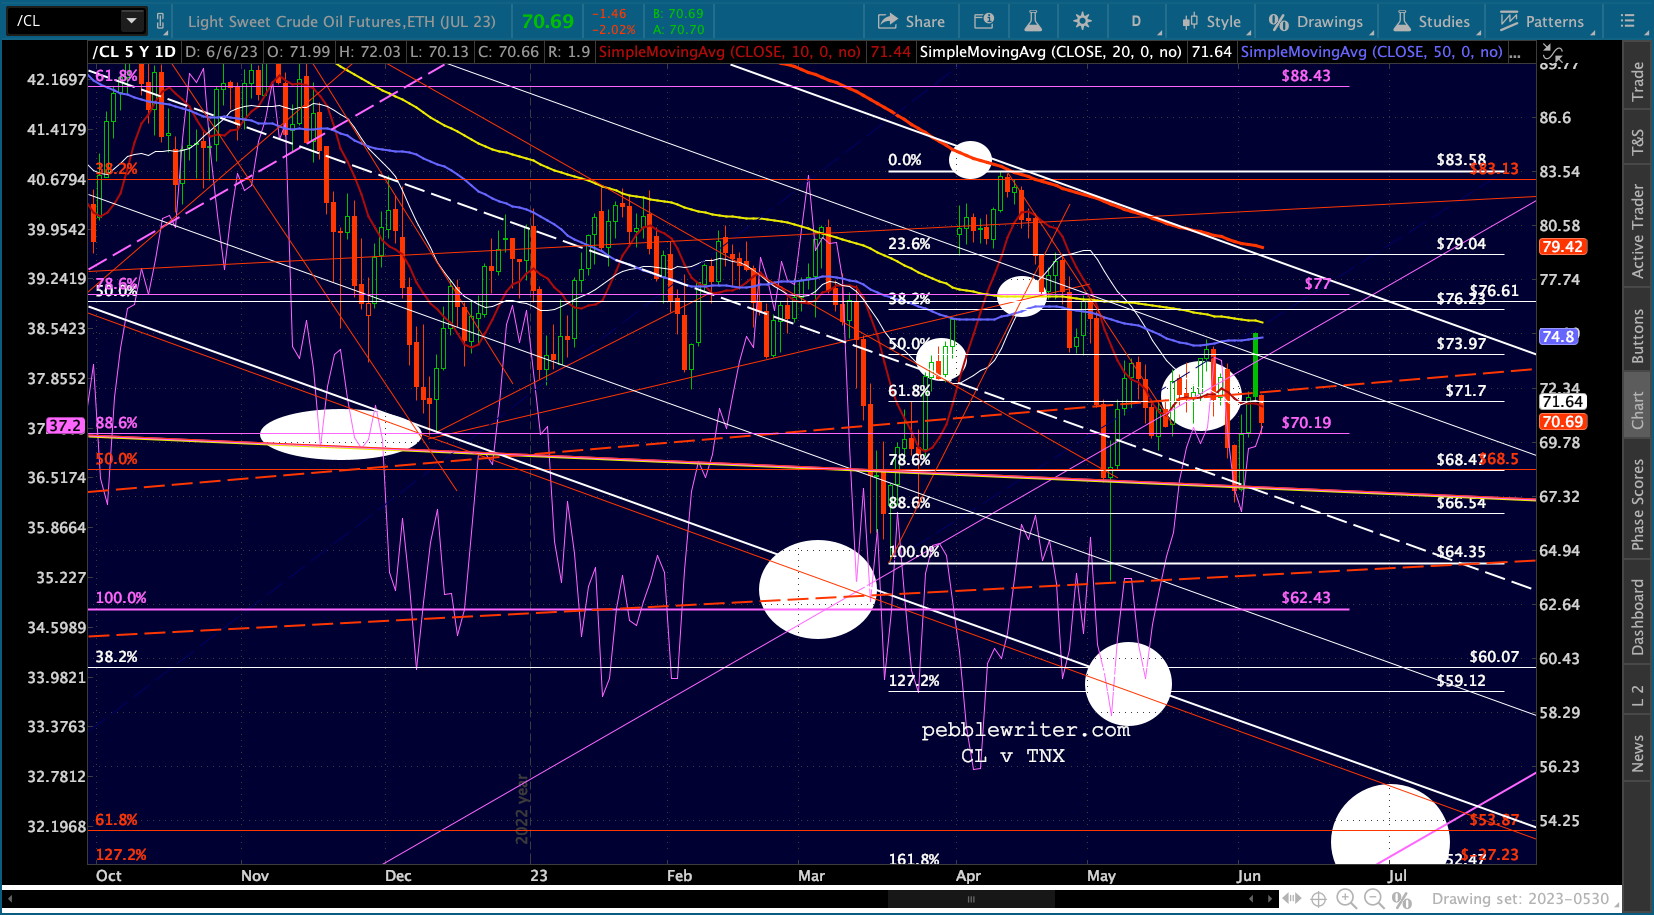
CL and RB are giving up yesterday’s gains, with RB struggling to hold its SMA200 and CL back below its SMA10.