

After bouncing off our initial downside target yesterday, stocks ramped nicely into the close and overnight. But, the overnight ramp job is fading fast, and it remains to be seen whether the backtest scheduled for the opening bell will hold.

The focus over the next couple of days is, of course, the Fed. There is strong consensus for a rate hike tomorrow. In addition, the market faces the headwinds of the tariff war(s), growing turmoil in D.C., and the usual instability in the Middle East, etc.
Will investors press the pause button? It all depends on the comments offered by Powell et al. Some have argued that the Fed was hopelessly behind the curve — even before Trump’s tariff war amped up inflation.
continued for members…
Lots of downside targets, and the same old upside ones. ES’ channels make more sense at the moment, with a test of the SMA20 at 2904.41 looking good.

If VIX’s falling wedge expands into a channel, we’ll see the SMA100 tested at 13.23. If ES/SPX’s backtests are to develop into that 25-pt rout, then the SMA200 comes into view at 14.81.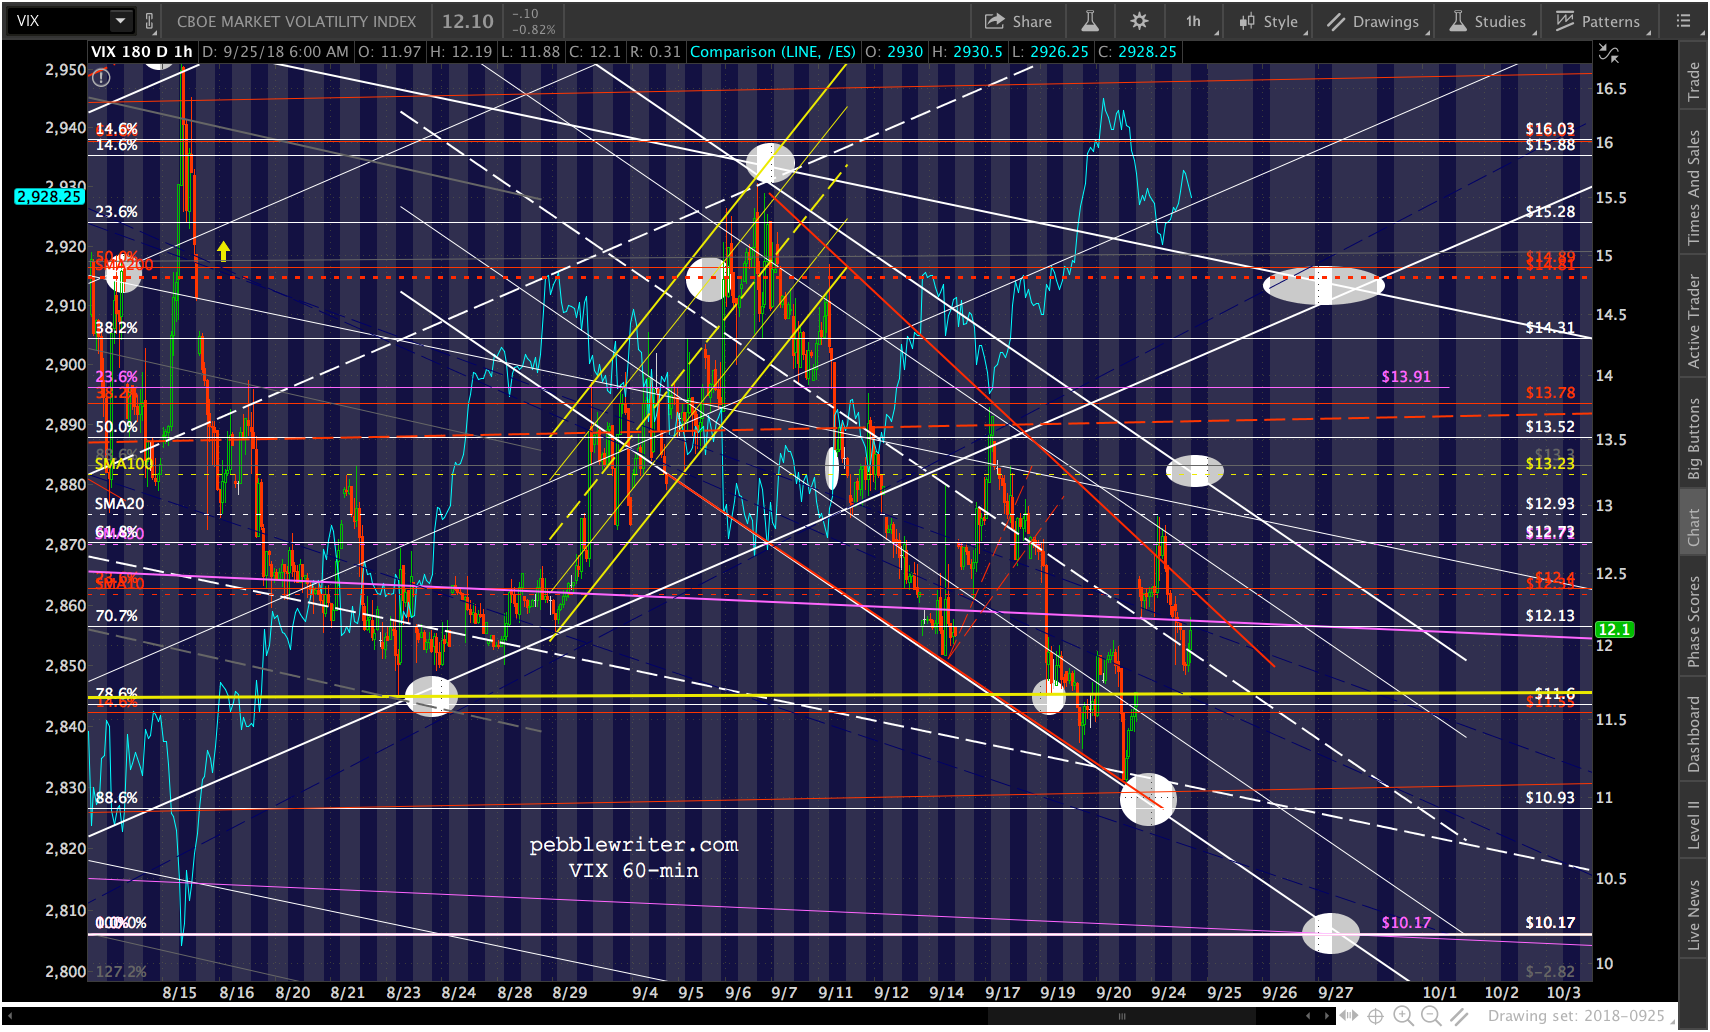
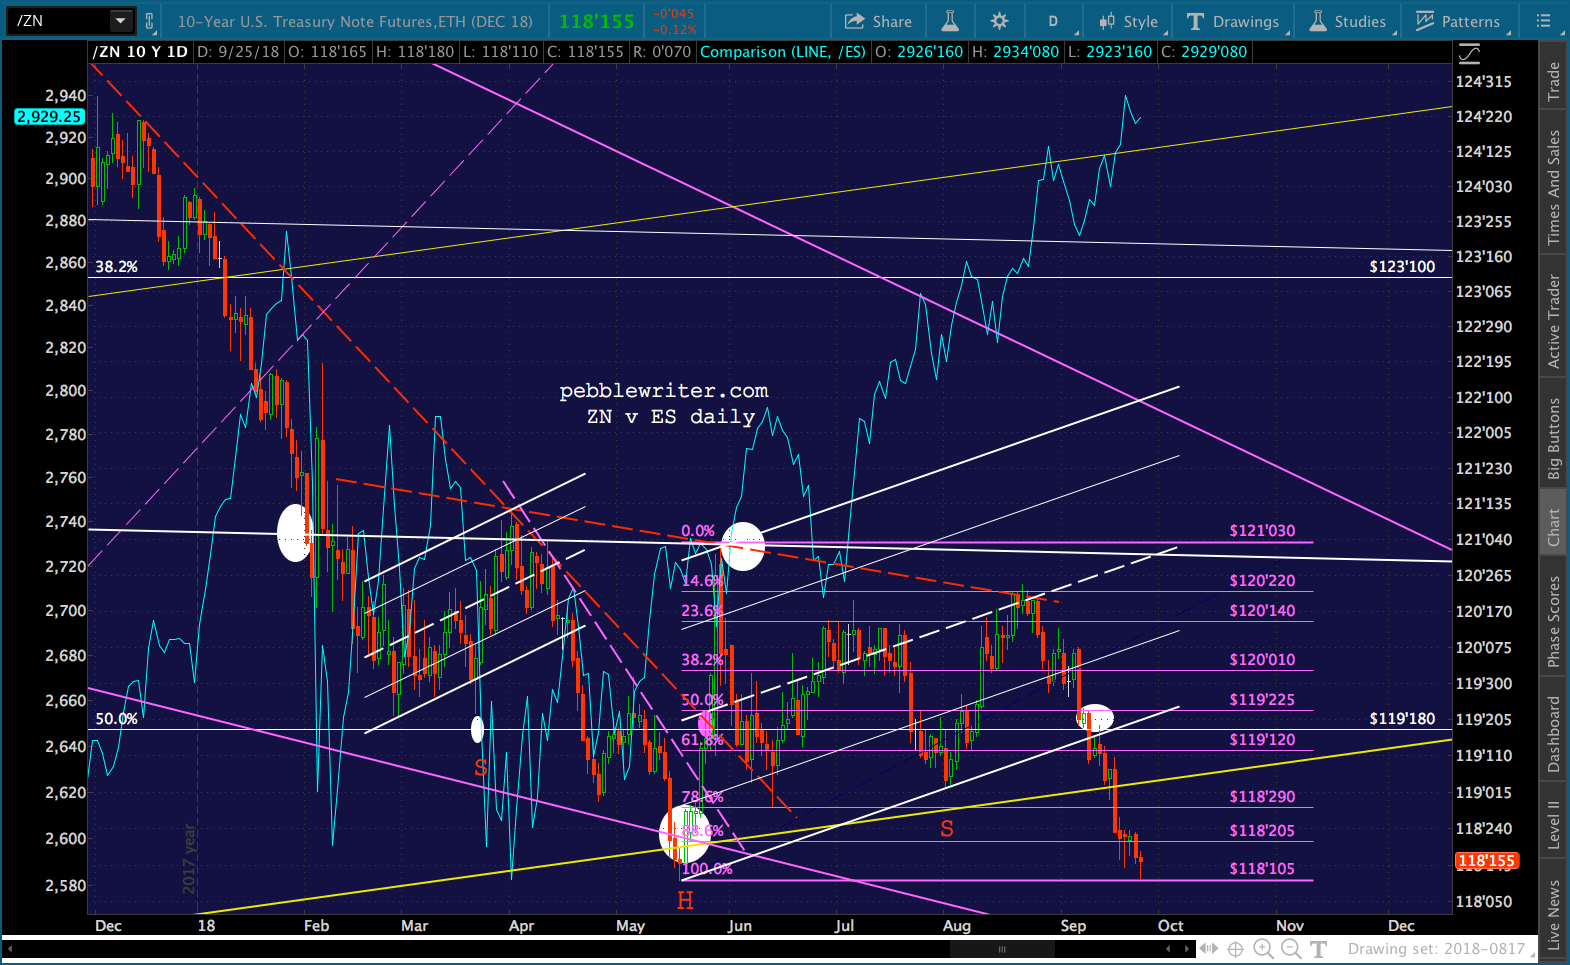
The 10Y is threatening to make new highs, and ZN new lows.
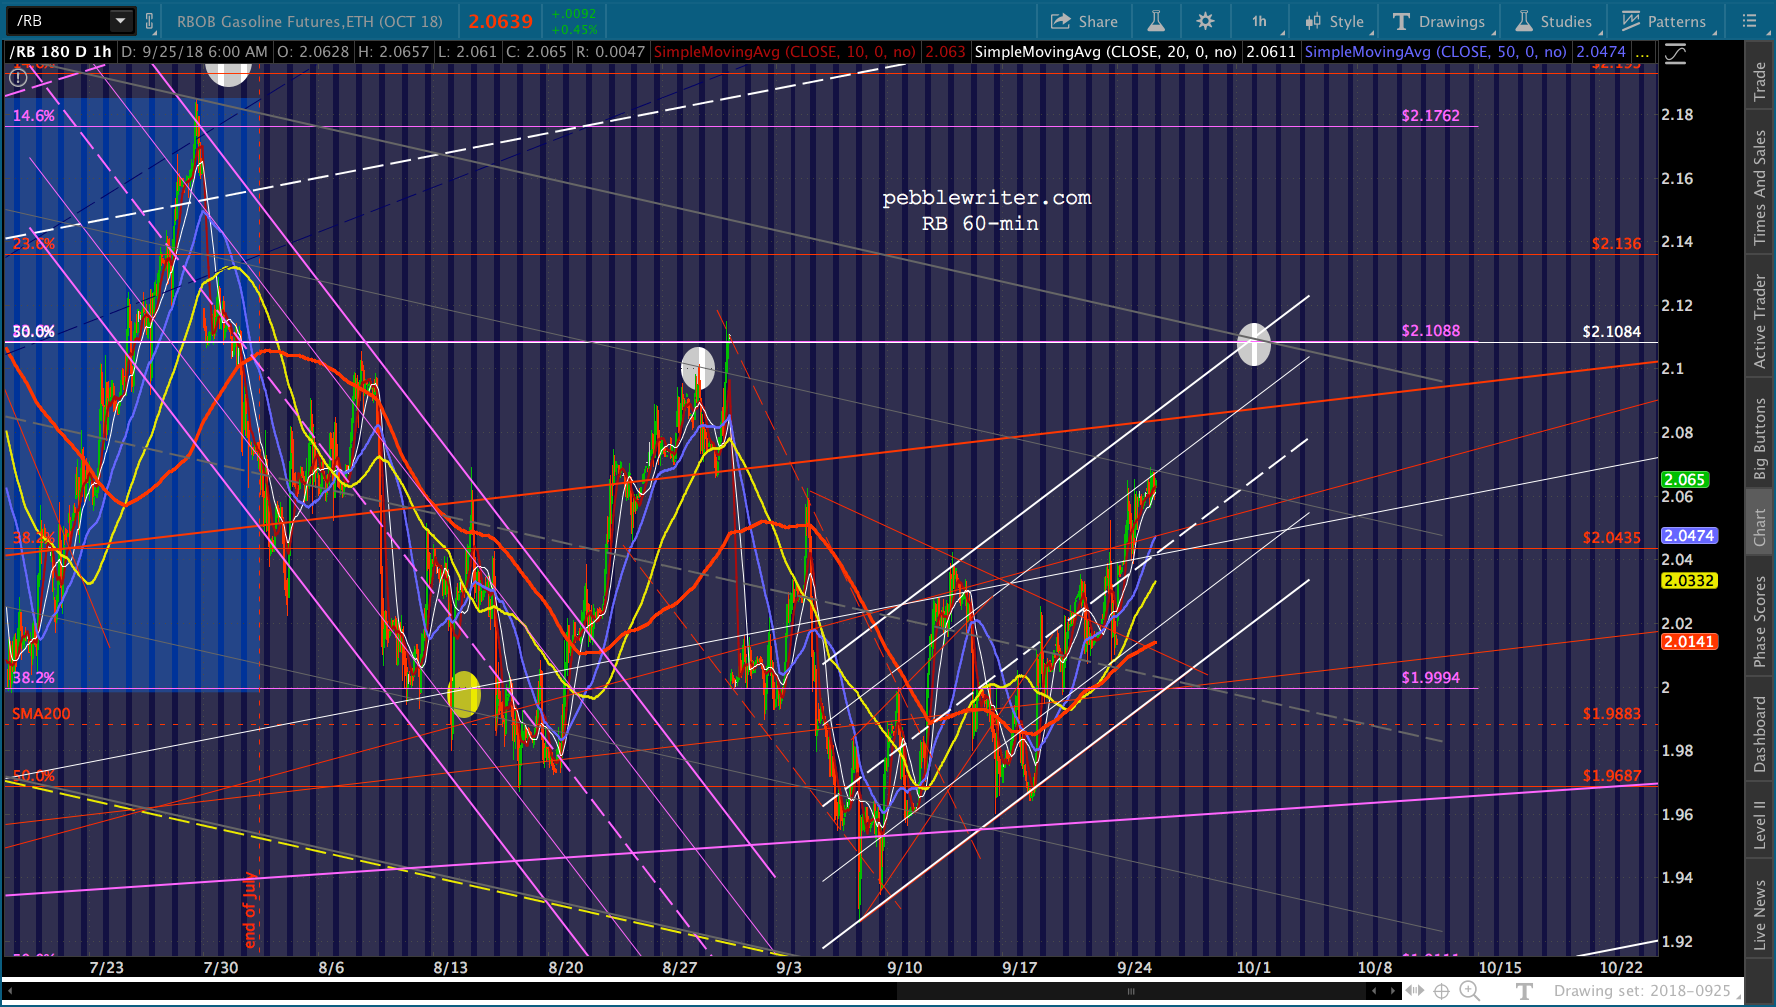
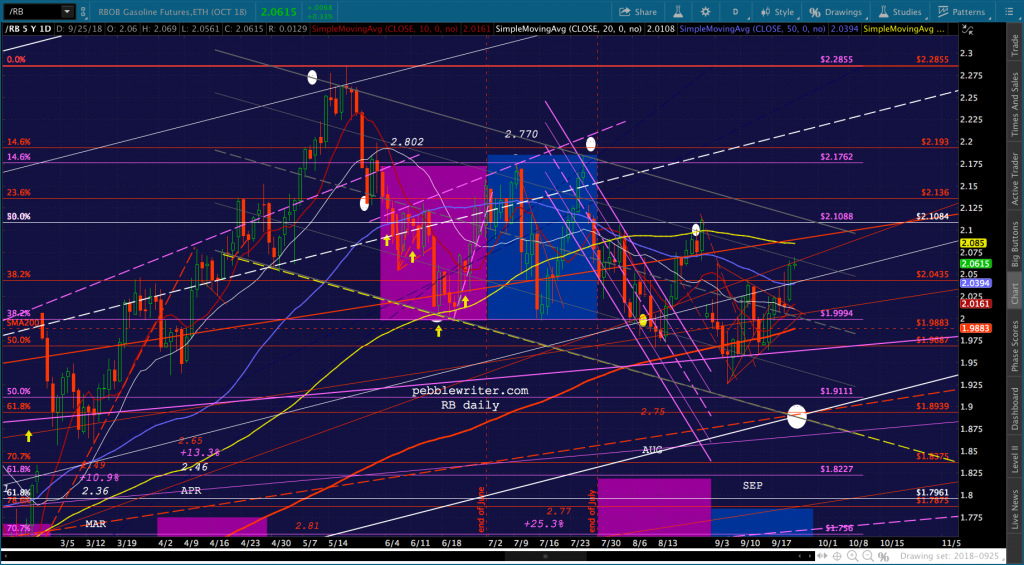
As long as stocks need propping up, RB and CL will continue to be under pressure to rally.

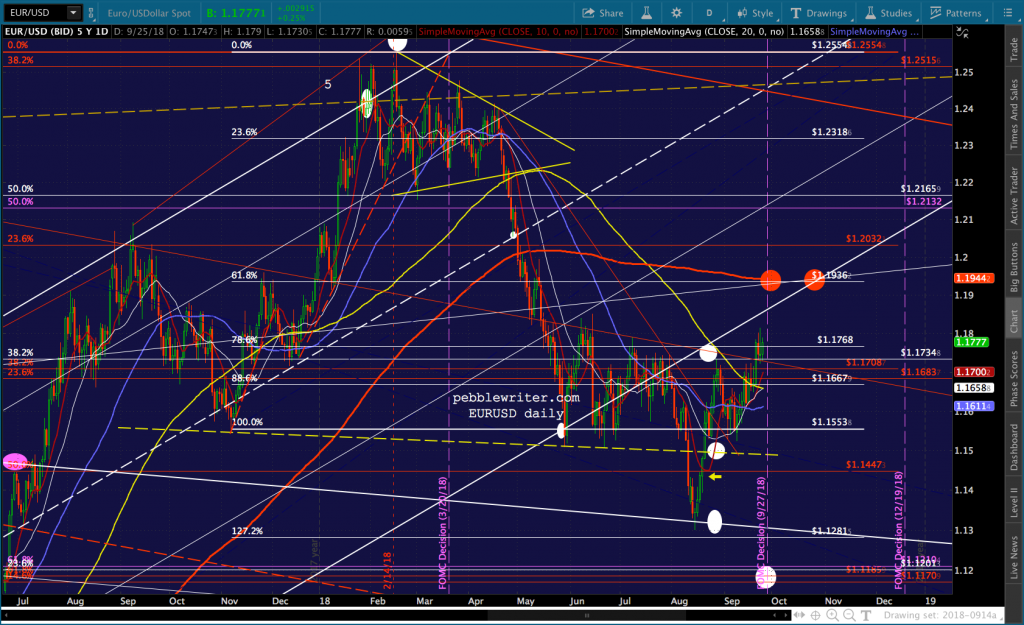
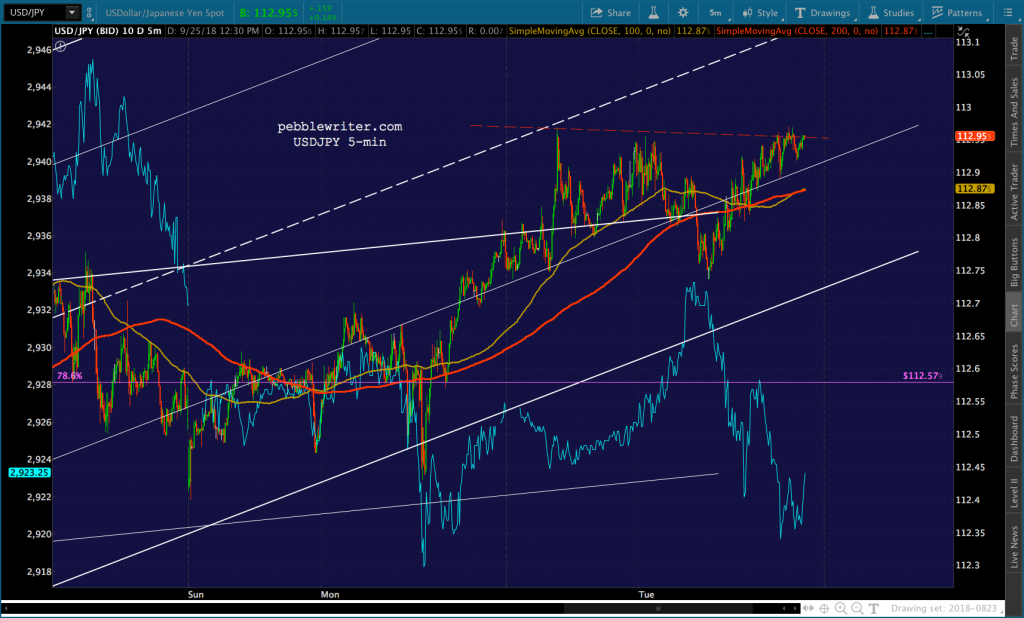
Speaking of under pressure…DXY is really struggling, hoping for a lifeline from the Fed.

It threatens to break out against the yen…

…but, continues to look weak versus the euro.
UPDATE: 3:30 PM
Not a whole lot to report this afternoon. SPX has been supported at the Aug 29 highs and has fleshed out the rising white channel in the process — a twofer. Its SMA10 should be around 2910 at the close, so support is coming to the index rather than the other way around. ES’ SMA10 is up to about 2913, suggesting further weakness late today or after-hours. Not that it’s currently backtesting the purple midline.
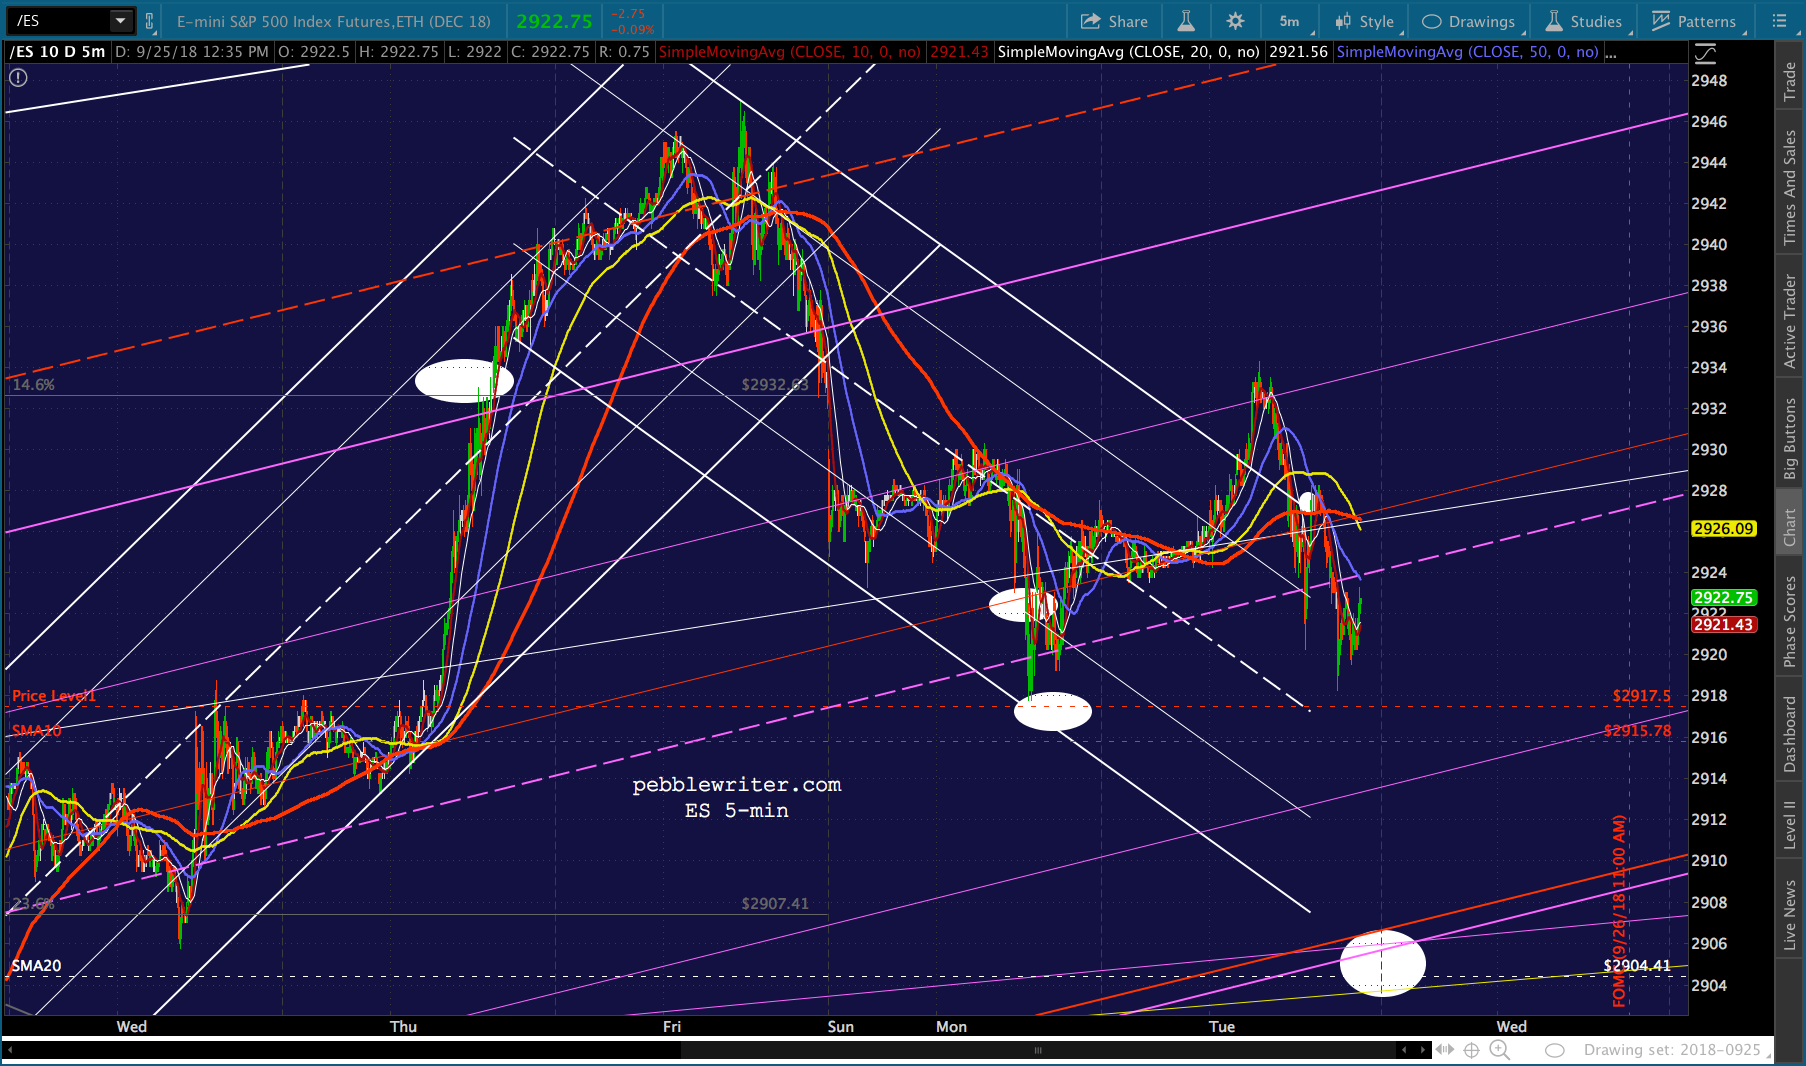
Other support: VIX is threatening to retreat back below its SMA10…

…while CL is holding steady… …and, USDJPY is still suggesting a breakout.
Bottom line, the charts suggest vulnerability here. But, as we’ve seen countless times, FOMC day often means ridiculous ramps and big bounces – certainly not worth betting the farm.
I will be out tomorrow morning, but will be back in time to observe the FOMC fun. GLTA.
.
Comments
2 responses to “Charts I’m Watching: Sep 25, 2018”
Hello Michael, any chance of a gold chart in the near-term? You haven’t remarked on it in awhile and it looks like either 1120 or 1275? or who knows perhaps as some of the die-hard bears are saying 900 or the goldbugs 1500? Thanks!
Added to the 9/27 post.