

SPX continues on the path we laid out for our new analog [see: The Game is Afoot.] We reached the lower end of our target range yesterday (Point A), breaking above the new channel mid-line.
We’re getting a back test of the broken channel mid-line here. SPX remains within the proposed rising channel — for now.

We remain long since 1405 on Oct 25. But, this is a good time to review the technical picture. I’ve also adjusted the analog somewhat, including the targets for this particular leg.
continued for members…
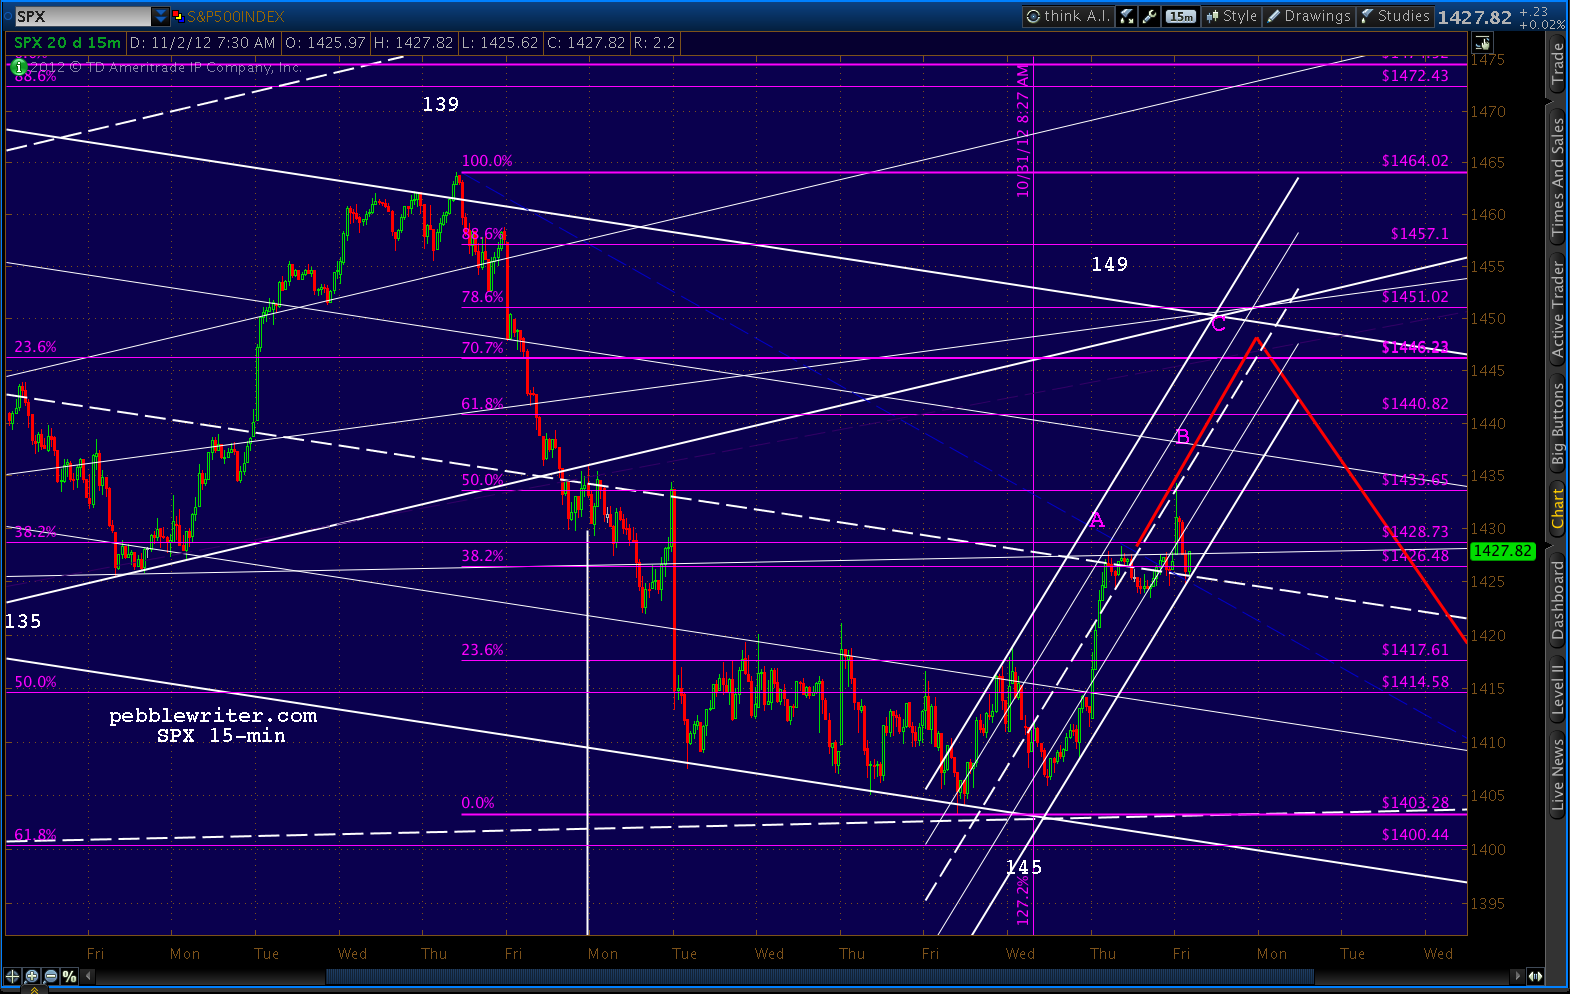 Point B represents the next higher channel line and the .618 Fib at 1438-1440. While, Point C represents the top of the channel as well as the .786 Fib line.
The current channel up is a carbon copy of the ones that came before.
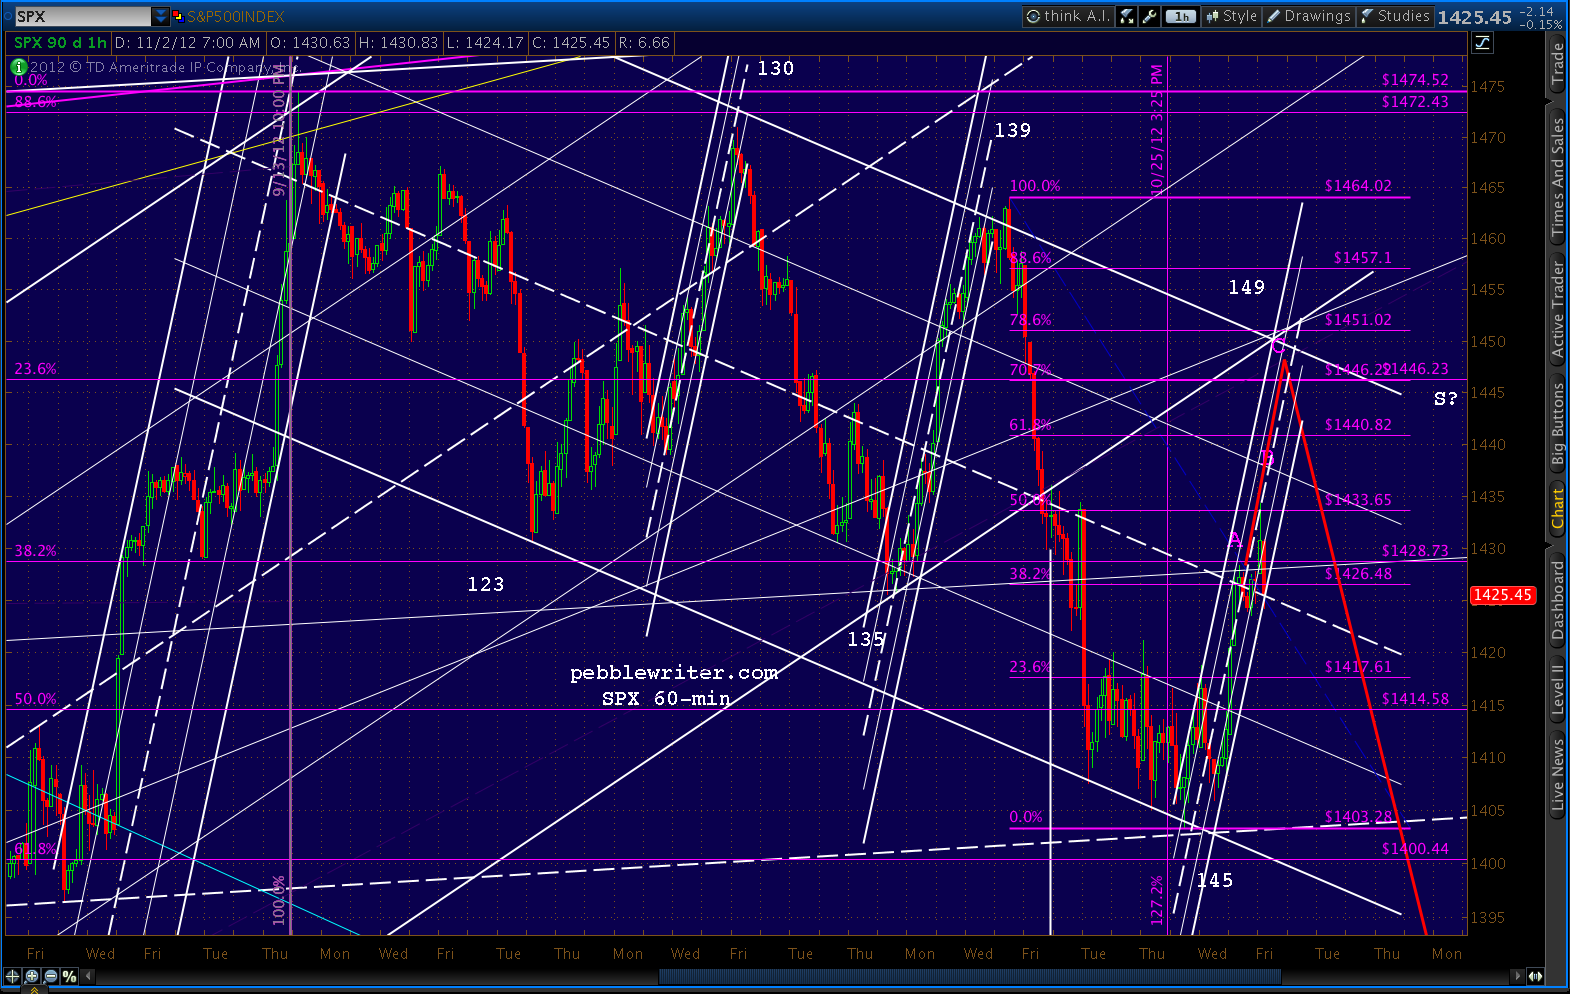 But, there’s always the potential for the channel to widen, as the RSI indicates there is slightly more downside to come in this corrective wave (assuming that’s all it is, for the moment.)
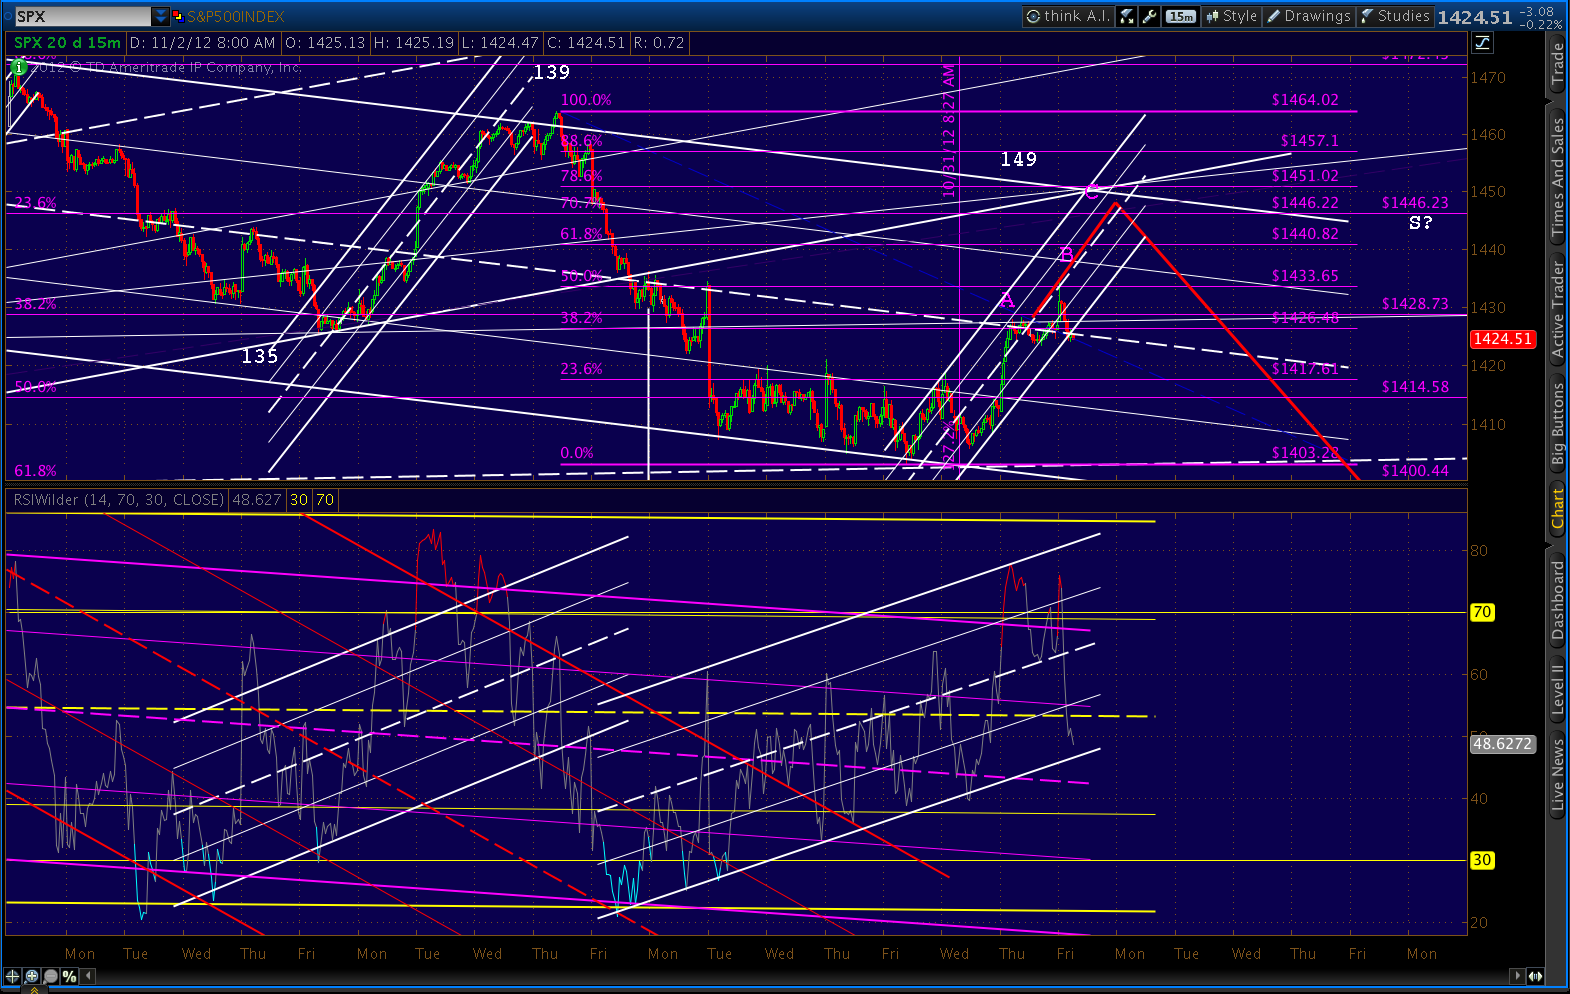 If 15-min RSI breaks down from the current channel, we’ll reconsider whether 1434 was all the upside we’re going to see.
There’s no negative divergence yet — except on the short-term charts (5-15 min.) So, I’m very hesitant to call a top on this latest leg up.
DIVERGENCE?
Negative divergence is simply the establishment of a “higher high” on the SPX price, concurrent with a “lower high” on its RSI. In the above 15-min chart, for instance, the latest peak in RSI was lower than the previous one — i.e. a lower high. But, it came at the same time as a higher high in prices — 1434 versus 1428.
When there’s a mismatch between the two, we call that divergence. And, on the 15-min chart, it’s negative divergence because RSI (which is usually right) made a lower high while price made a higher high. When I see negative divergence across charts of longer time frames (or all time frames) then a rally is usually running out of steam.
Negative divergence can also happen while prices are falling. It simply means RSI made a lower low while prices didn’t — indicating the downturn likely isn’t finished.
Positive divergence during a rally means RSI has made a higher high even though prices haven’t — and is a sign of higher prices to come. During a decline, positive divergence usually means the downturn is running out of steam. Here’s an example on the 60-min AAPL chart.
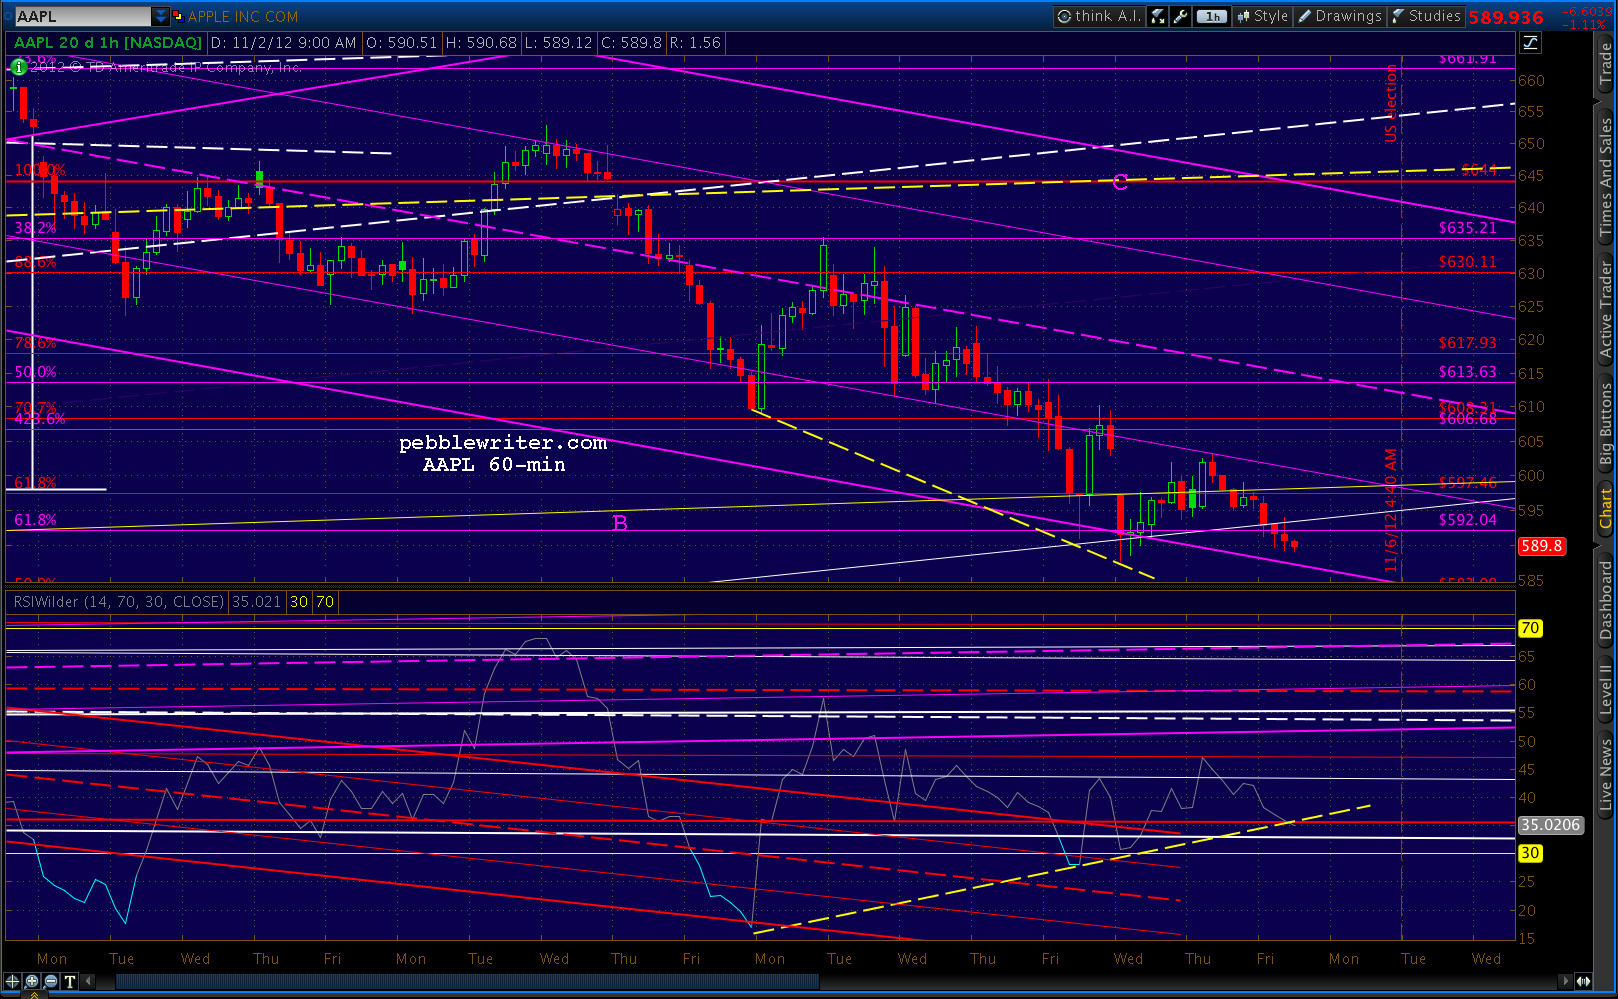 Note the dashed yellow trend lines. Price made a lower low, even though RSI made a higher low. The decline was stopped then and there; and, the subsequent higher high on RSI portends an upturn in prices (as long as the TL isn’t broken.)
When prices and RSI are both moving in sync, making new highs or lows together, we consider that a stable situation that should lead to a continuation of the current trend. The 30-min (and higher) chart — as seen below — still reflects this condition.
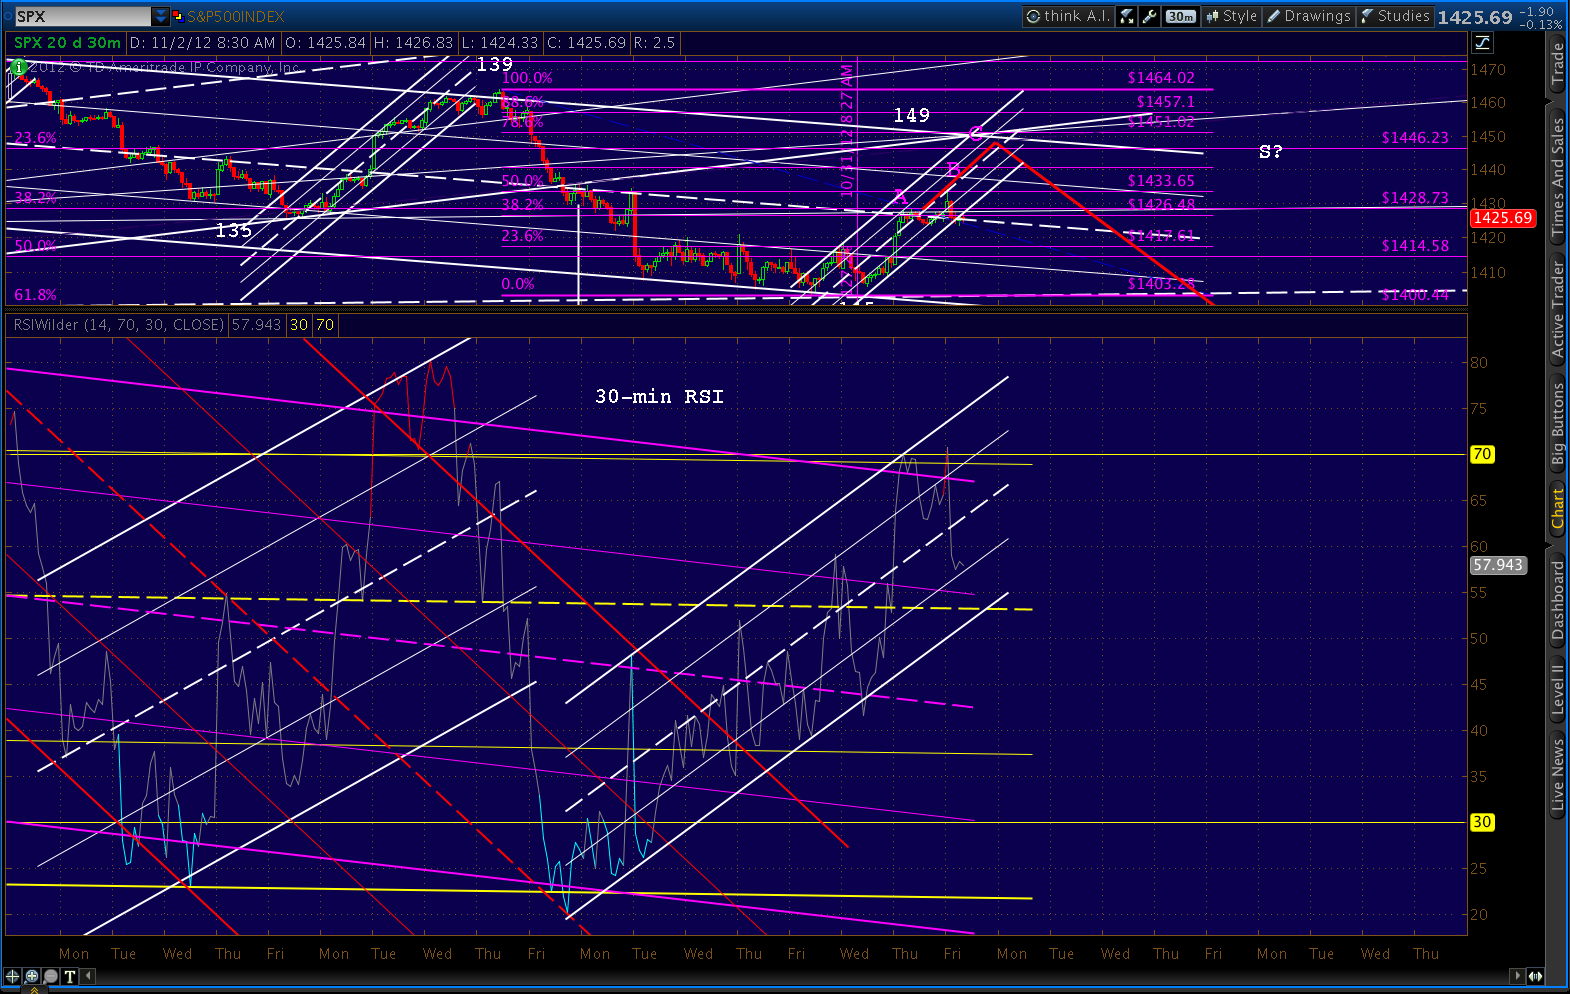 I normally scan various time frames during a rally, as negative divergence on any time frame is a warning. If it’s contained to shorter-term time frames, it’s usually a smaller corrective wave that is part of every move up. But, if it spreads to longer-term time frames, then the rally is probably going to fail soon.
These are generalizations, of course, and should always be confirmed with other indicators such as price channel and RSI channel moves, harmonic patterns, etc.
UPDATE: 12:15 PM
SPX continues to flirt with a little H&S pattern that would complete at around 1423.60. It bears watching, and stops around 1423 would make sense as a precaution. Just know that market makers are well aware of chart patterns, too; and they would love nothing more than to briefly push your panic (sell) button before reversing course and taking prices higher.
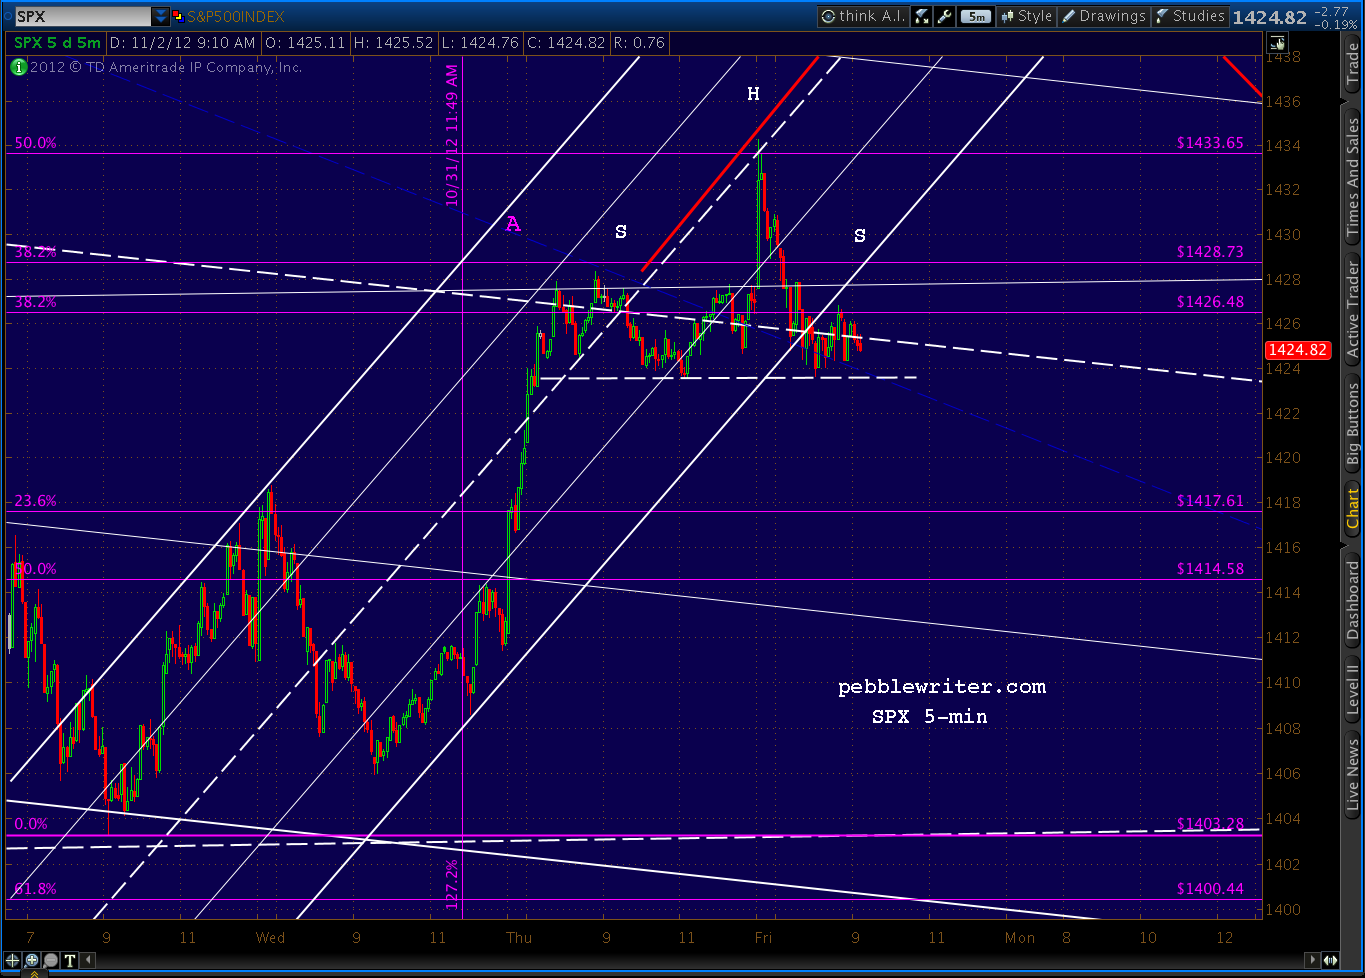
At the end of the day, it’s all about sucking investors like us into taking positions based on moves that turn out to be short-term blips, thus taking us out of logical medium and longer-term positions.
More in a few…
UPDATE: 1:25 PM
It’s a little nerve-wracking, but nothing worse than we’ve seen over the past six weeks since SPX 1474. The little H&S keeps threatening. But, RSI says it’s just a corrective wave.
I’m fine tuning the channel a little bit, to see if it can accommodate more sideways movement without damage. Bottom line — no problem. The previous channels can even be tweaked to match the slope.
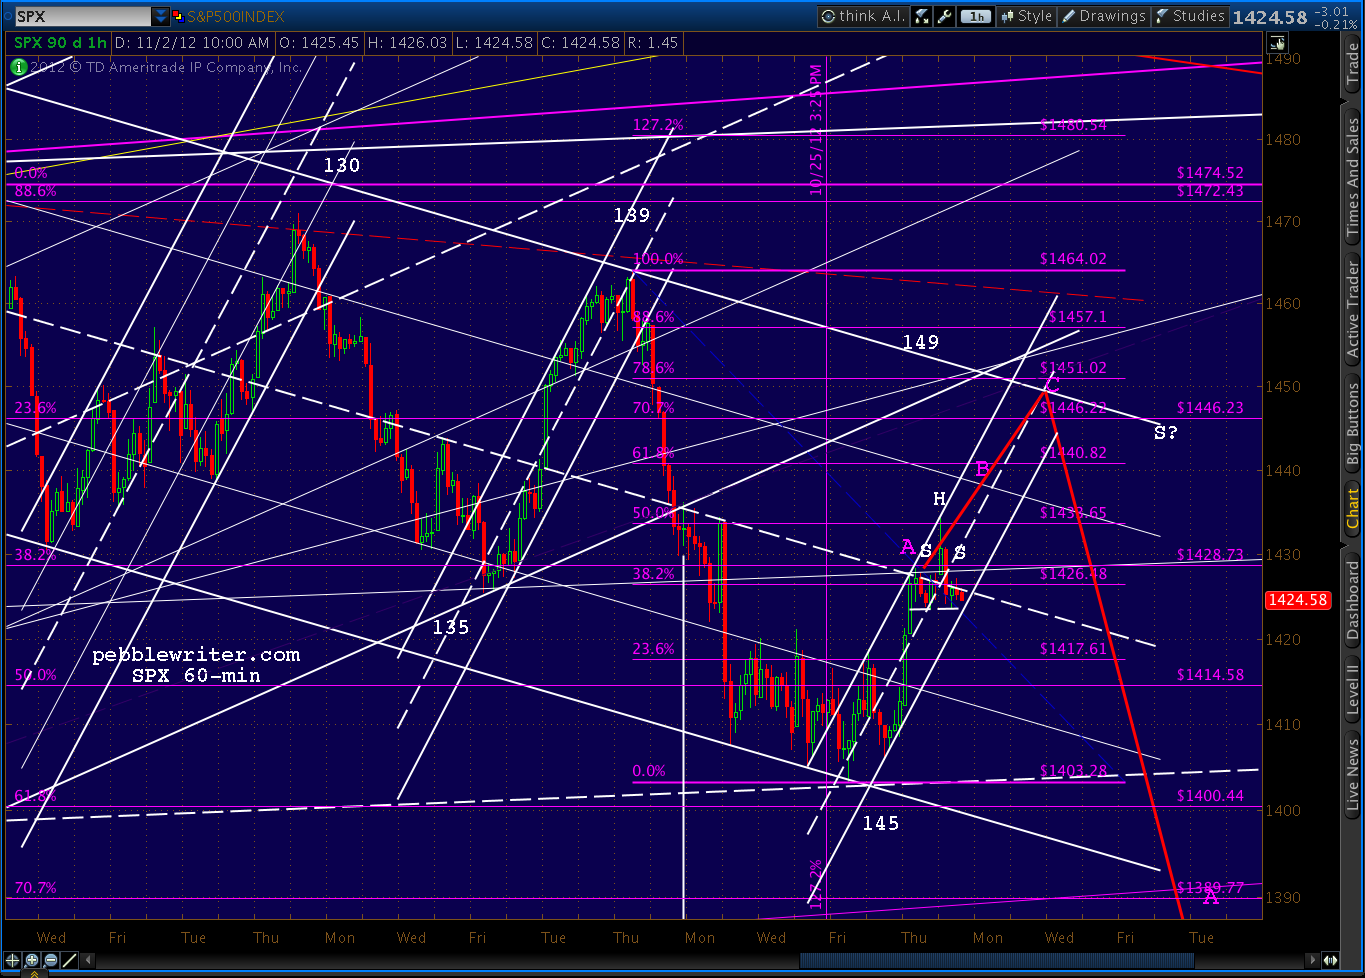
 Looks like good support at the bottom of the RSI channel. Note that it’s a higher low than the last channel bottom tag.
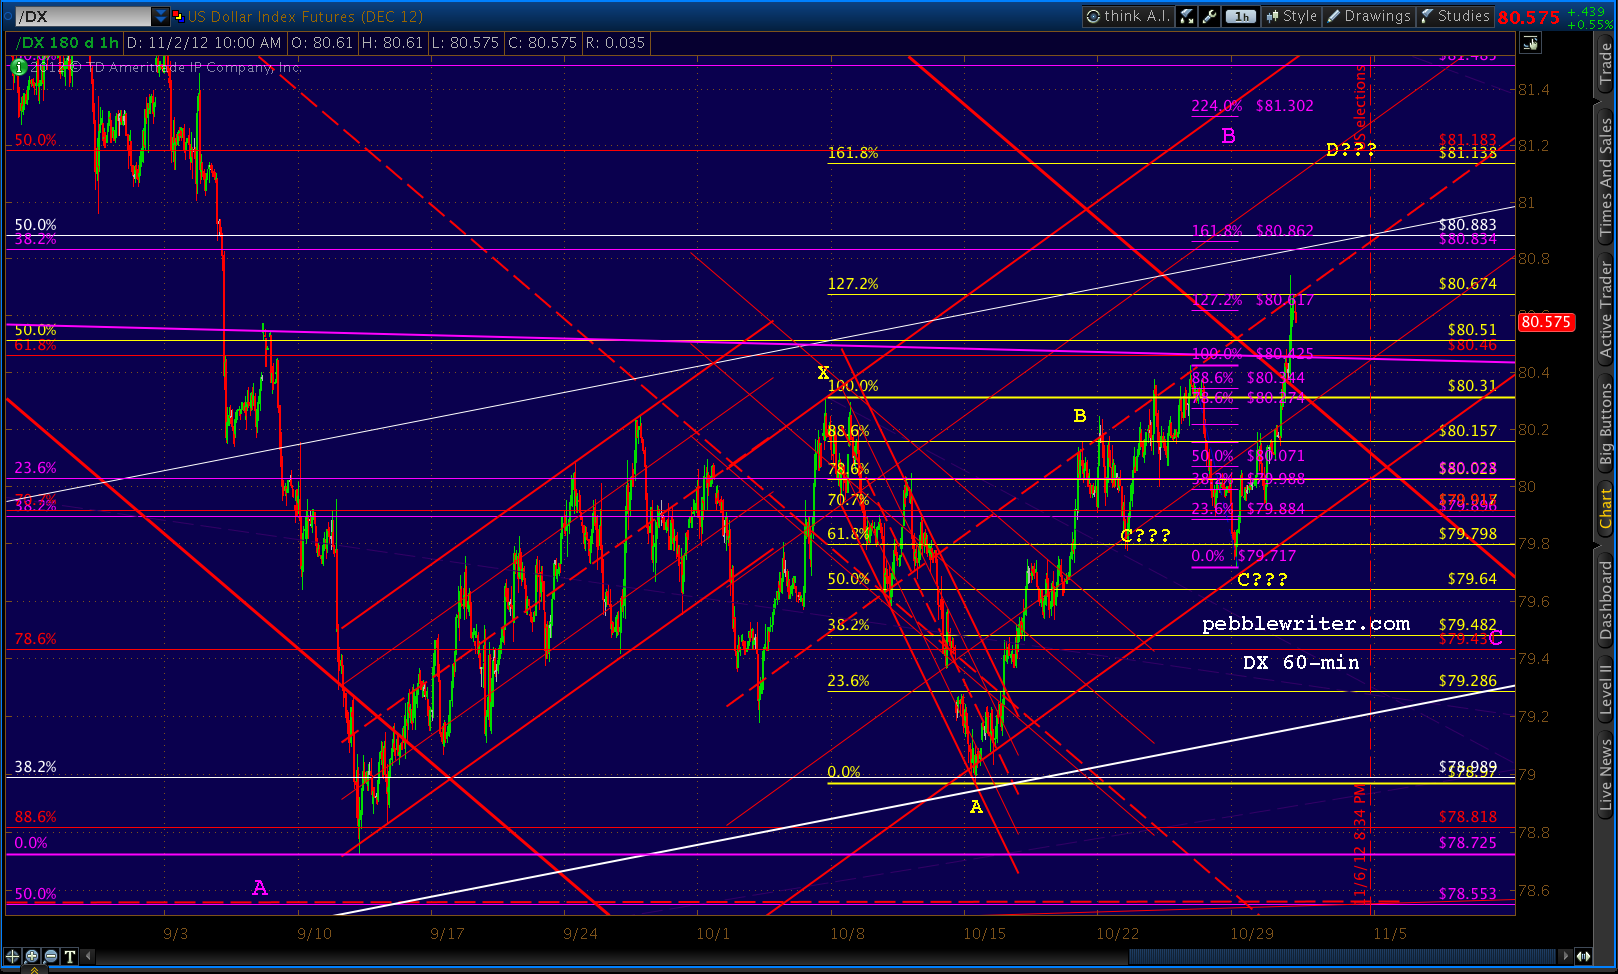
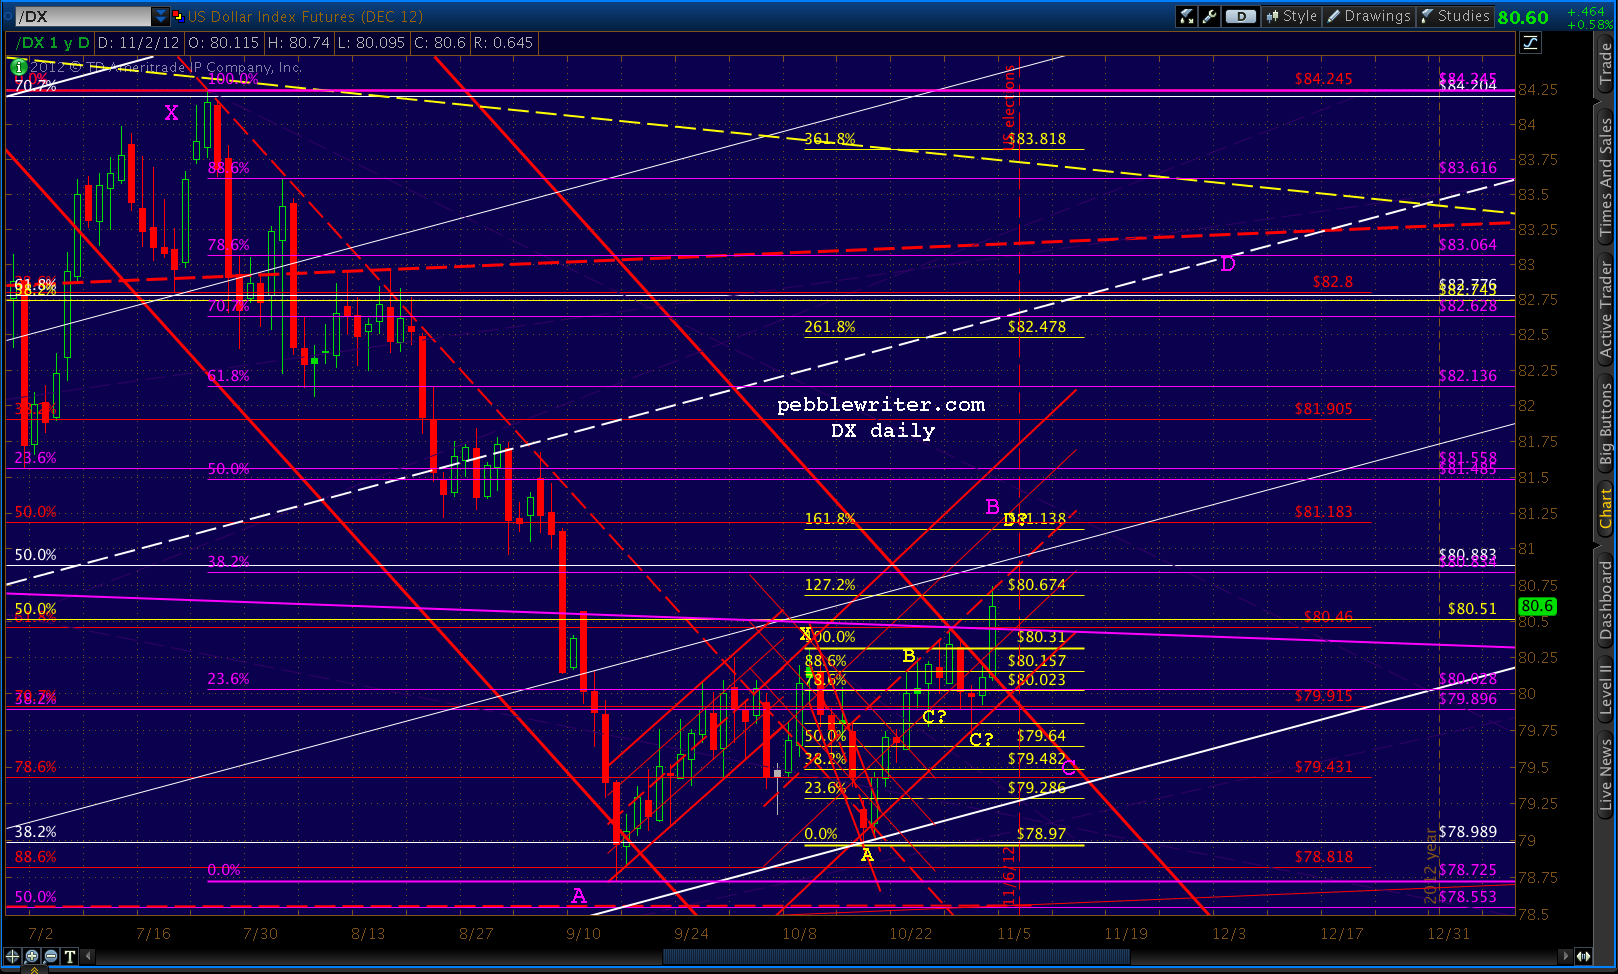
One thing that’s been very unusual the past couple of days is the disconnect of the usual inverse relationship between the USD and stocks. Typically, a rally in the dollar means a dump for stocks, and vice versa. Almost all rallies in equities have been accompanied by a rally in the EURUSD.
A rally in both at the same time means something’s gotta give. Some dollar charts:
UPDATE: 2:00 PM
The little H&S played out, so we could see a sell-off down to around 1412 or so. I’m closing my long position at 1423.50 and playing along on the downside, with the expectation of going long again either later today or tomorrow.
There’s a high potential for being whipsawed here. Longer-term investors might want to hang in there. The 30-min and 60-min RSI’s show good support at these levels. Charts in a minute…
15-min:
 In the time since I posted above, the RSI channel broke down on both the 30 and 60-min charts.
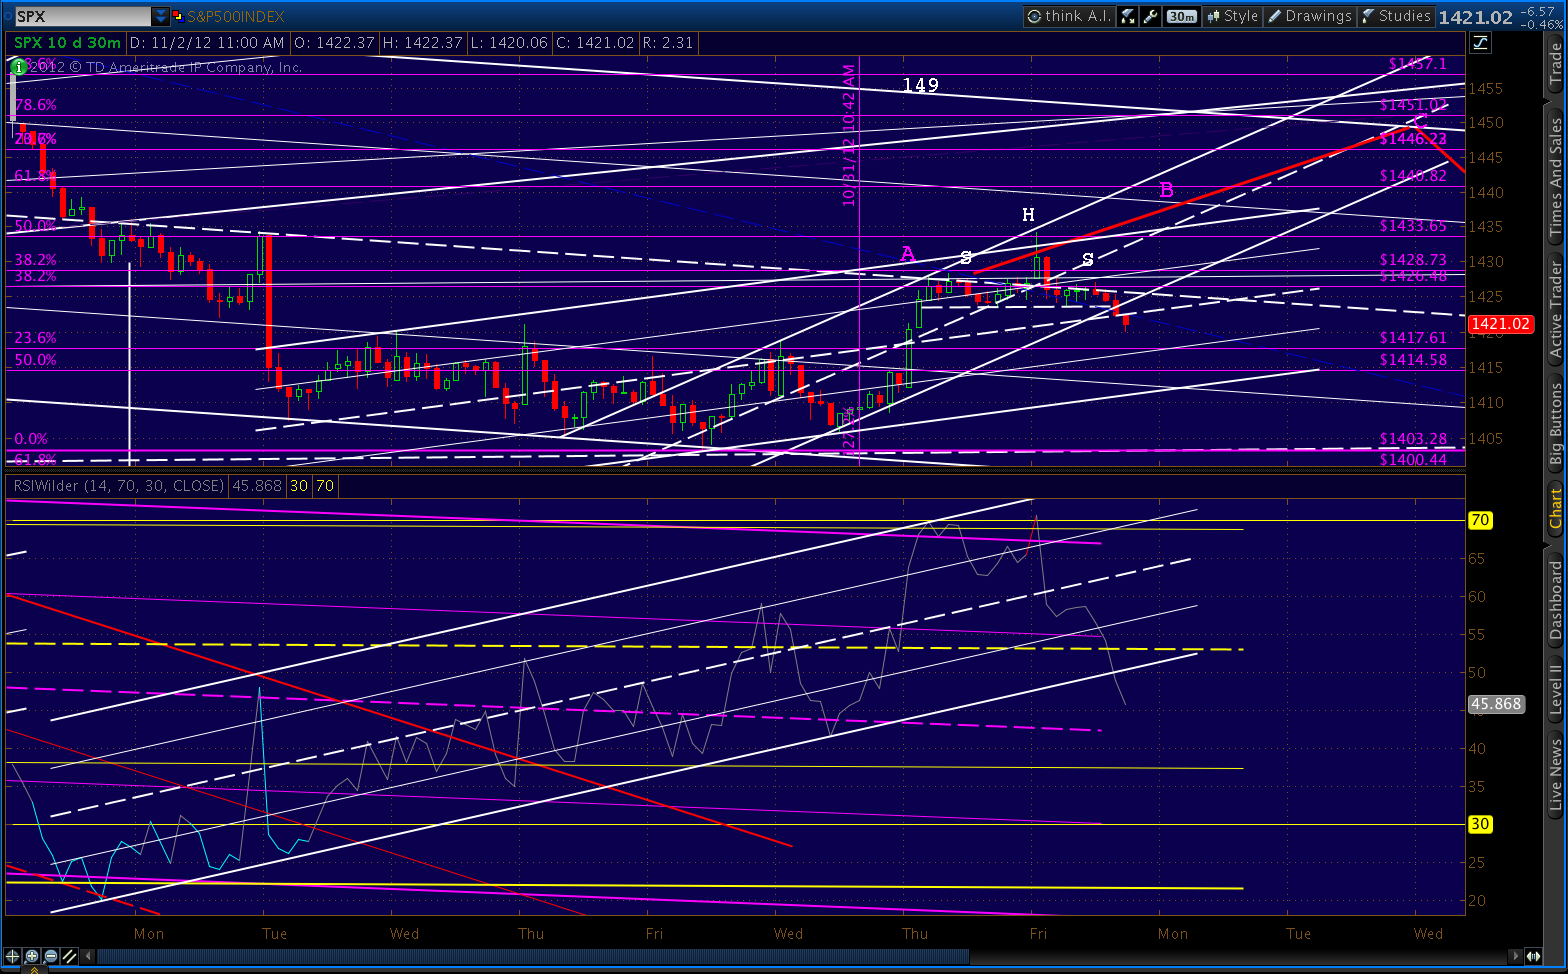
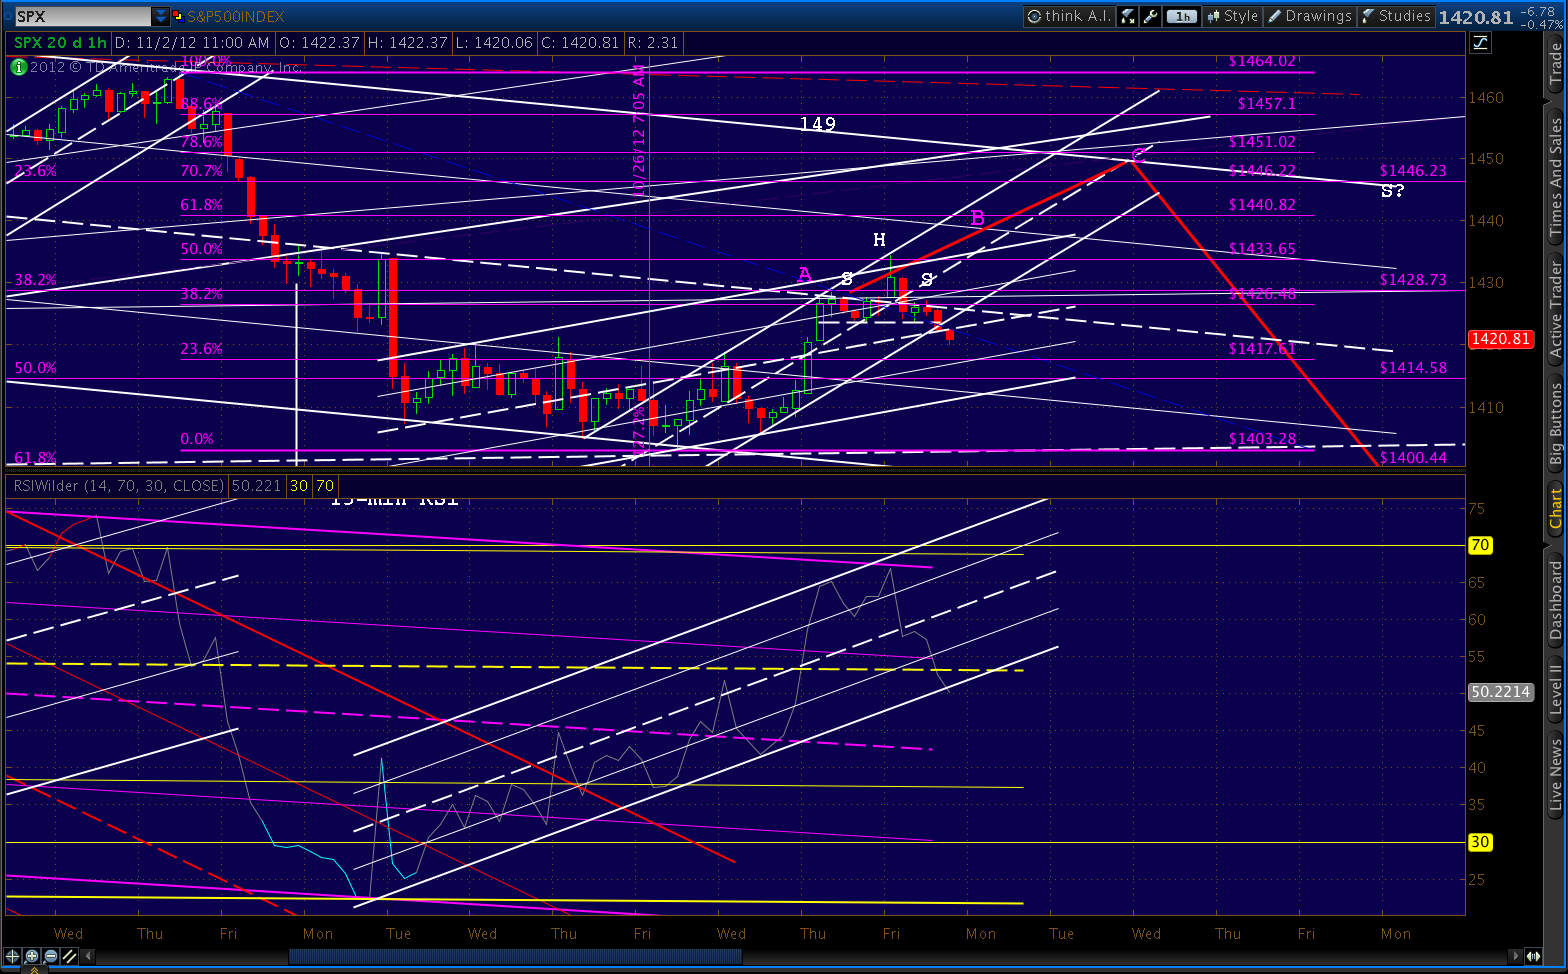 Watch for a back-test of the broken neck-line; but, prices should move lower afterwards.
UPDATE: 2:35 PM
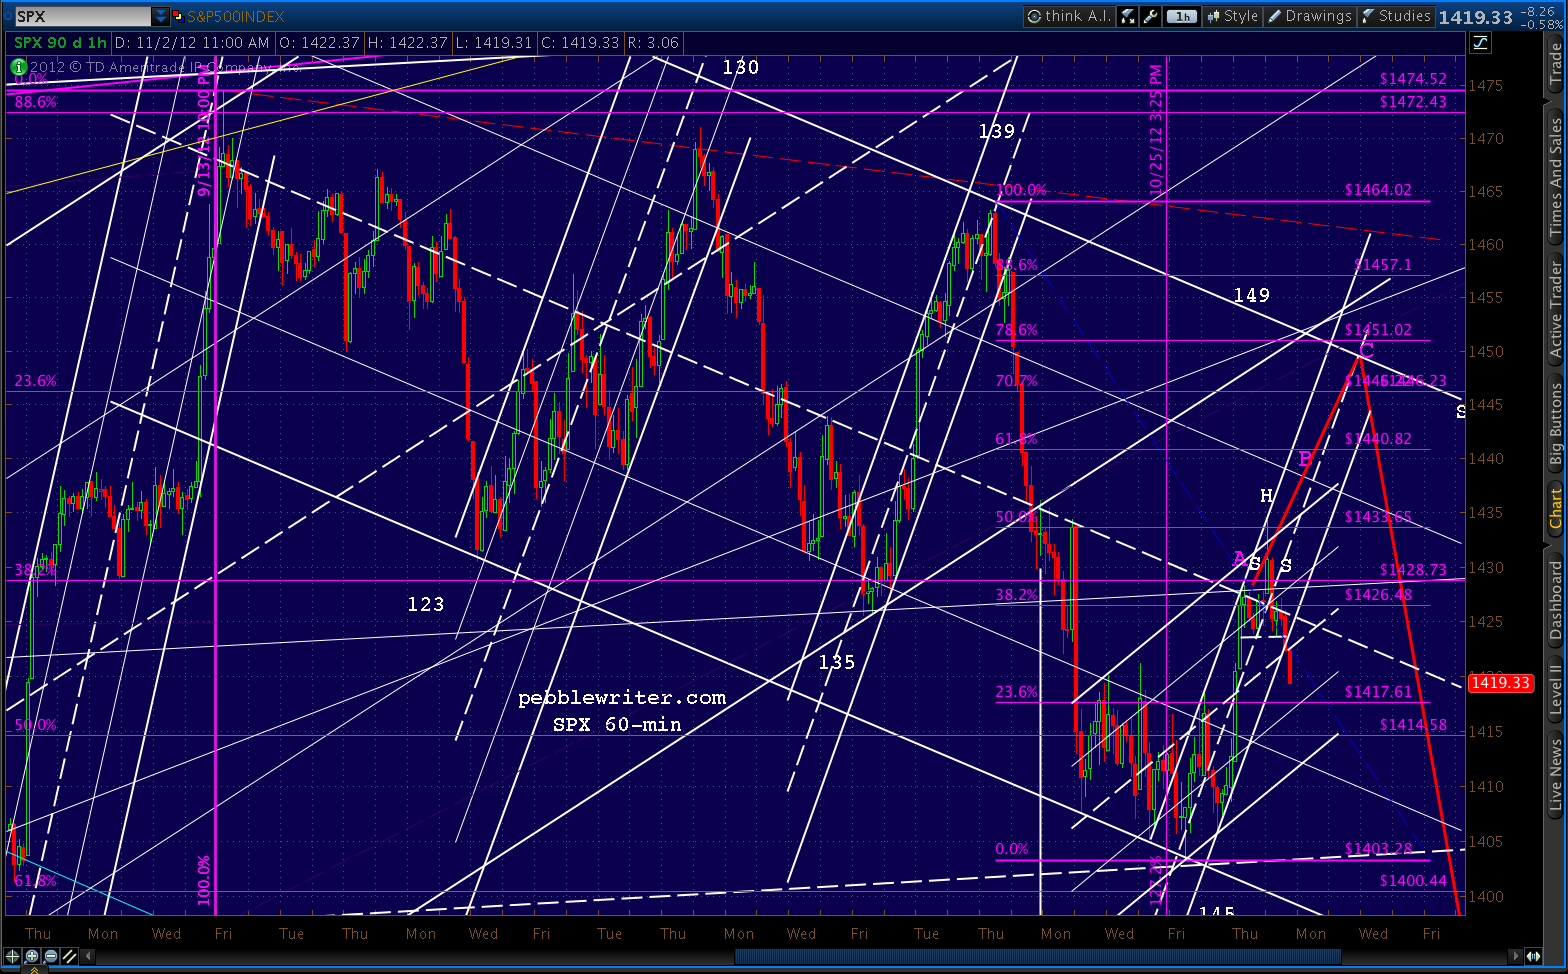
SPX continues to sell off, pushing below 1420 now. The chart below shows a potential target area around 1412.15 — the .146 of the last move down and the .707 of the latest move up as well as the intersection of a couple of potential channel lines.
UPDATE: 3:45 PM
We just reached 1412.91 — close enough to my 1412.50 target. Divergence is mixed, with positive on 5, negative on 30, even on 60, 4-hr and daily. My gut feeling is we’ll rebound here, but I have nothing to hang my hat on other than a couple of hazy RSI channel lines and a cynical attitude regarding TPTB. I’m closing out my shorts here and will stay in cash over the weekend.
Charts in a few…
Comments
9 responses to “Charts I’m Watching: Nov 2, 2012”
PW, I had saved this chart from earlier this year with your prediction of 1472 on it. Nice work. Looks like that Fib fan line is back in play near 1400??? Could you update this chart and publish it again, perhaps with the next lower red Fan line there to let us know where the next Fib Fan support area might be? Thanks….as you know, I love your stuff. Makes me think!
https://pebblewriter.com/wp-content/uploads/2012/05/2012-05-30-bottom-fib-fans.png
Looks like dollar breaking out and euro breaking down…these trends usually boad poorly for stocks…
PW – looks like a rejection at the confluence of the 20 and 50 DMA, once broken becomes
resistance. Think this could be more significant?
I hate it when I’m right….my Nov calls are getting killed, but a full boat of SPXU that I’ve harvested half and set loose stops on the rest at least made nice money day trading. Now, let’s watch the swing trade work out. And yes, I picked up more Nov calls to average the price down a bit.
By EW, this is either an impulse wave down headed for new lows, or we just had an A-B-C (that was 3 of C at 2 pm ET hour) wave 2, looking for wave 3 up provided 1403.xx isn’t taken out. Overlapped wave 1 up, so can’t be a wave 4 still. TGIF and have a great weekend everyone! Time to workout and enjoy the day trading profits. 🙂
PW – love the negative divergence explanation and how to use RSI. Suggest a cut and paste and adding under your learn section. Thanks.
PW, please let us know when you have gone short.
PW, looks like a H&S may be setting up here with the LS around 1428 yesterday, H at 1434 this AM, and RS to come shortly or in at 1426.83. Neckline is horizontal at 1423.5ish. Haven’t looked at volume pattern, but wanted to alert traders to it here in case that neckline gets taken out. FYI.
Thanks. Just posted that a bit ago — probably while you were writing this 😉 For those wondering, a H&S performs best when the left shoulder volume is the highest (vs head and RS.) In this case, the head was highest, so it detracts slightly from the likelihood of it playing out. But, it’s definitely still worth watching.
I have a Nov SSO call position on looking for your 1450ish target, but am playing the downside (hedging, if you will) with my usual SPXU on the 60-min BB pierce and close within setup I use often. Right now, the 20-period MA on the 60-min chart is around 1419, and a breakout of the rectangle formed mid-day will be the correct measured move. If the entire H&S plays out, looks more like 1414 levels. Also, this correction today looks like an A wave complete & B wave creating this long stretch intraday, leaving a C wave of some sort to play out to the downside (wave 2 down retracing the wave 1 up that finished at 1434, or wave 4 down finding support at 1423.5 with wave 5 of 1 to finish up at your 1445-1450ish white channel target). I’m weighted to the upside, but with two setups saying there is more downside possible, I gotta hedge that risk until it shows itself to be fake. TGIF and good work as always PW! You really help compliment the big picture so I can work on setups on the short term side of things. THANKS!