

SPX got a 15-pt bounce off our next downside target on Friday. But, it only managed to bounce back to the H&S neckline – even after the last minute ramp.
With ES currently showing a 1-pt loss, this supports the deeper backtest we discussed at length the last few days.
Arguing against it: the USDJPY, which is enjoying one of those unmotivated BoJ 1%+ pops. continued for members…
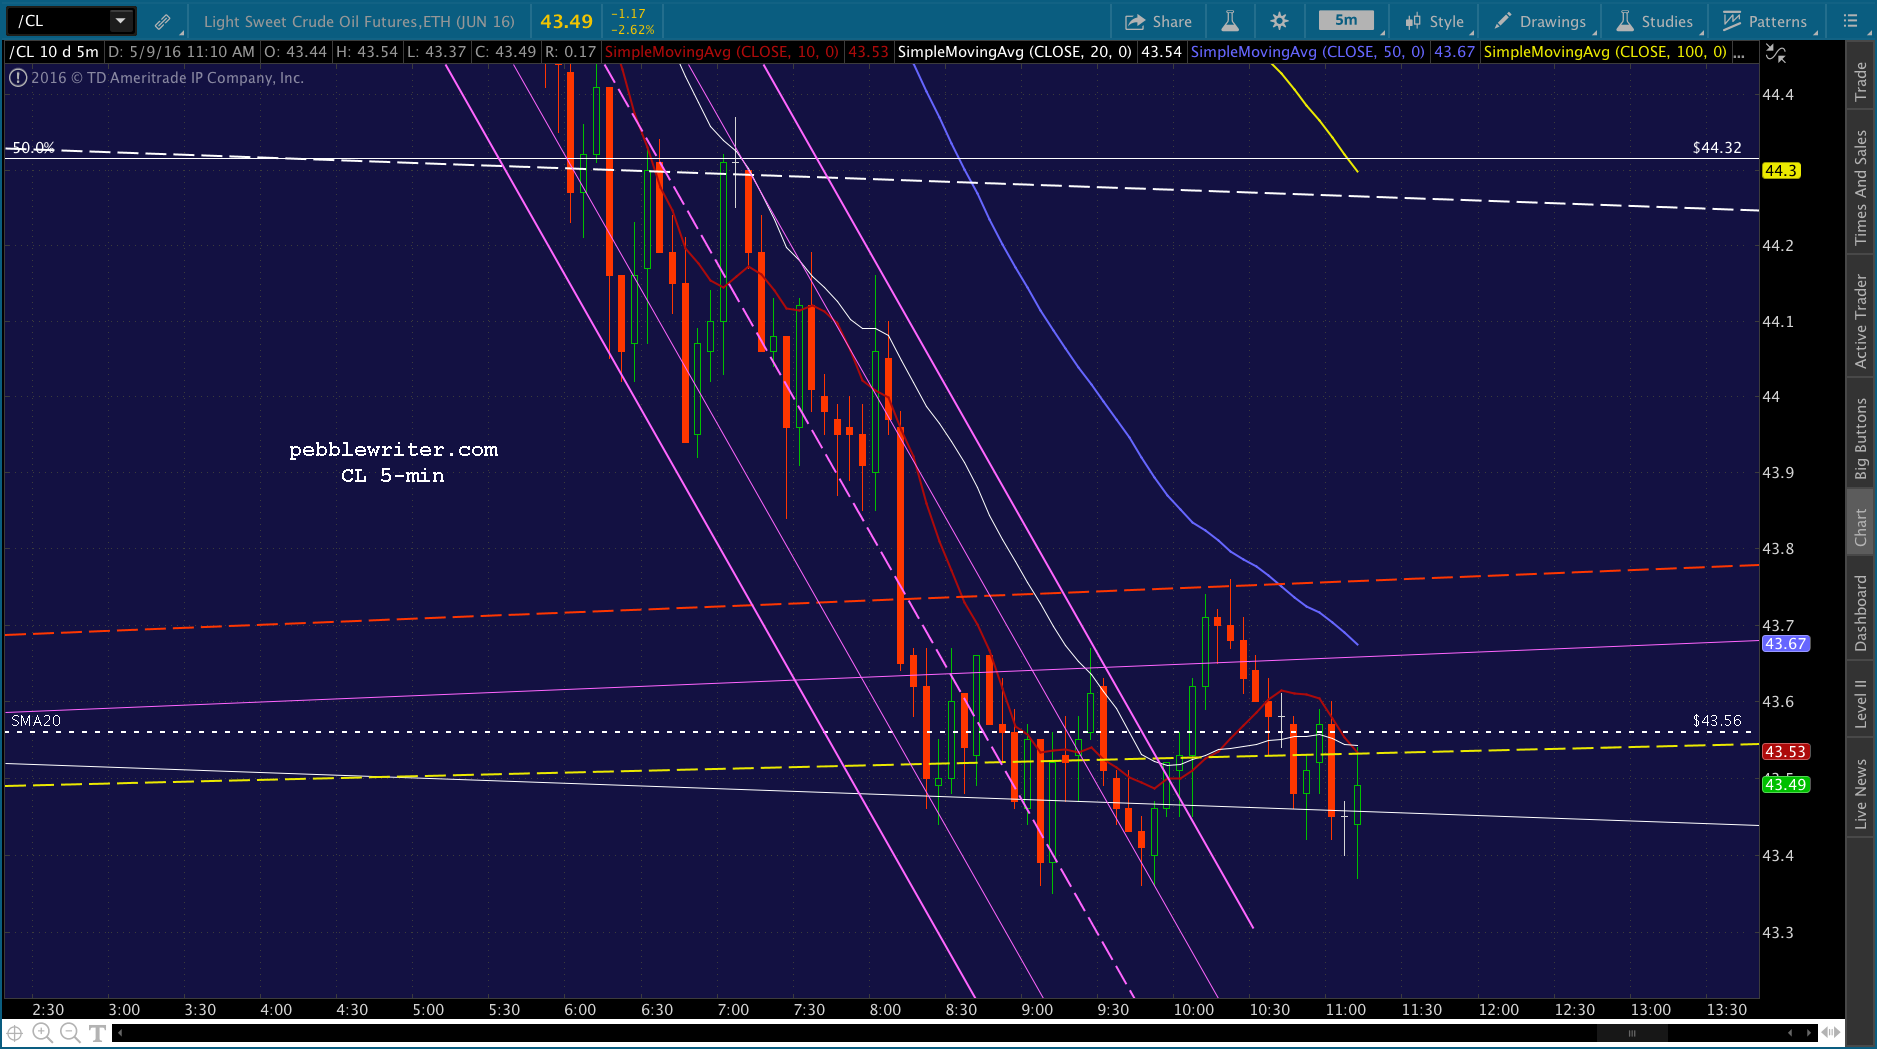
CL is off 1.28% at the moment, but has the purple channel .786 and SMA20 support just below. Should it drop through that support, it would certainly help SPX reach a lower low that it saw Friday.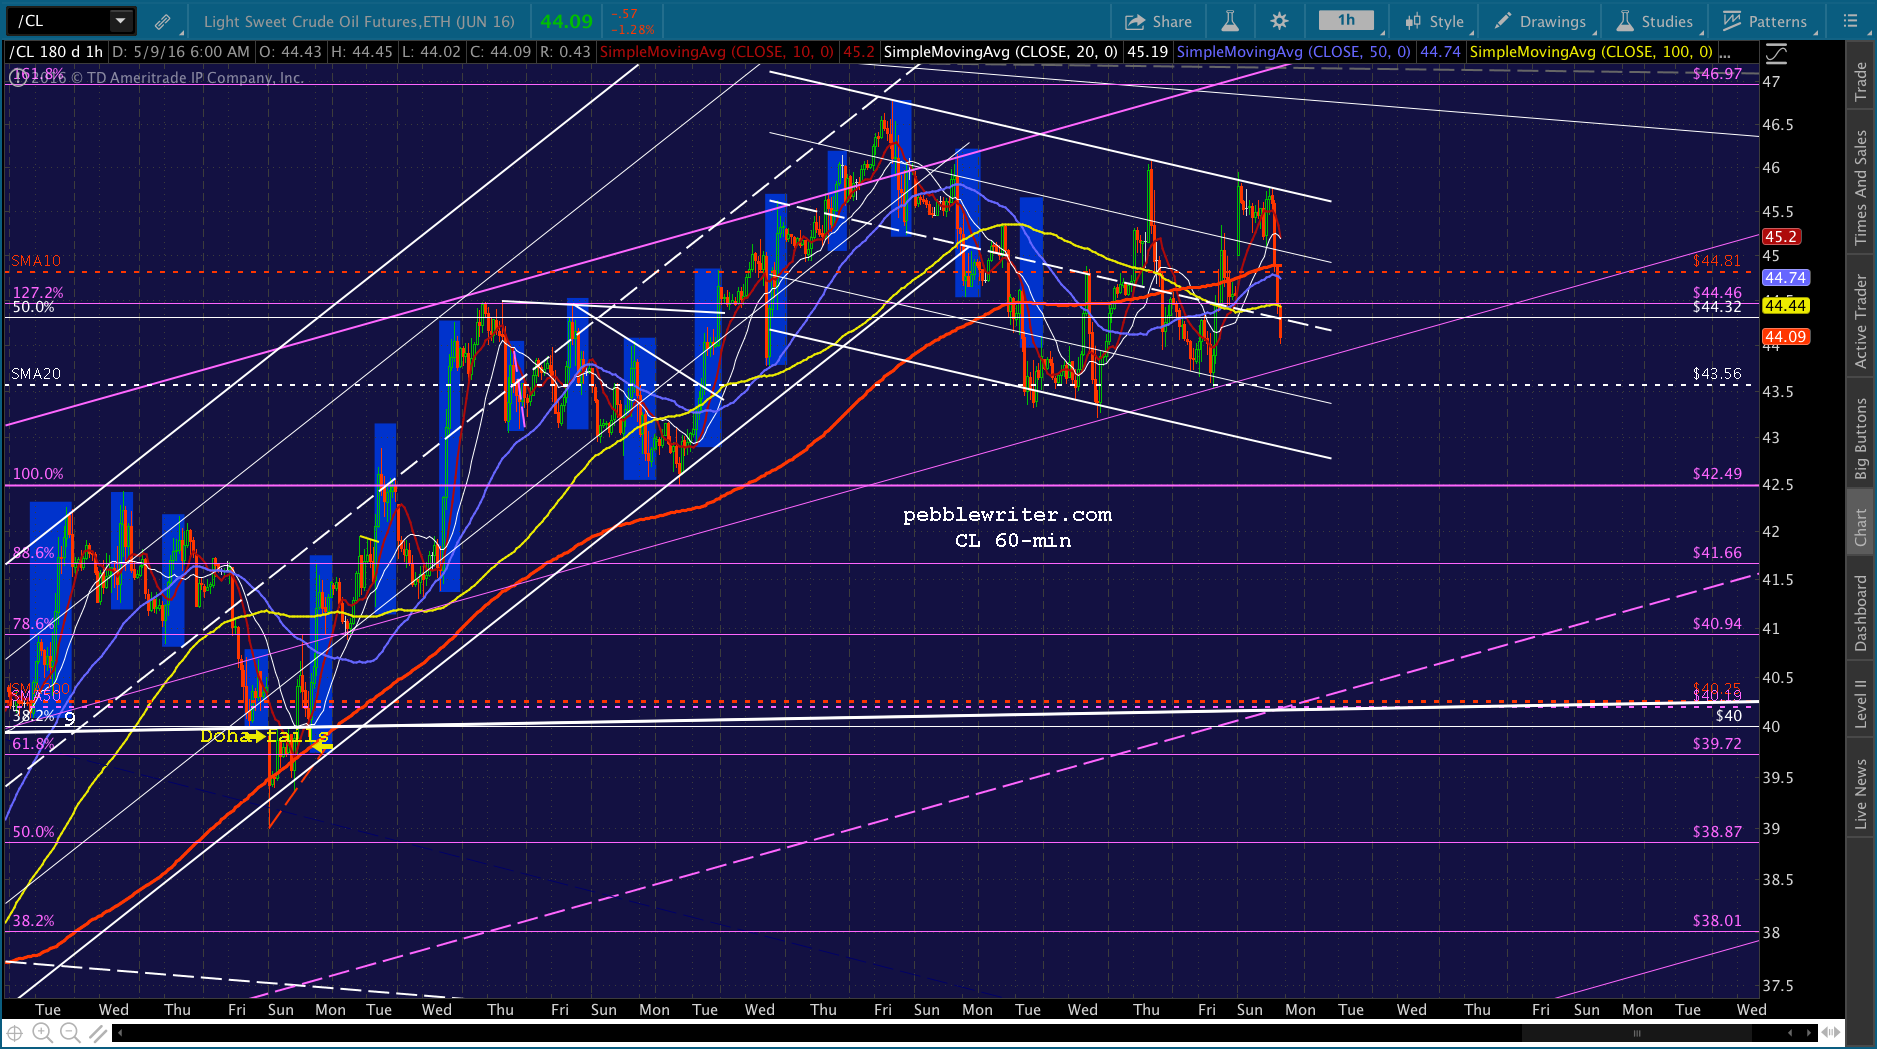 The actual target level is a little fuzzier, as we wouldn’t have a clean intersection of several features all at once. But, FWIW, the gray channel top is currently around 2033-2035. The falling white channel wouldn’t reach it until late in the day.
 On the bullish side, the rising red channel did hold — which suggests it’ll continue to hold. And, it has that USDJPY support mentioned above. Bottom line: too close to call. I’d wait for a breakout or breakdown relative to the neckline.
UPDATE: 9:38 AM
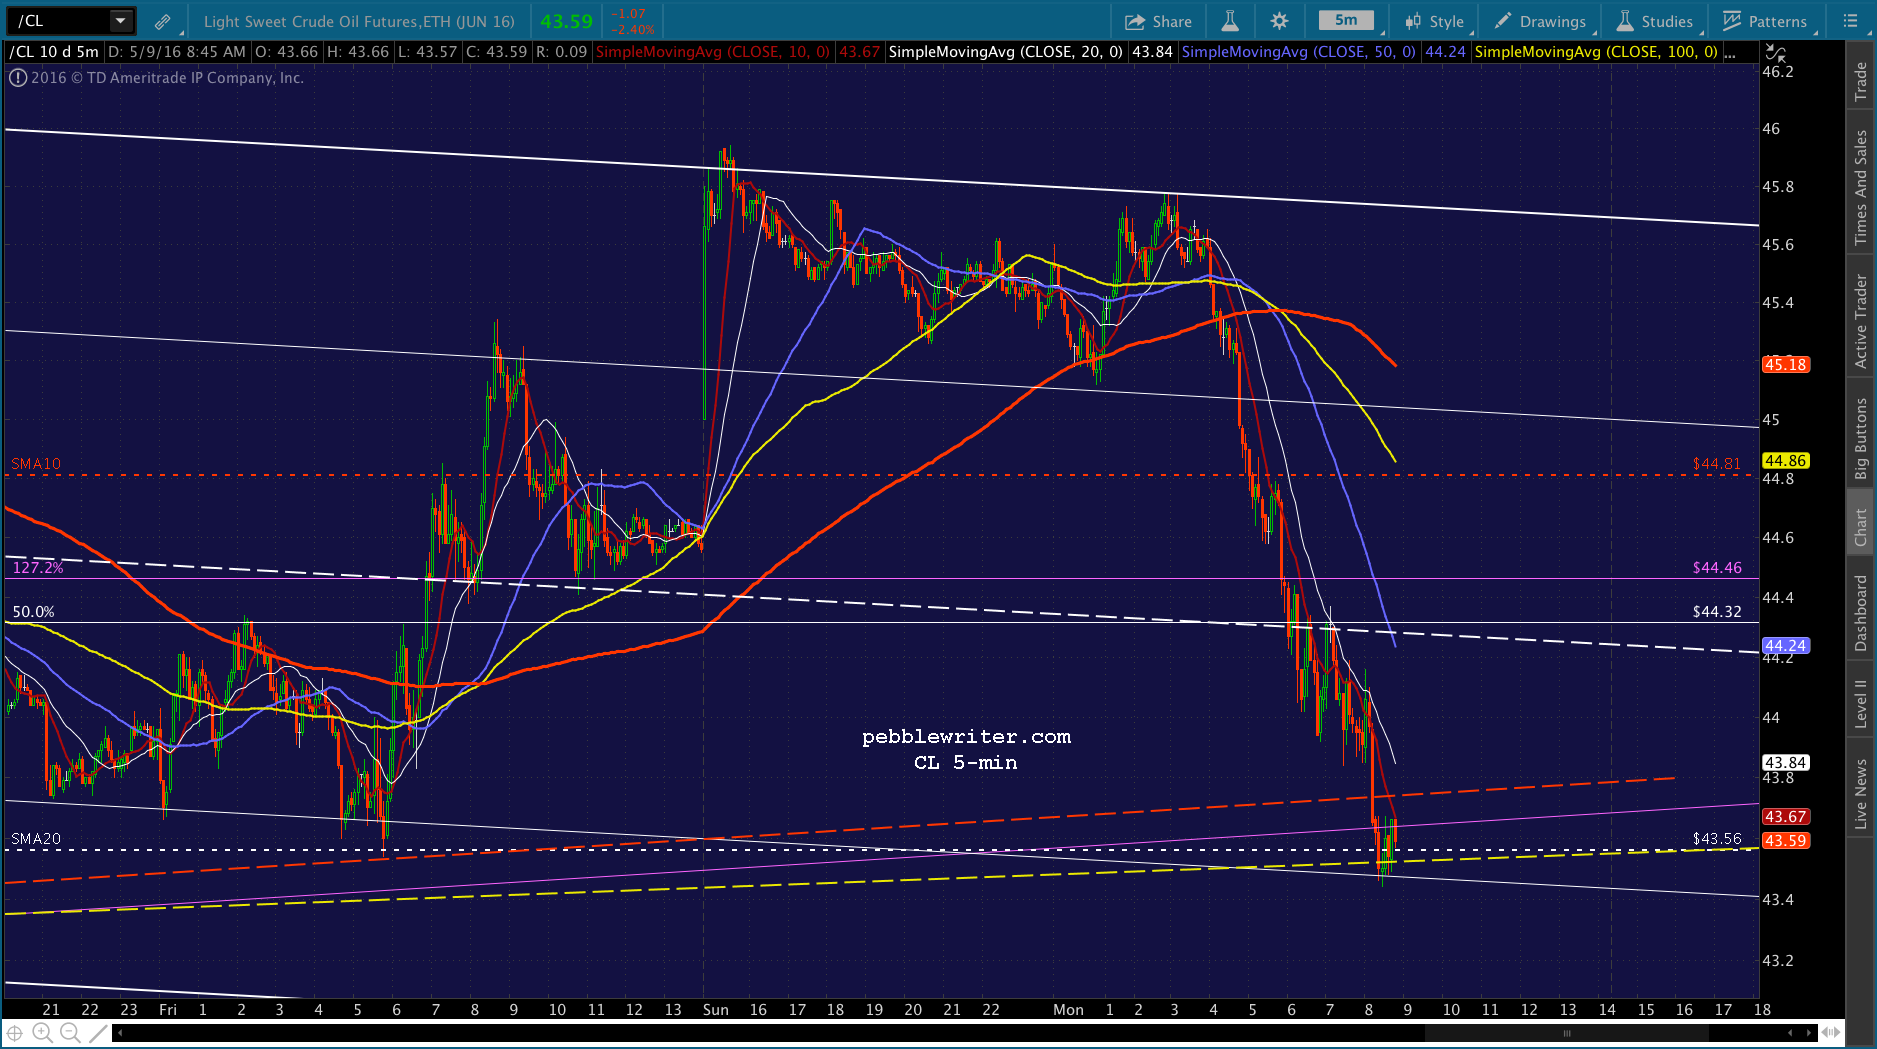
SPX broke above the neckline and a TL off the Apr 28 highs, but still has to make it over the white channel midline. It would be safer to wait and see before jumping in on the long side.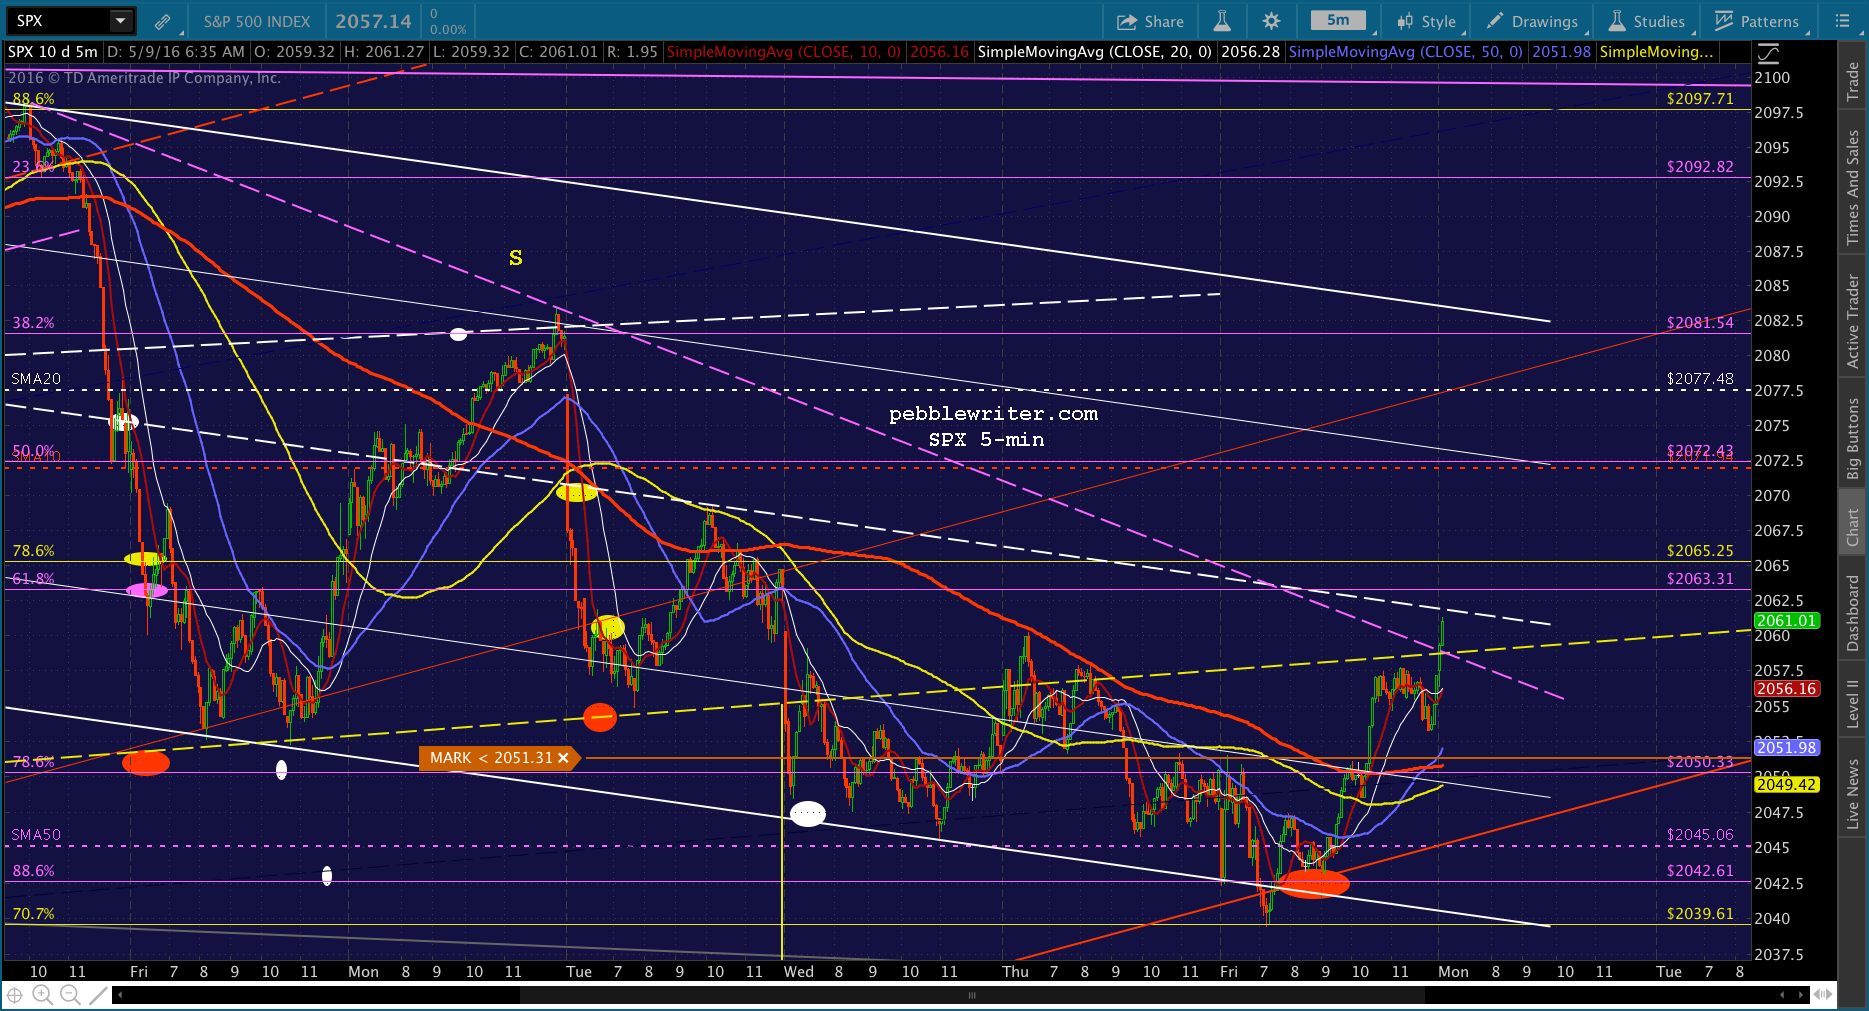 White USDJPY could continue to rally, CL appears to not be finished falling.
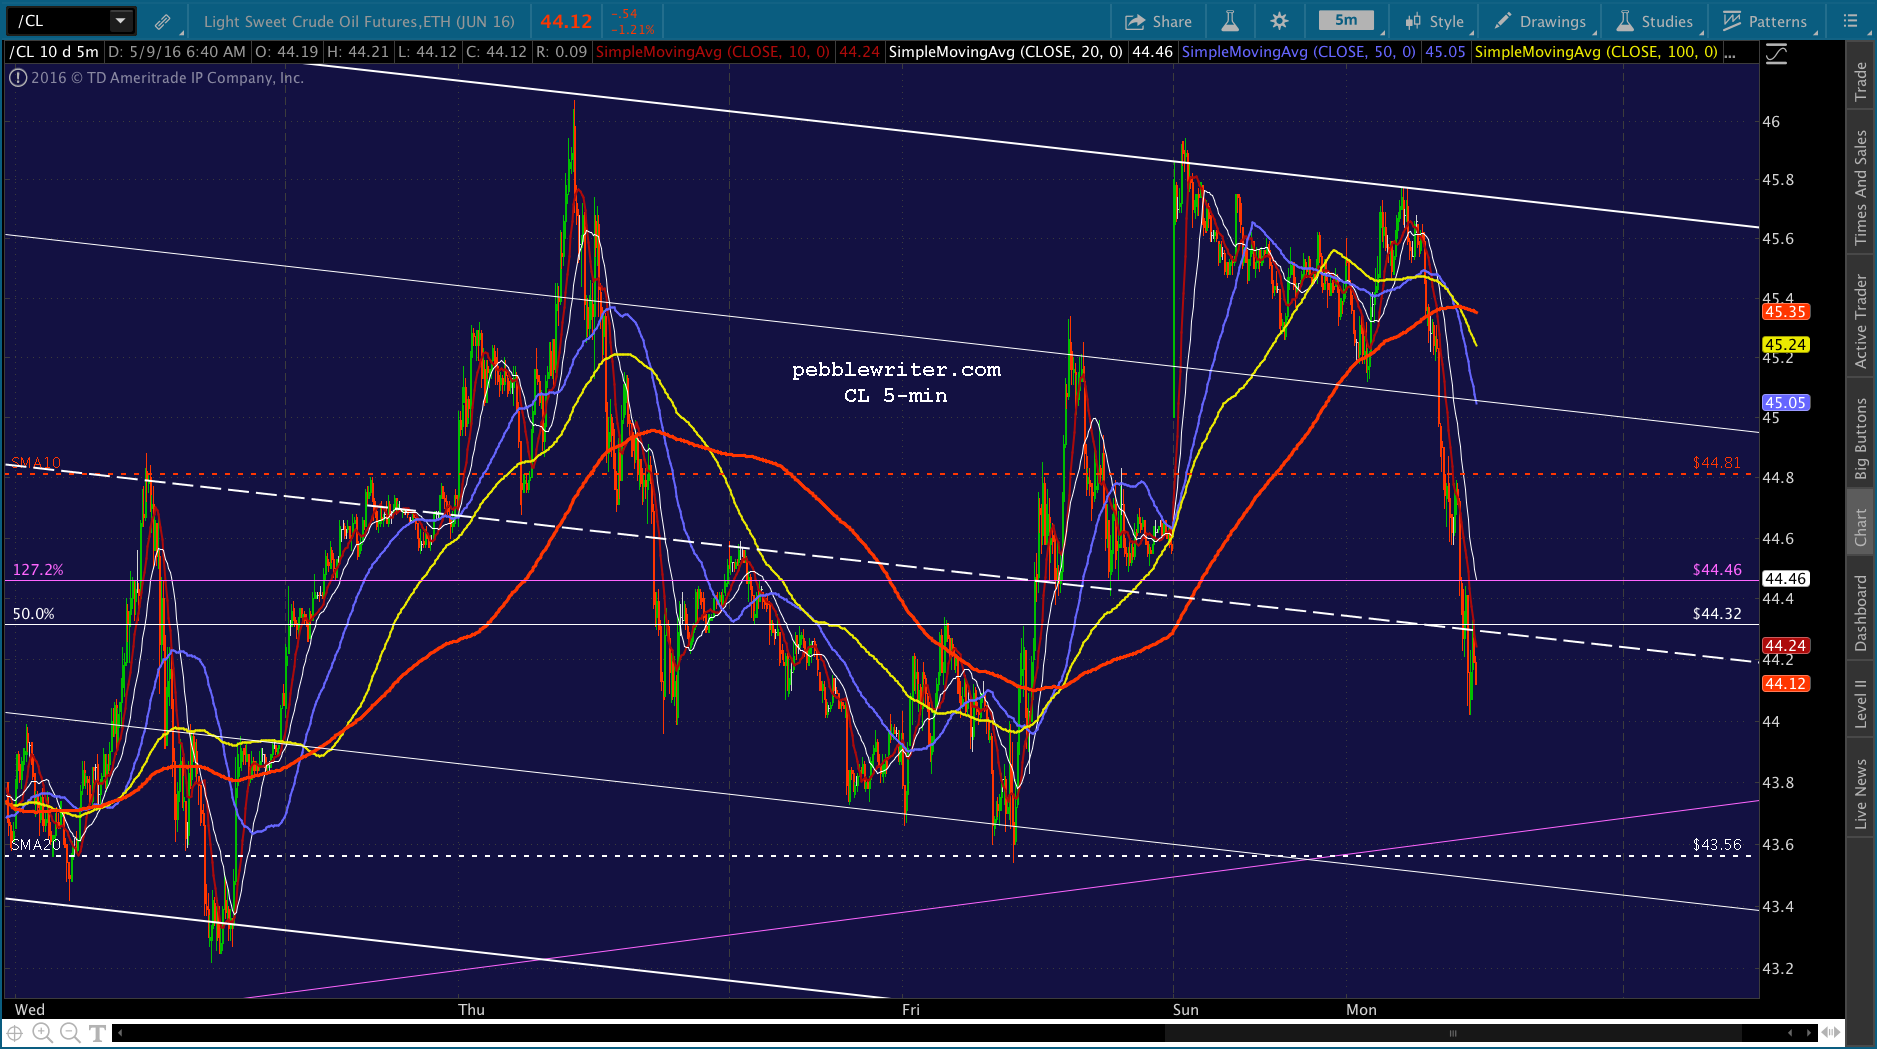
 UPDATE: 10:00 AM
At the moment, it appears SPX wants to put in a backtest on the yellow neckline before taking off. But, USDJPY has gone parabolic. So, it’s not all that clear which way the winds are blowing. Shortly, SPX’s SMA5 10 will catch up with it and potentially provide support. Will it be enough to counteract USDJPY if it reverses at the white channel top? Unclear.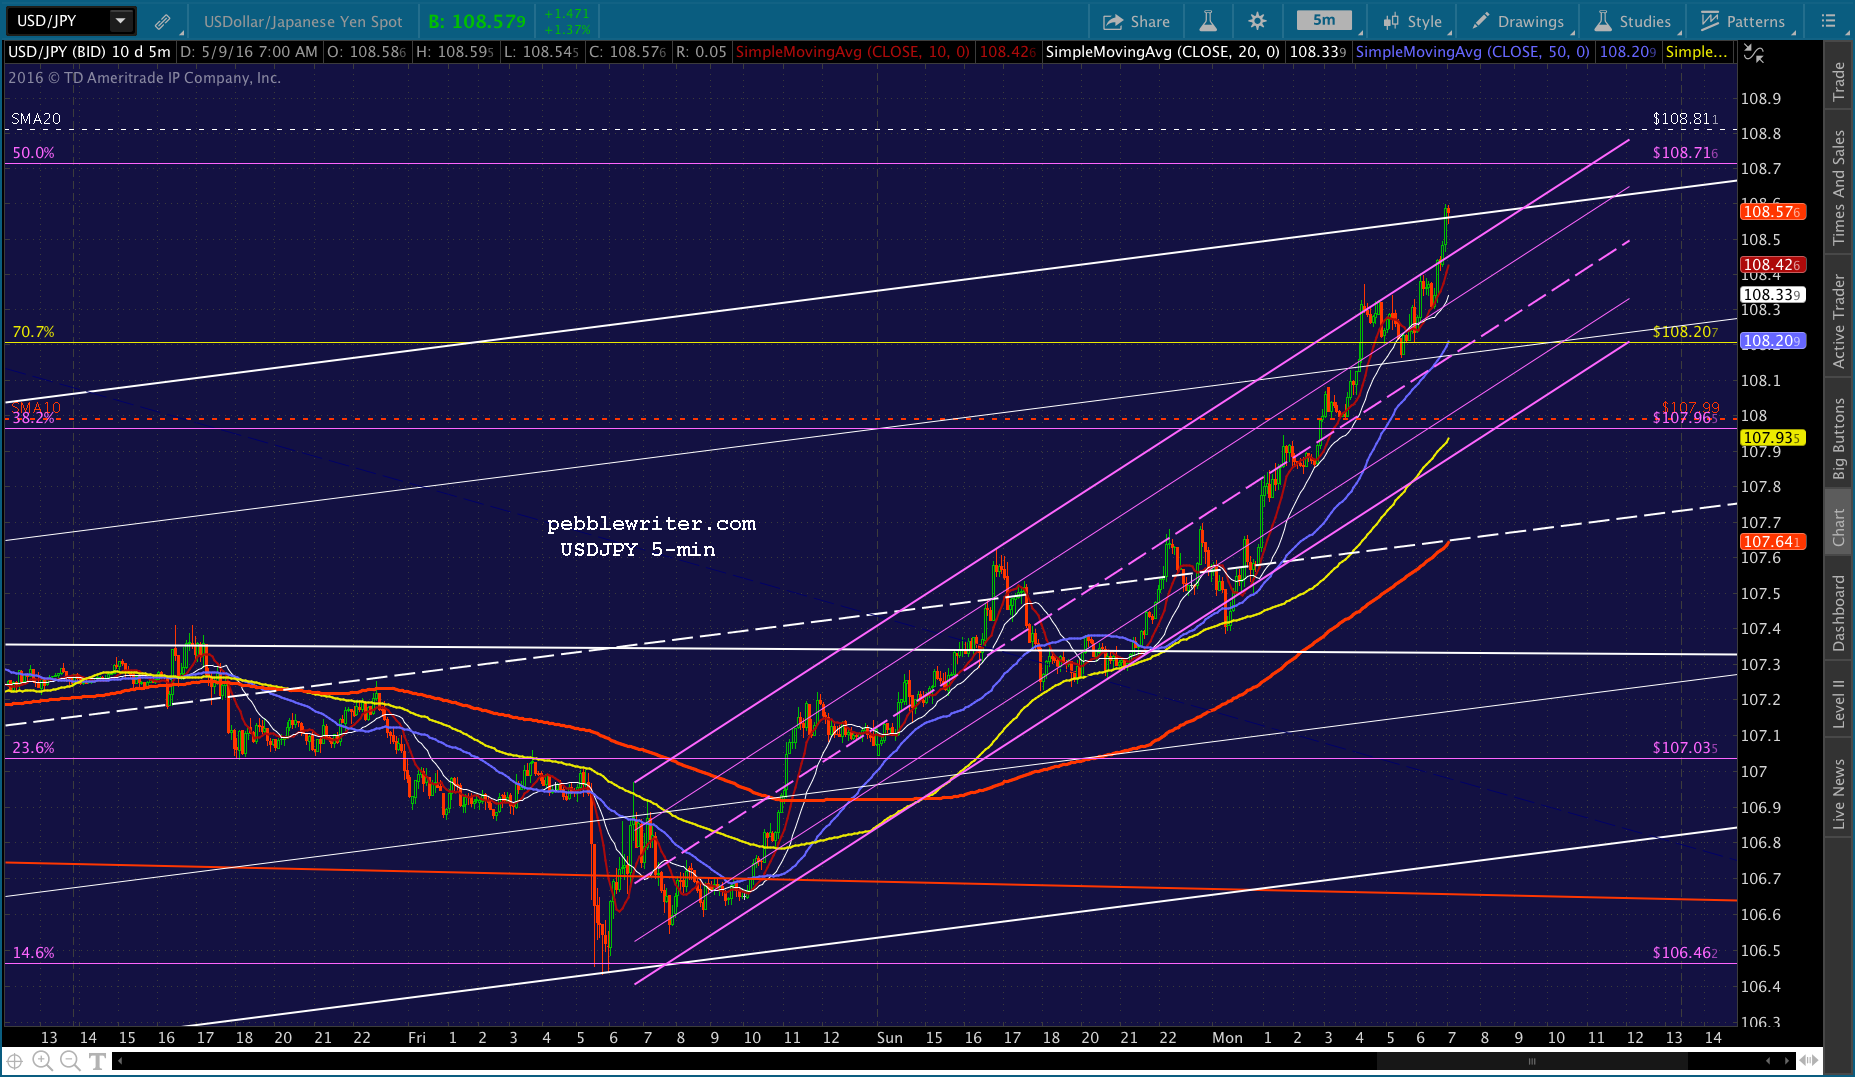
 UPDATE: 10:16 AM
SPX is backtesting the white channel midline as the SMA5 10 arrives. This is theoretically better support for a long position, however CL is dropping and VIX is rising. So, I imagine they’re going to backtest the yellow H&S neckline as mentioned above. It’s at about 2059. UPDATE: 10:30 AM
SPX is dropping through the red channel bottom. It looks like it has more downside potential, but could easily bounce here. We’ll see if it firms up. Note that it’s back below the neckline. UPDATE: 10:36 AM
USDJPY and CL are looking negative now, and SPX and ES are both back to flat and below their necklines.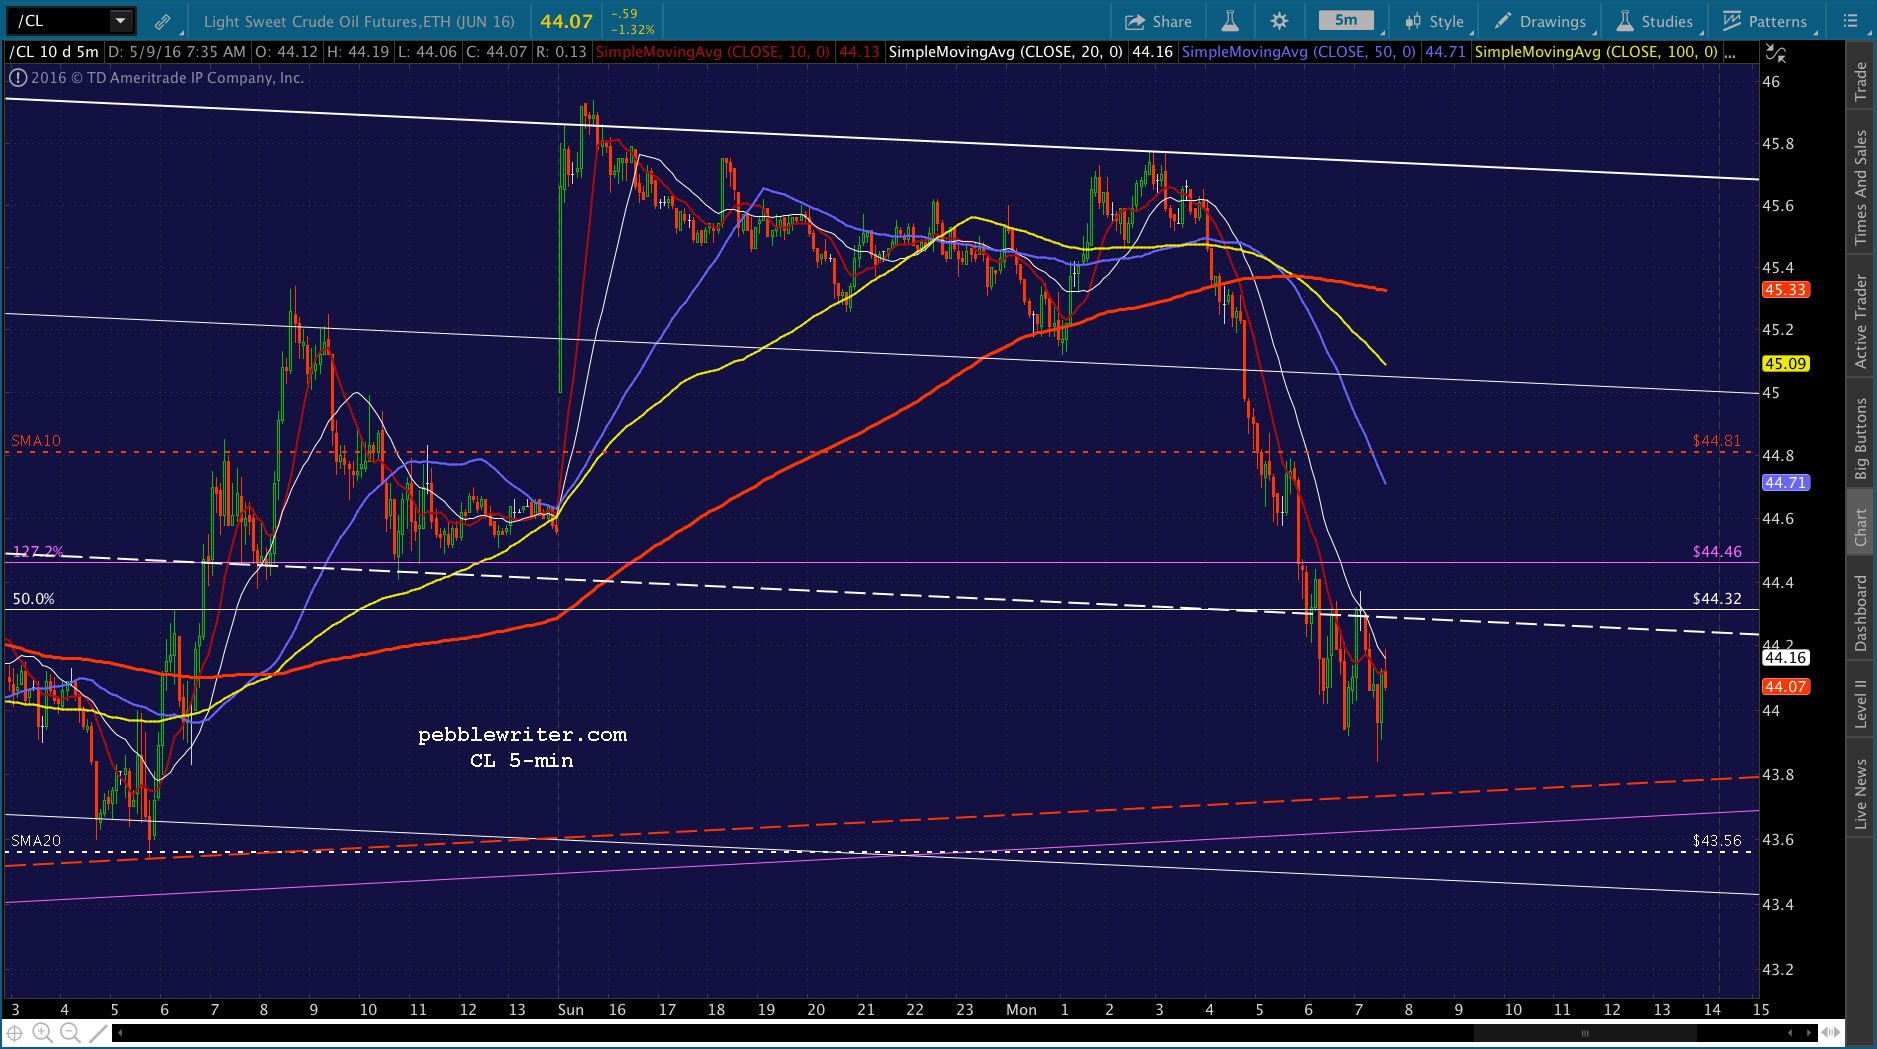
 I’d go short, and see if we can’t make progress down toward the white channel .236 line at 2048.50. Watch for potential support at the SMA5 10, coming up at around 2052. And, the SMA50 is at 2045.06 — just below the red channel bottom at about 2046.20.
 The biggest threat to a drop here is CL. If it reaches a TL connecting the past two lows and bounces, then we’re not likely to see any downside at all.
UPDATE: 11:46 AM
SPX is easing back above the purple TL, thanks to USDJPY, CL and VIX. Yet, both it and SPX remain below their necklines. I assume this is a stalling bounce rather than one intended to produce new highs. 

 UPDATE: 1:09 PM
That’s about as much slack as I care to give it. Back to cash here on the move through the neckline and white midline. Though, I’d gladly switch back if the thrust fails.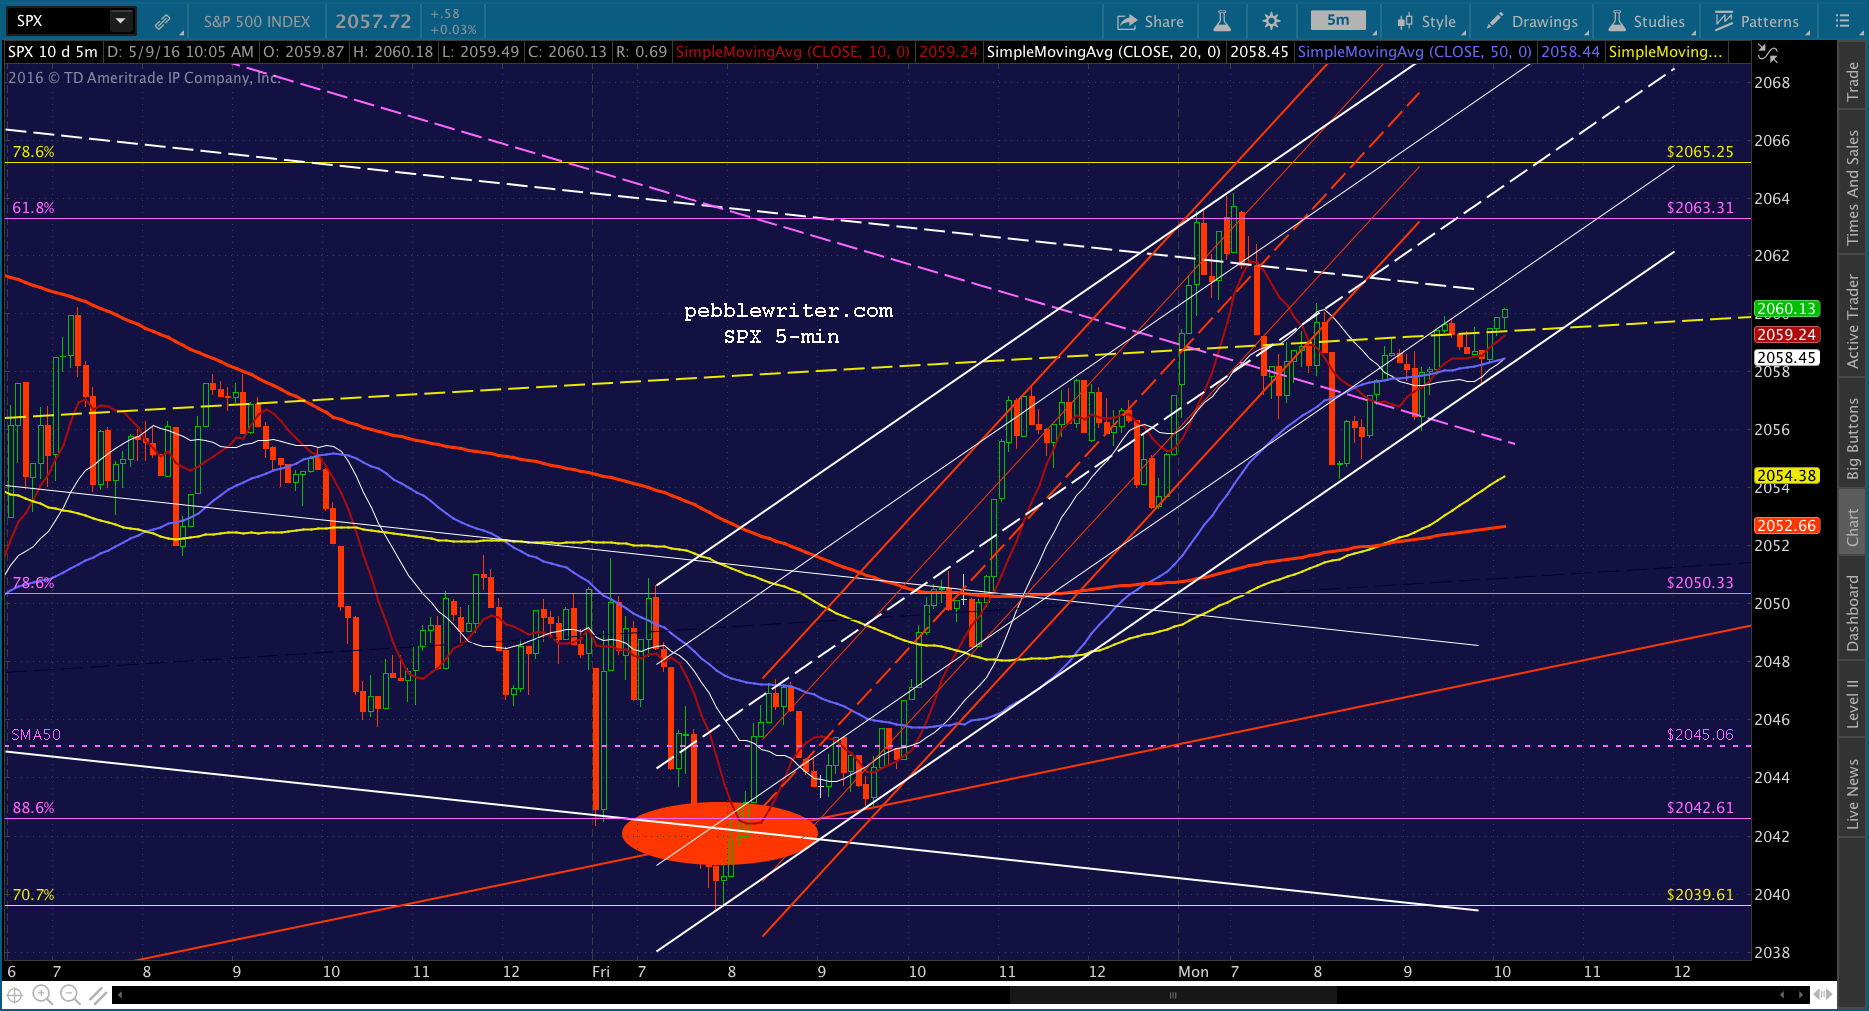
 UPDATE: 1:52 PM
SPX has essentially gone nowhere since this morning’s highs. CL, in the meantime, looks like it’s ready to go lower, and NKD has broken down a bit again. But, the most bearish development, and indicating a possible turning point, is that VIX has almost reached channel support. If it should bounce, then we’ll get that next lower leg down. And, if not, then SPX should get a nice boost. I’ll try a short position here with tight stops.

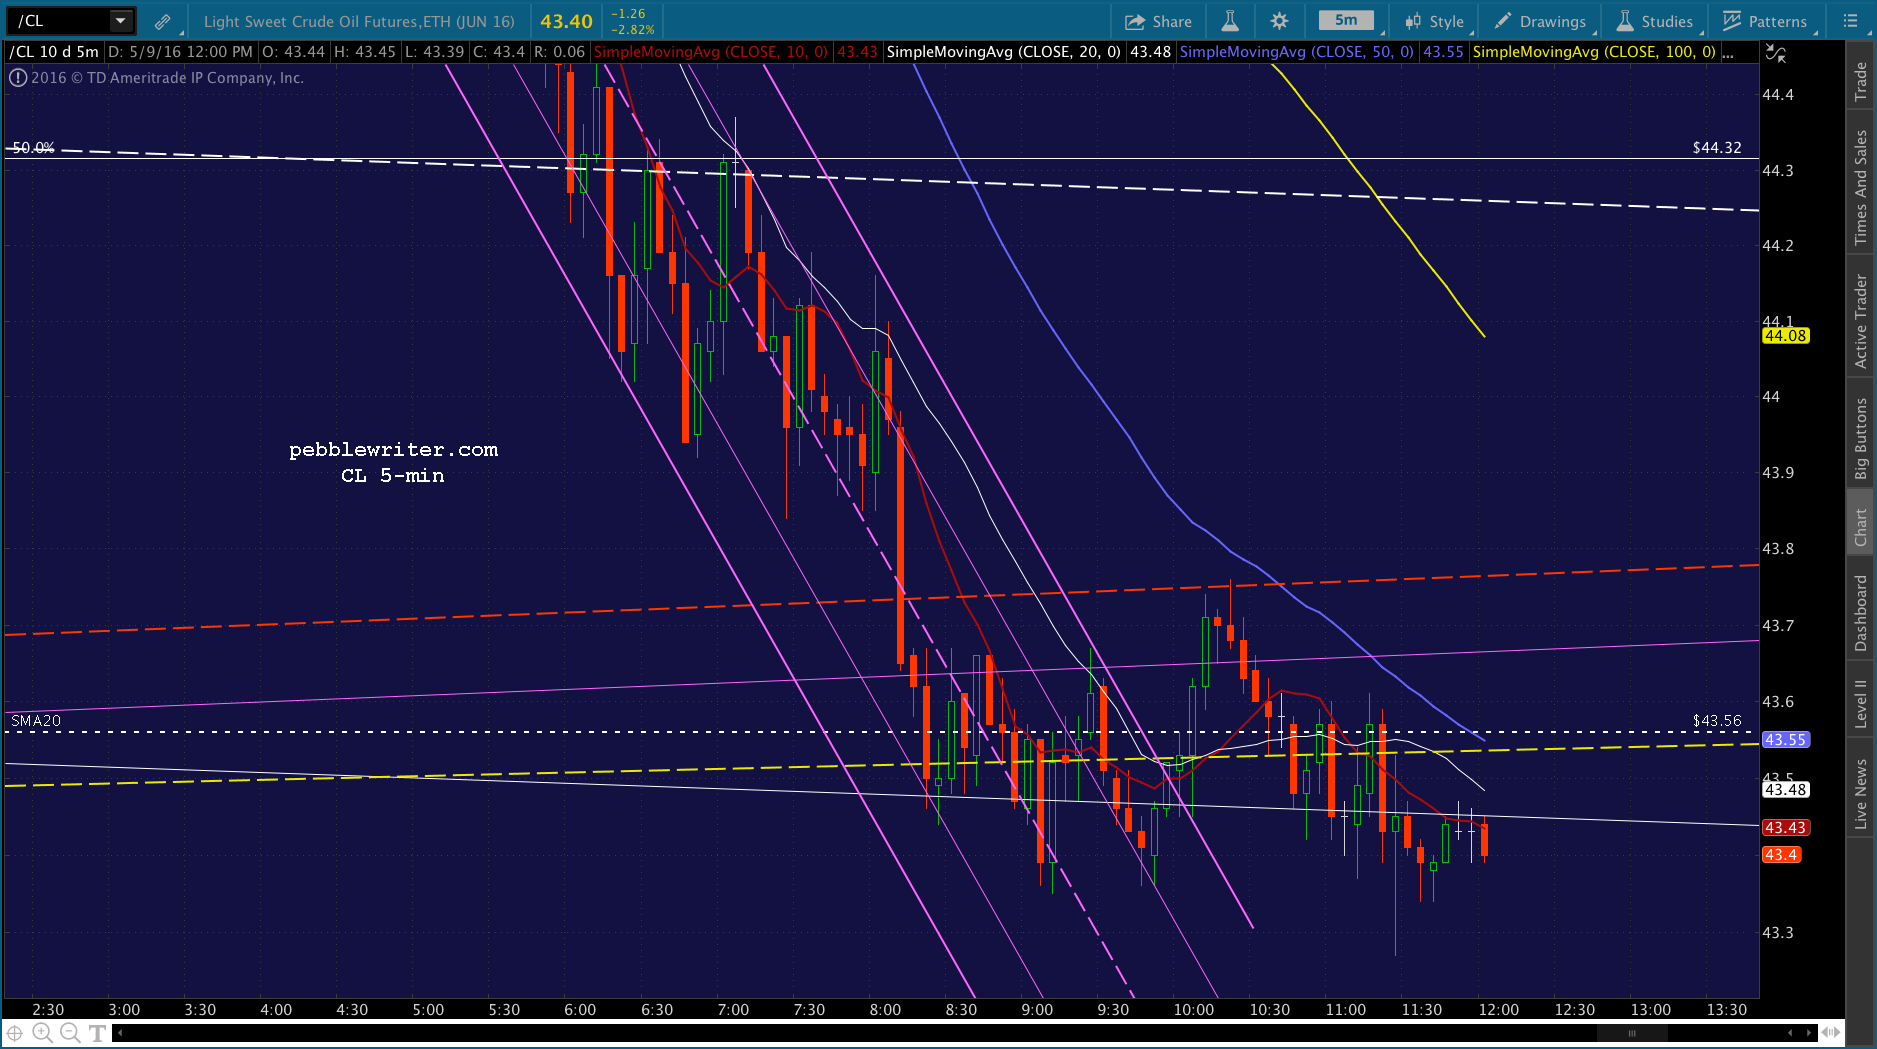
 The question was asked below about a possible H&S for CL. There is definitely a completed pattern in place. I have hesitated to discuss it because it is one of many that have completed over the past 3 months – most of which never came close to playing out.
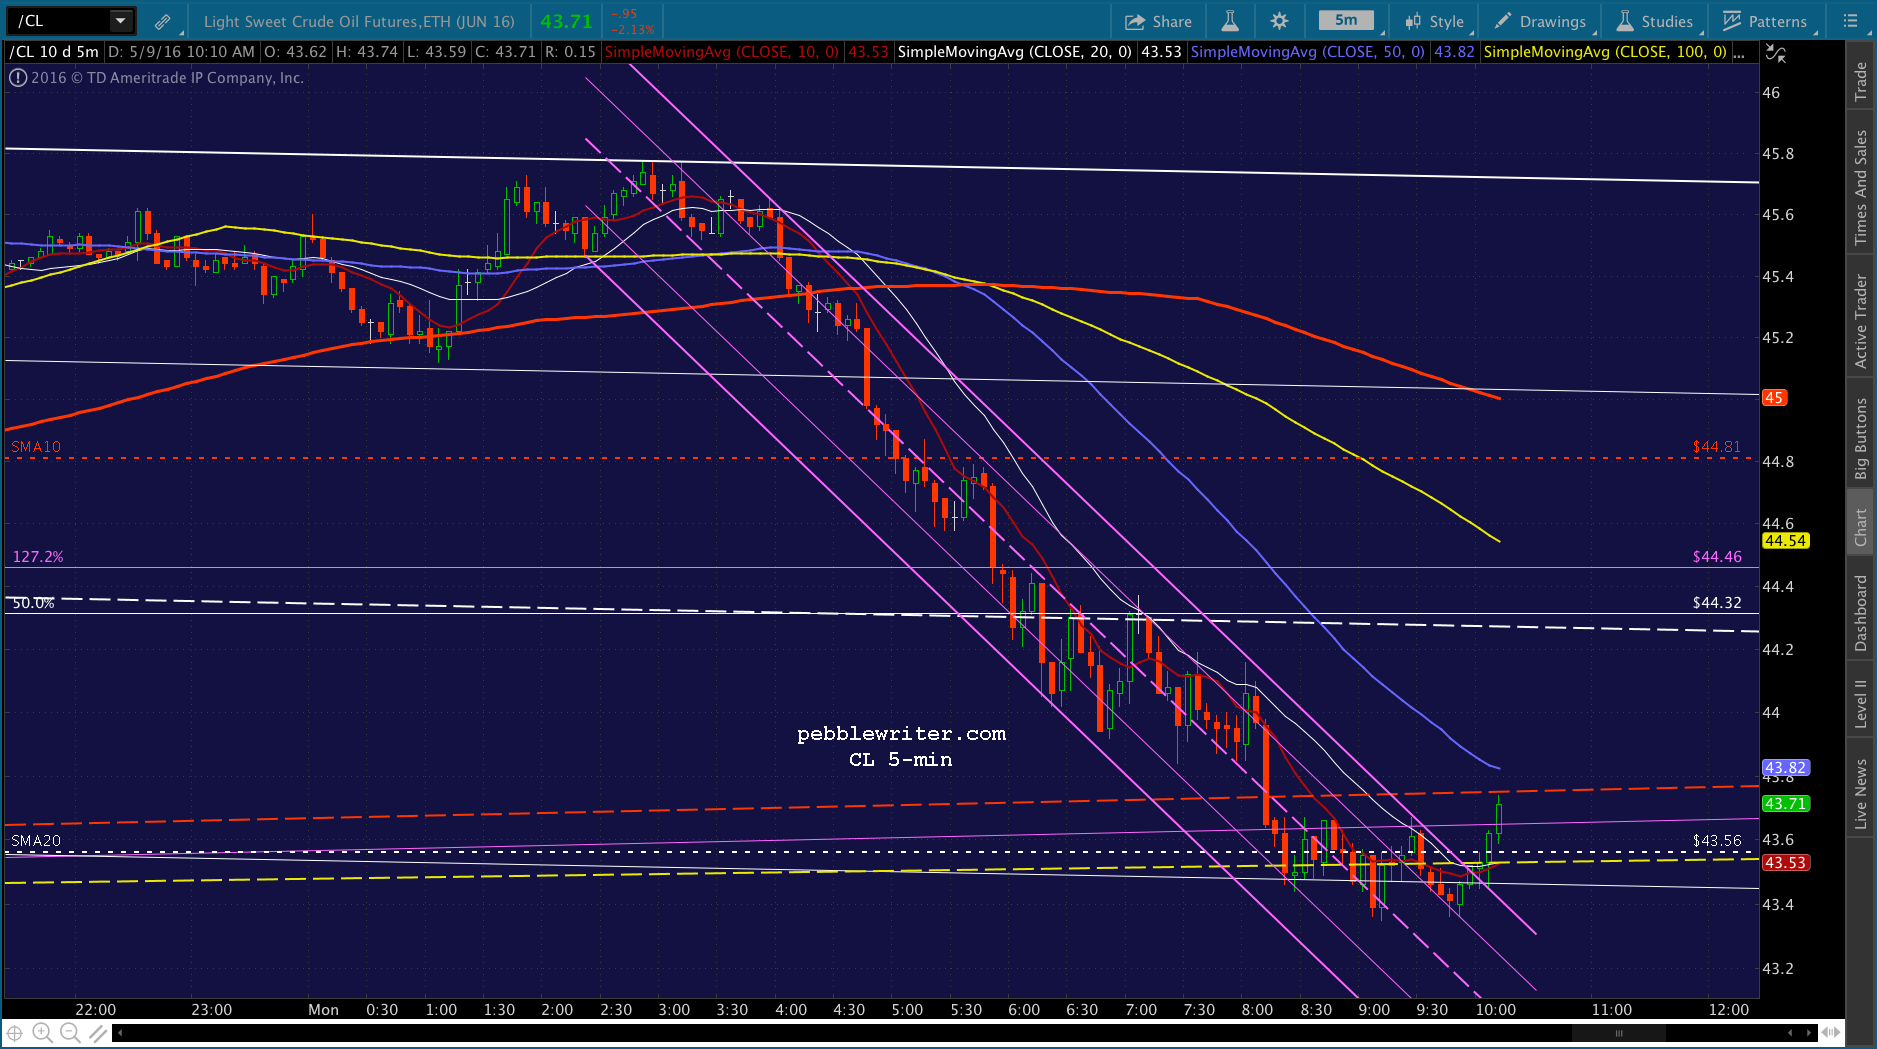
This one could be different, of course. At some point, you’d think there would be an outcry over rapidly increasing gasoline prices. FWIW, it’s shown in yellow below.
 To play out, we’d look for a daily close below the yellow neckline, currently about 43.53. Note that CL has been dancing around that level for several hours — with over half of the 5-min bars since 11:20 AM either touching or straddling that value.
UPDATE: 2:50 PM
Instead of bouncing at the channel bottom, VIX dropped through it (though it is close enough to the purple .618 to deserve a bounce.) Not on is CL not dropping to offset it, but NKD just gapped higher to help fuel it. Back to cash here.

 UPDATE: 3:00 PM
Probably a total waste of time, but I like the idea of the SMA5 200 intersection with the purple TL at 2053.25ish. Back to short here.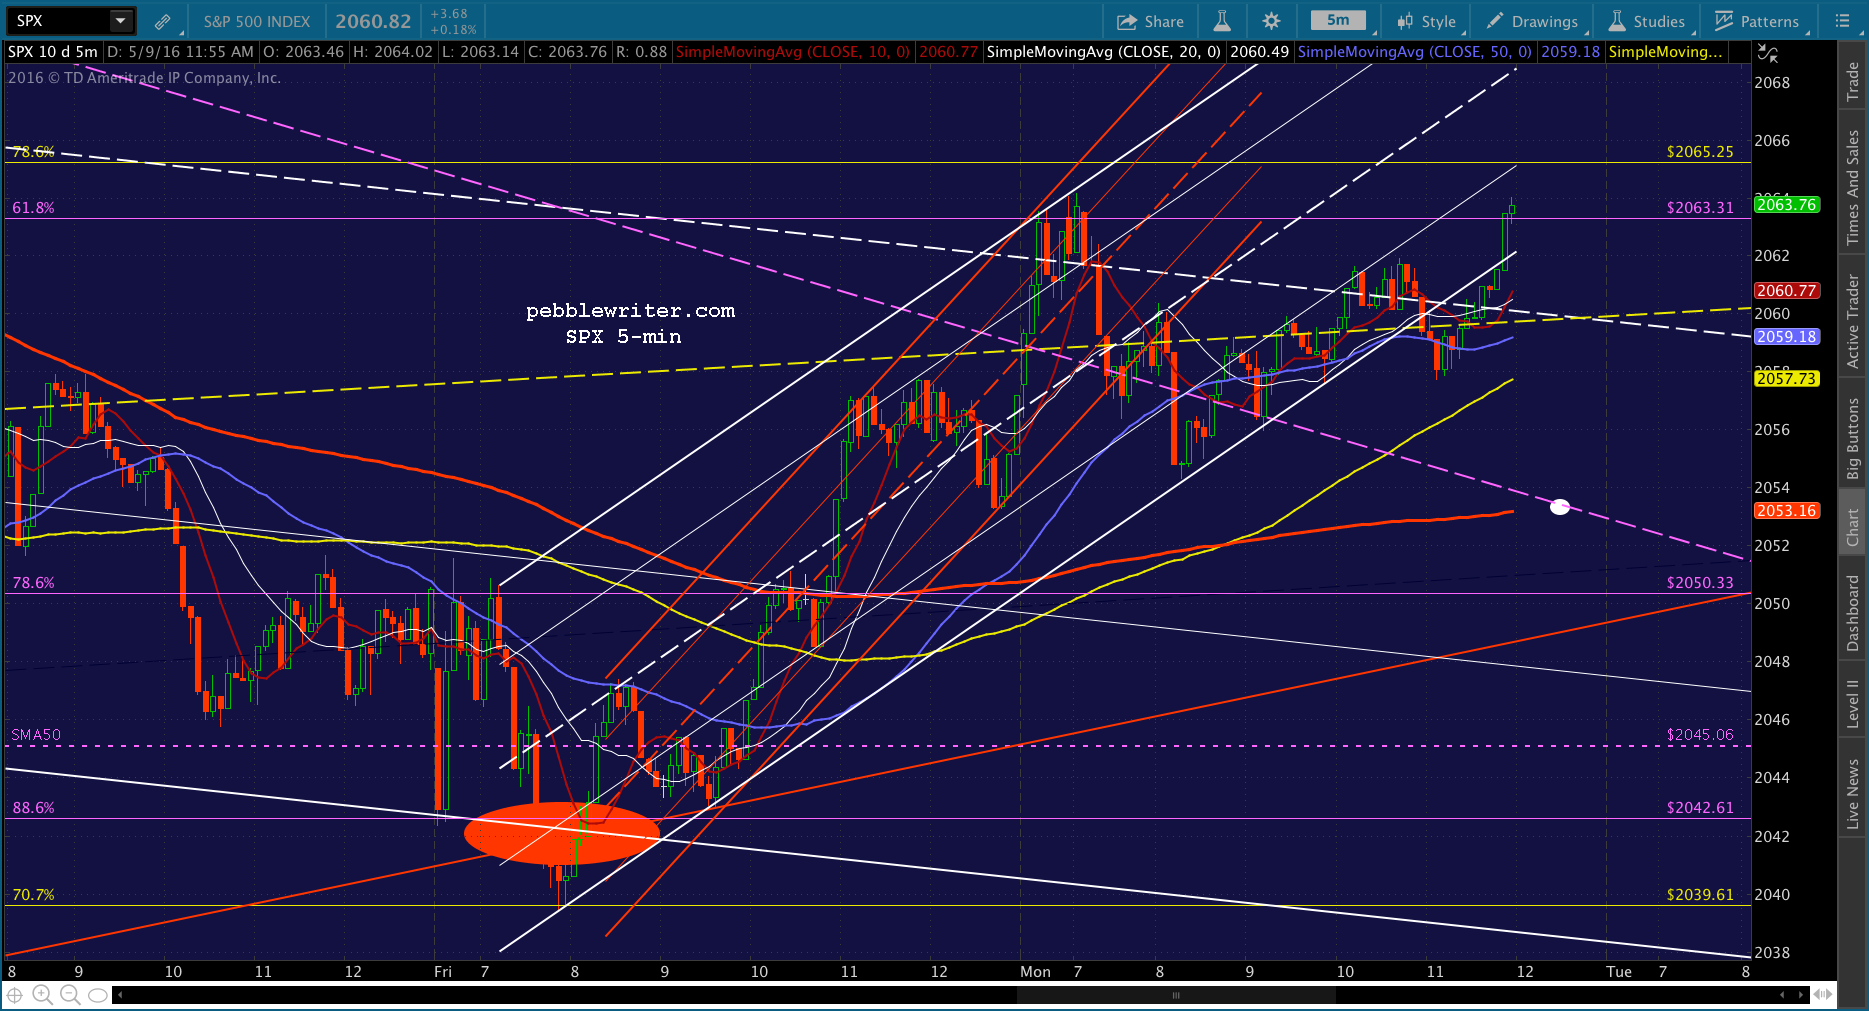


 UPDATE: 3:58 PM
SPX back below all support we’ve discussed except the SMA5 200. I’d cover it here, or hold overnight if you can hedge or monitor it closely.
Comments
One response to “Charts I’m Watching: May 9, 2016”
Is CL forming a H&S, since mid April?