

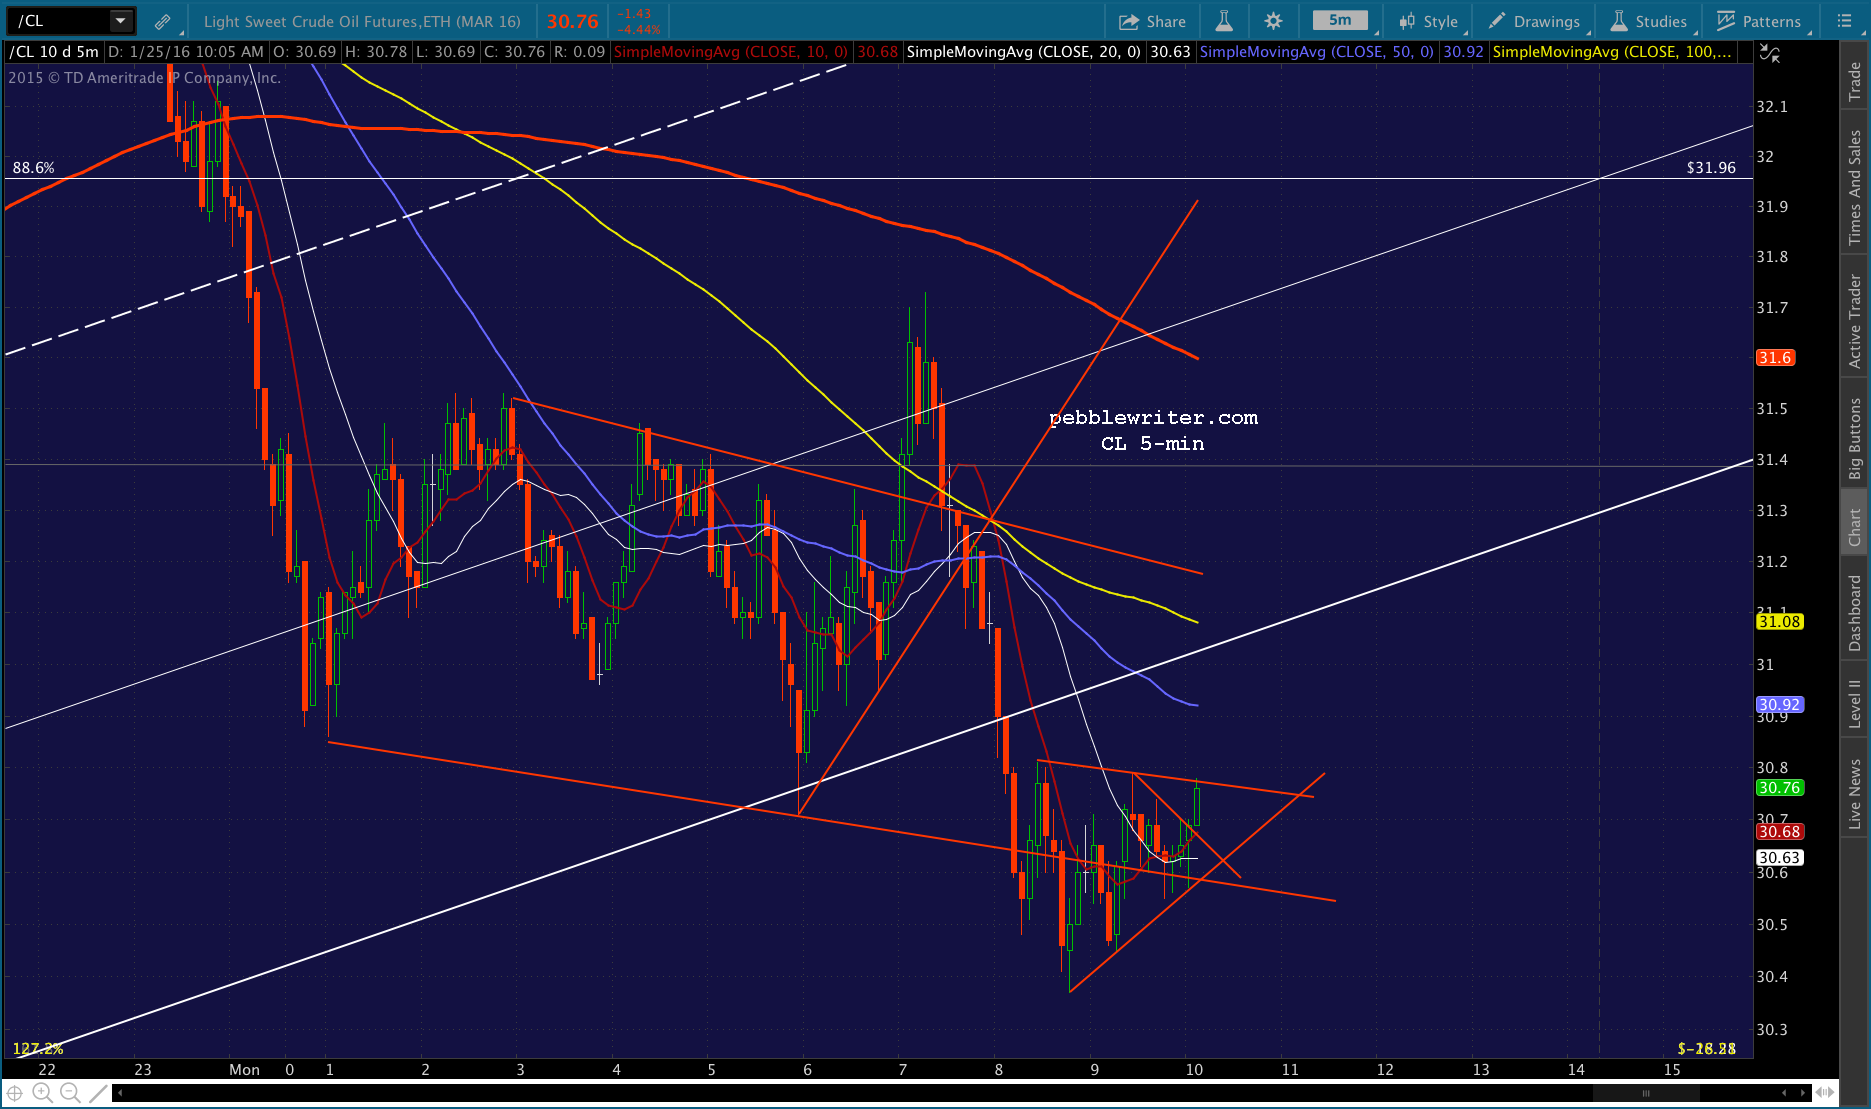
After Friday’s algofest, futures are currently off about 8 points. As usual, we’ll look to USDJPY and CL for clues as to today’s action. Note that there’s a new CL update out this morning that touches on the big picture. continued for members…Look for SPX to backtest at least the SMA10 at 1899.34. If that breaks, then the red channel midline at 1896 and the red neckline at 1880 are the next major levels of support.
 UPDATE: 9:36 AM
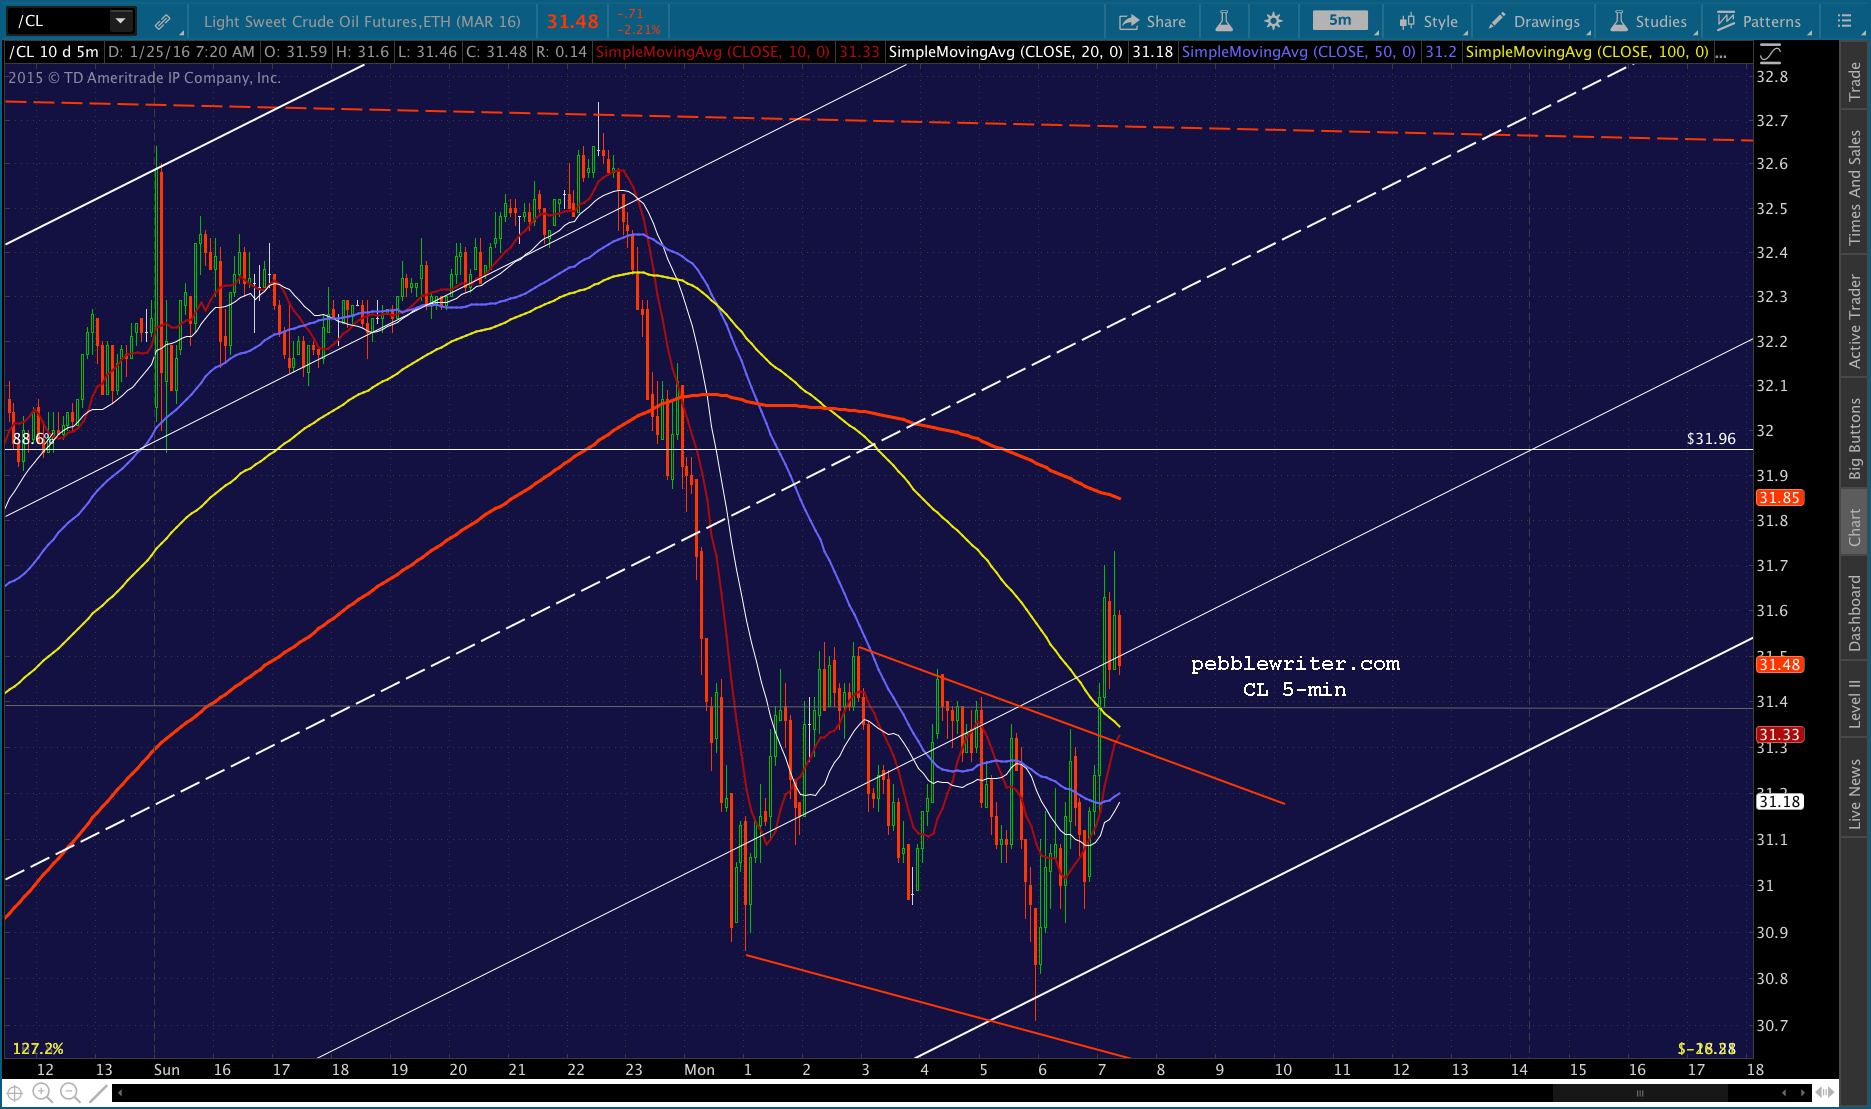
SPX just dropped through the SMA10 and below 1900 on USDJPY and CL weakness. Note that USDJPY is approaching channel support, while CL is leveling out at SMA support.
SPX’s SMA5 100 is coming up at 1895.18 and would make for a good short-term target at this time — contingent, of course, on USDJPY and CL holding their support. It could call it a backtest of the broken .886 at 1895.45 — which it worked so hard to hold on Friday.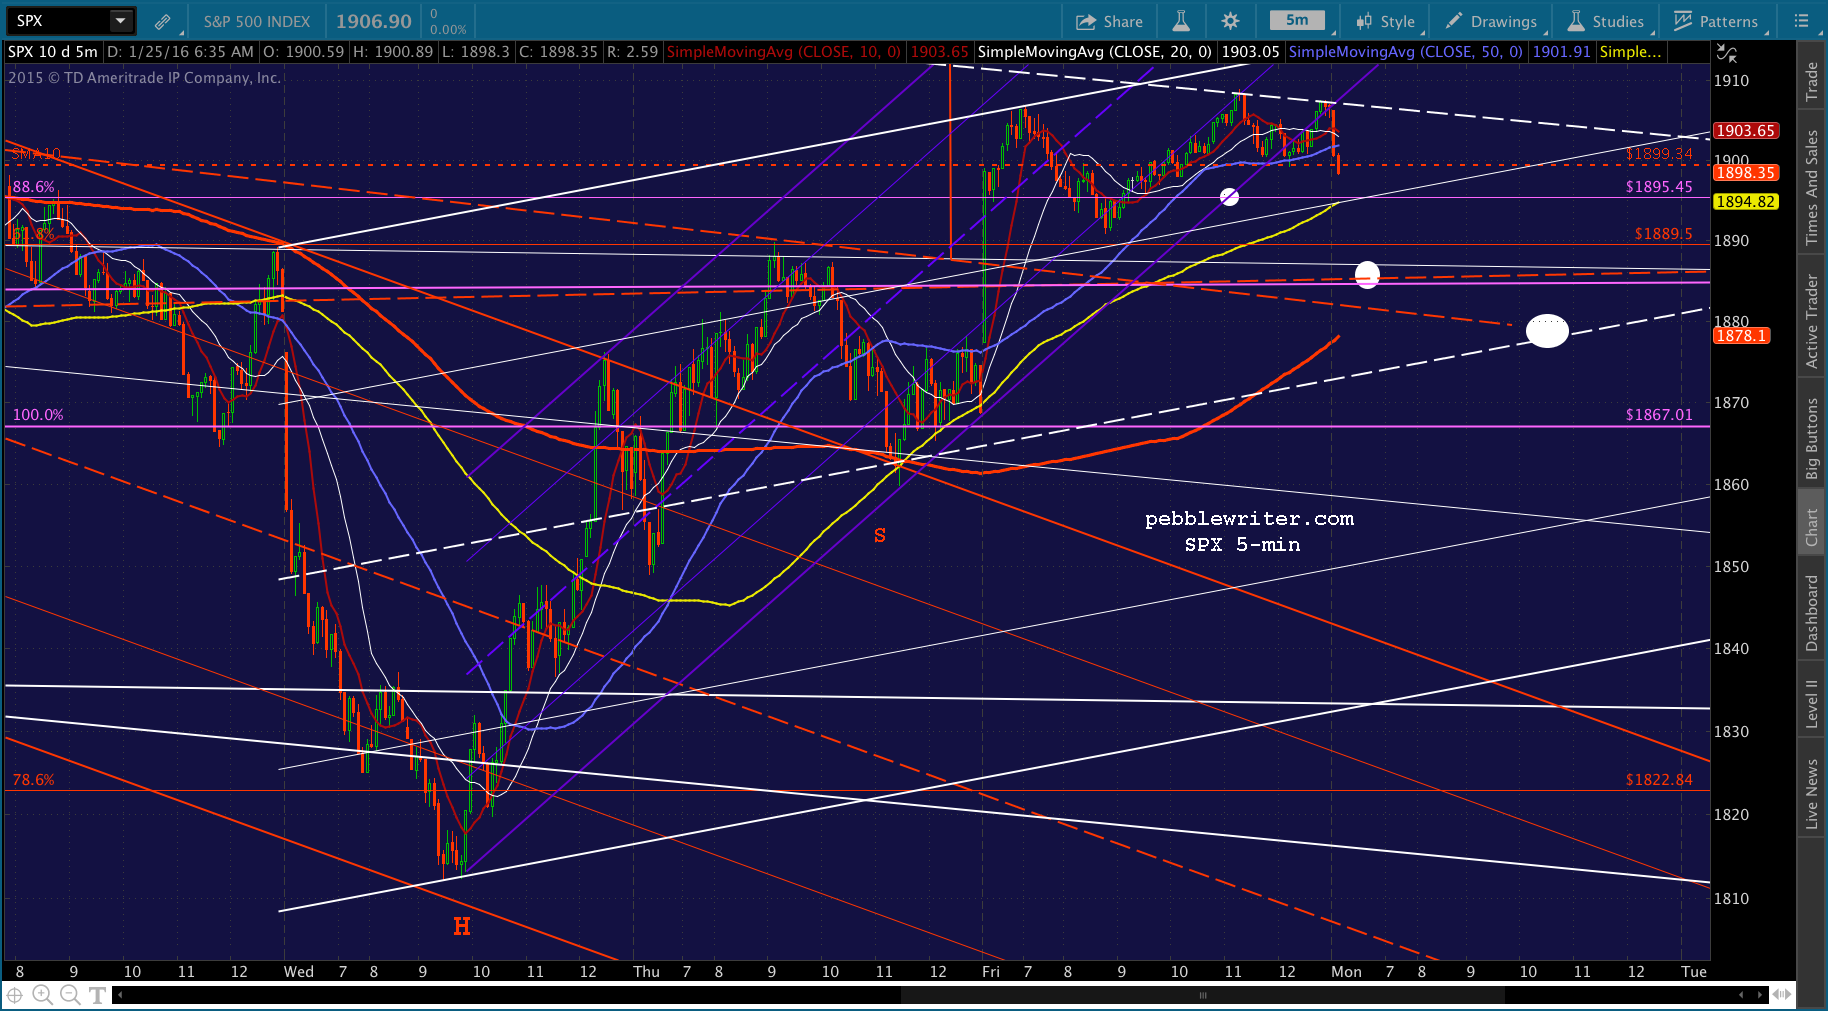

 UPDATE: 9:46 AM
SPX just tagged the SMA5 100 and .886. We should get a bounce here, so I’d switch to a long position here at 1894.93 with tight stops. The key, now, will be breaking above the falling SMAs up around 1900-1902. If this level falls, we’re looking at the next lower target at 1886.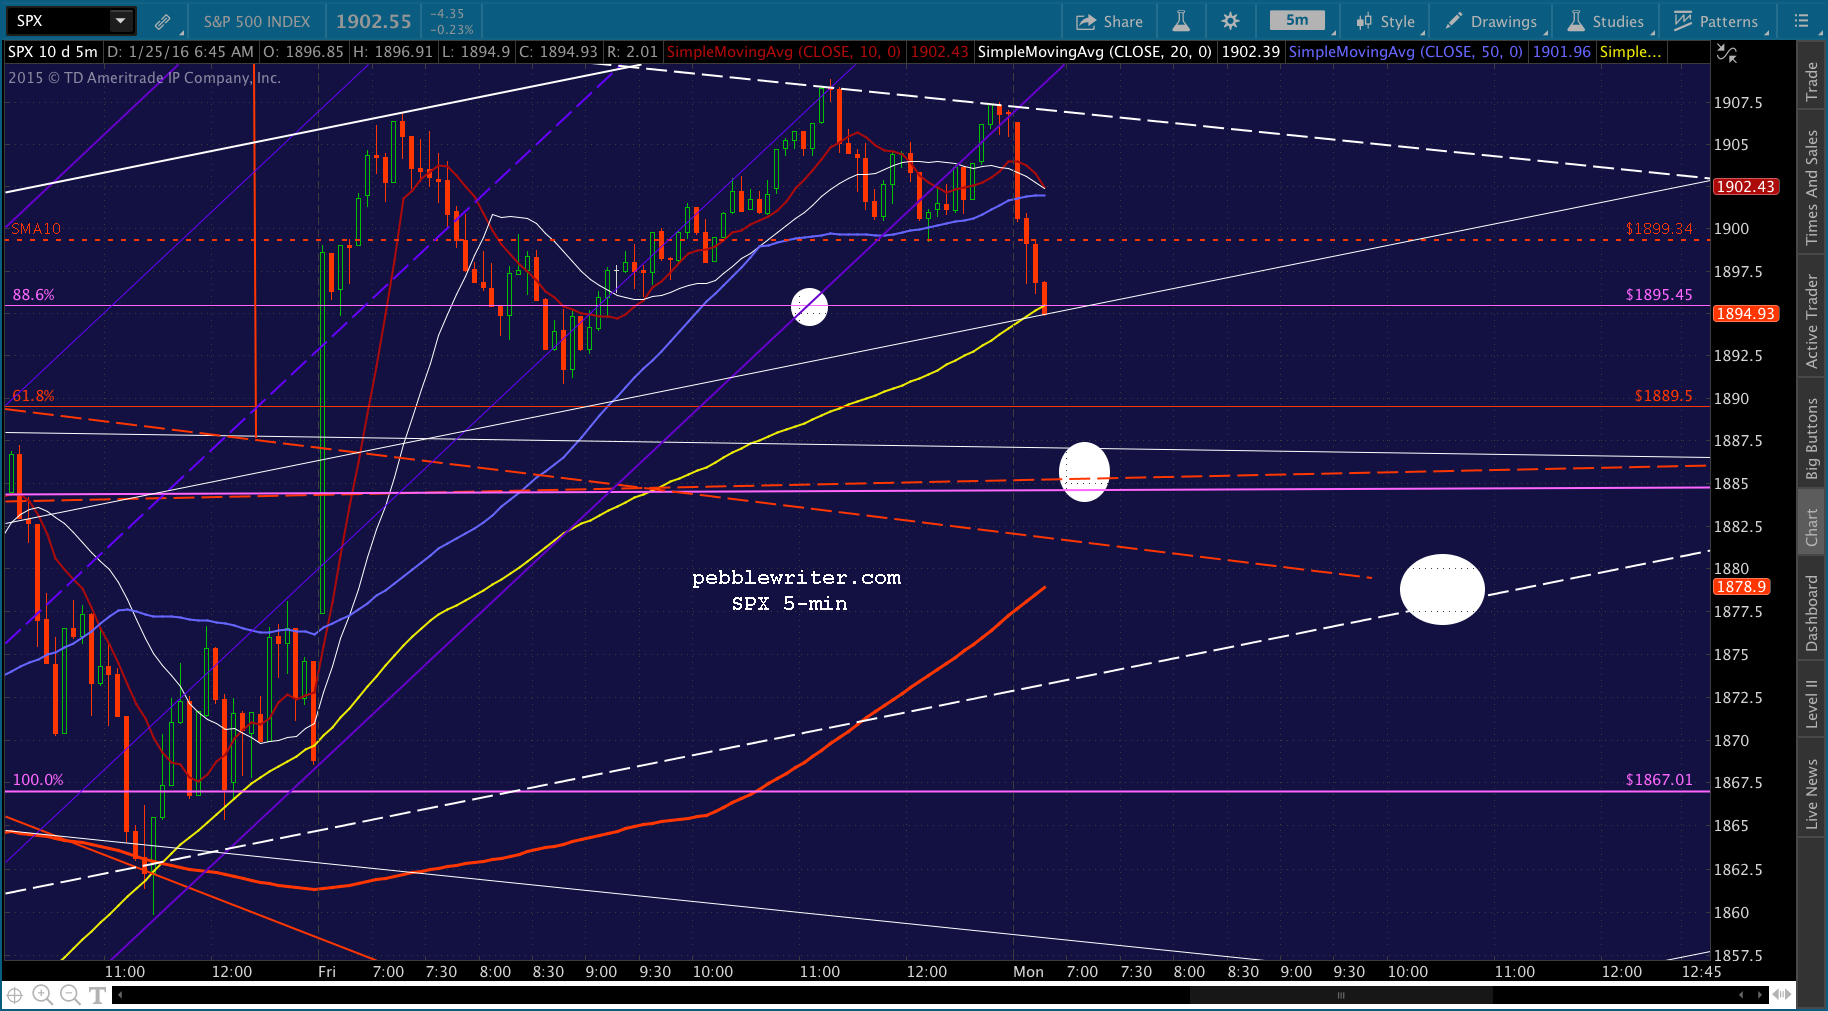 USDJPY is getting a bounce on the channel bottom…
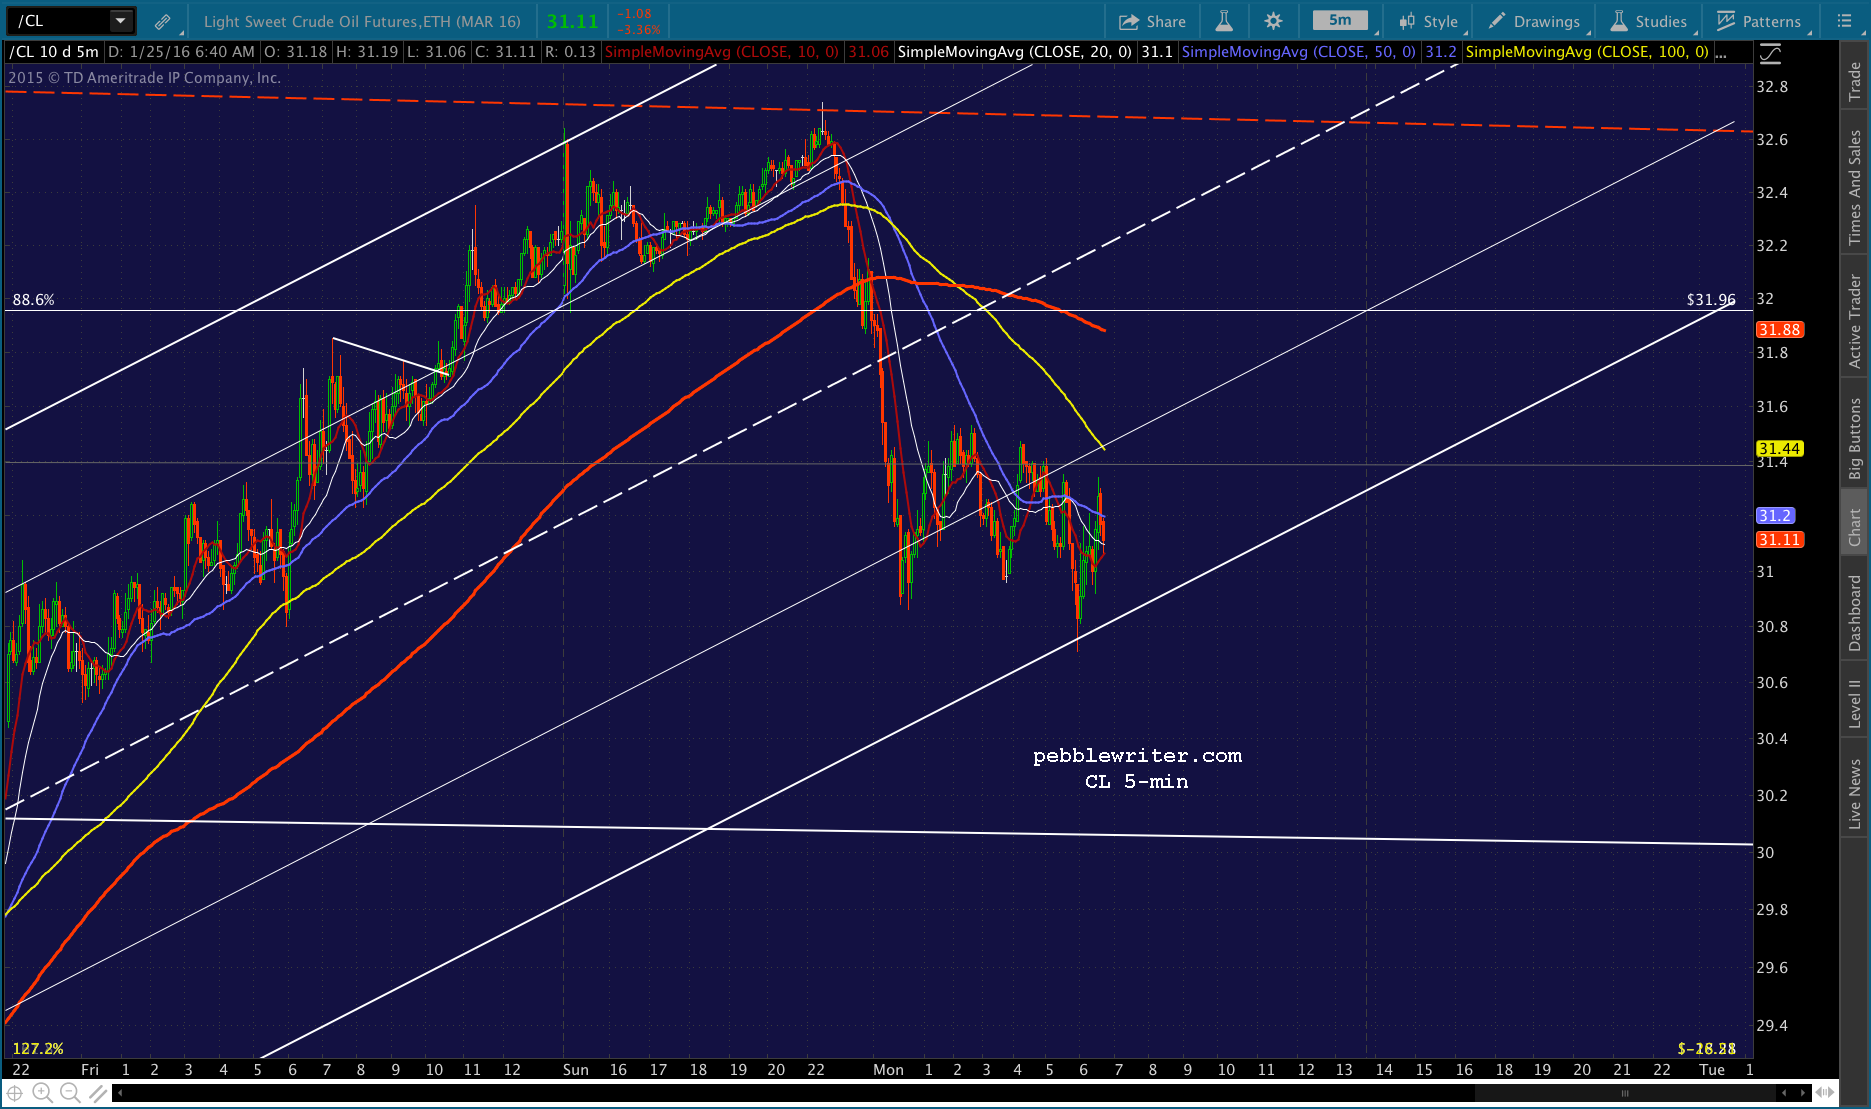
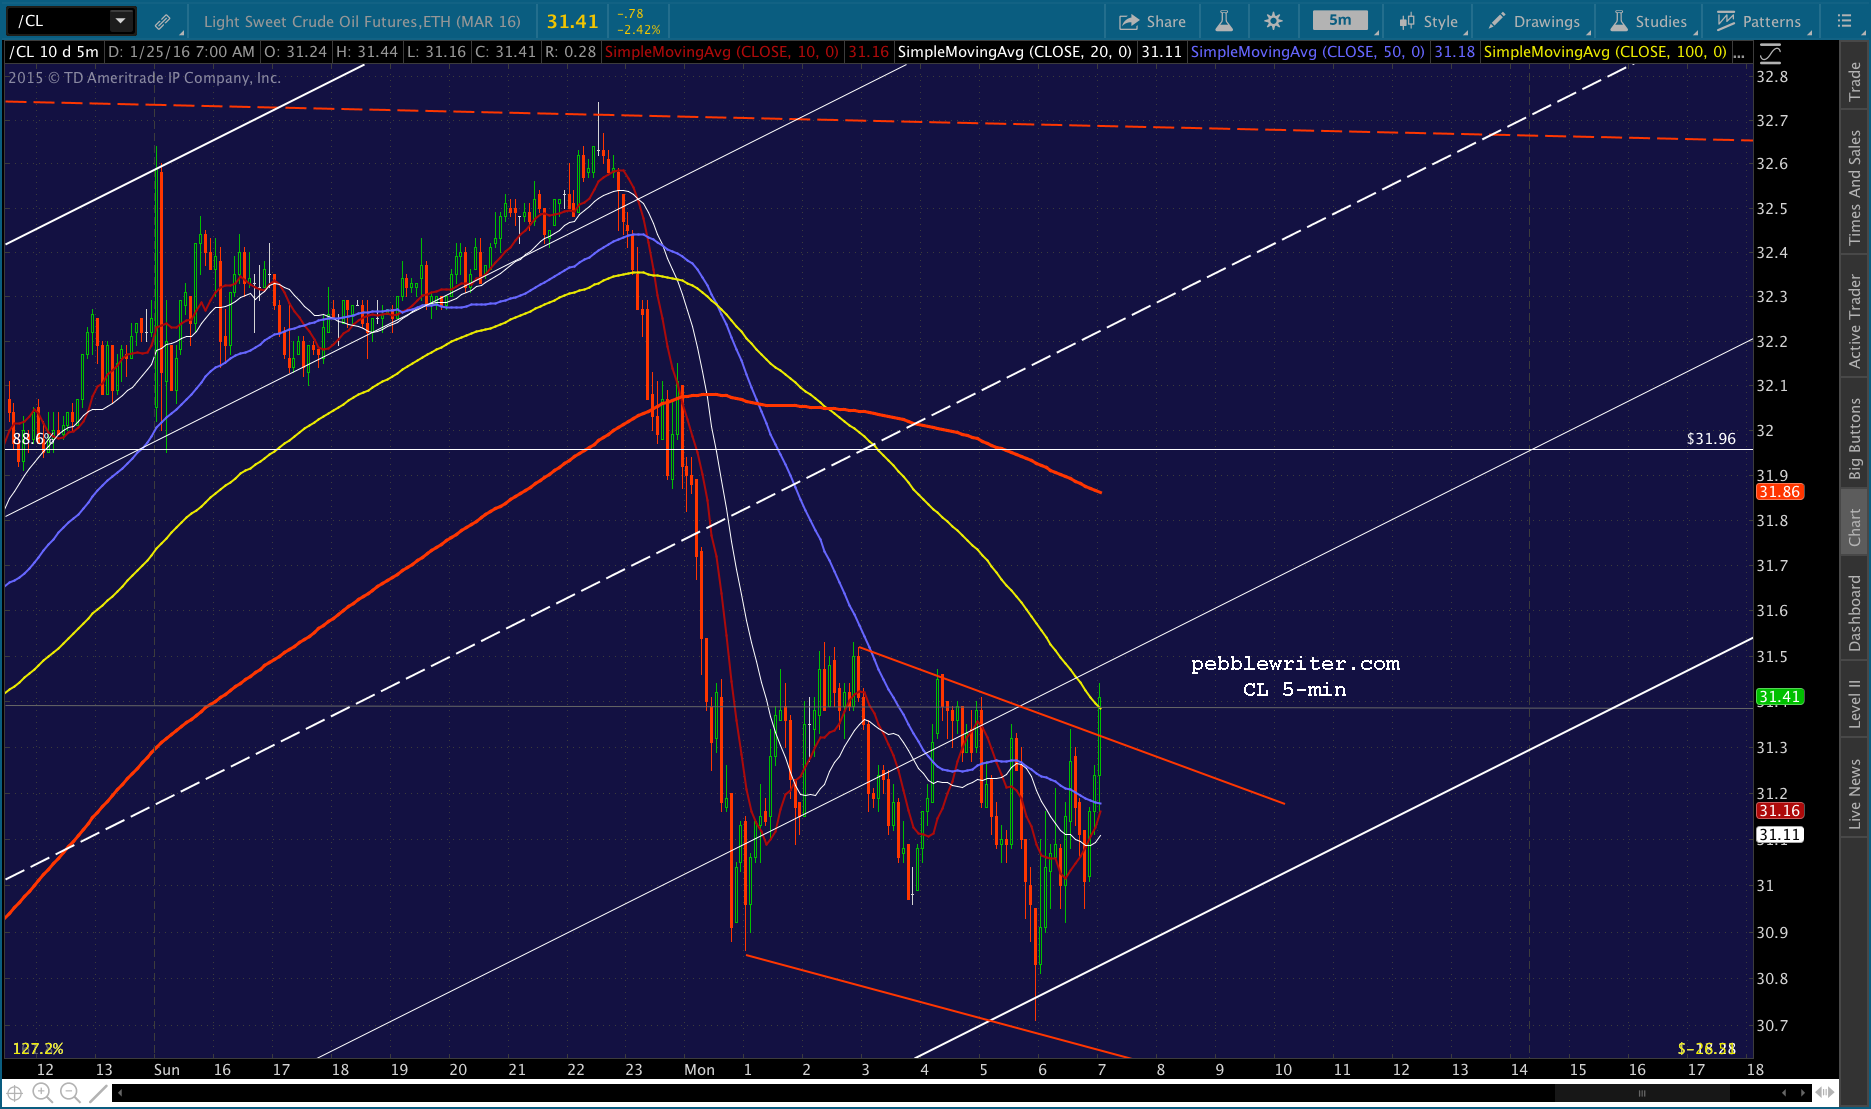
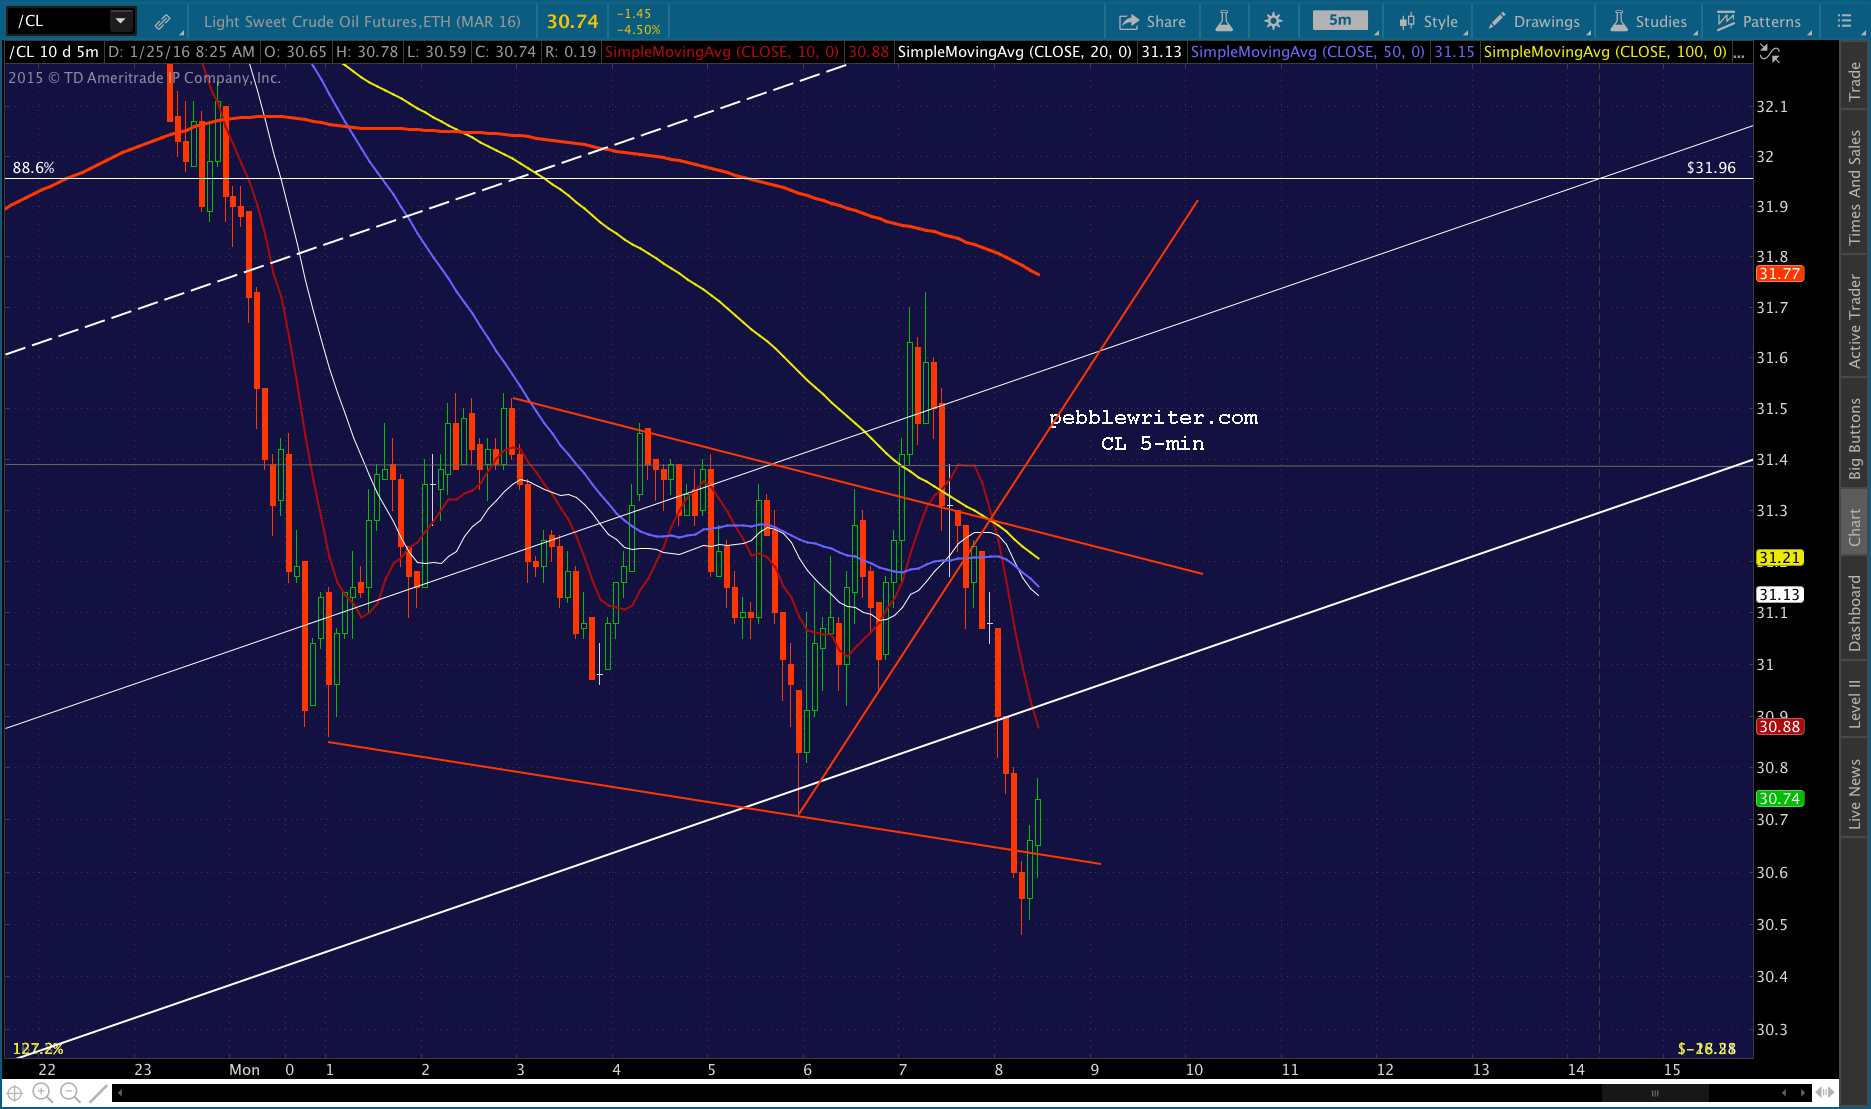
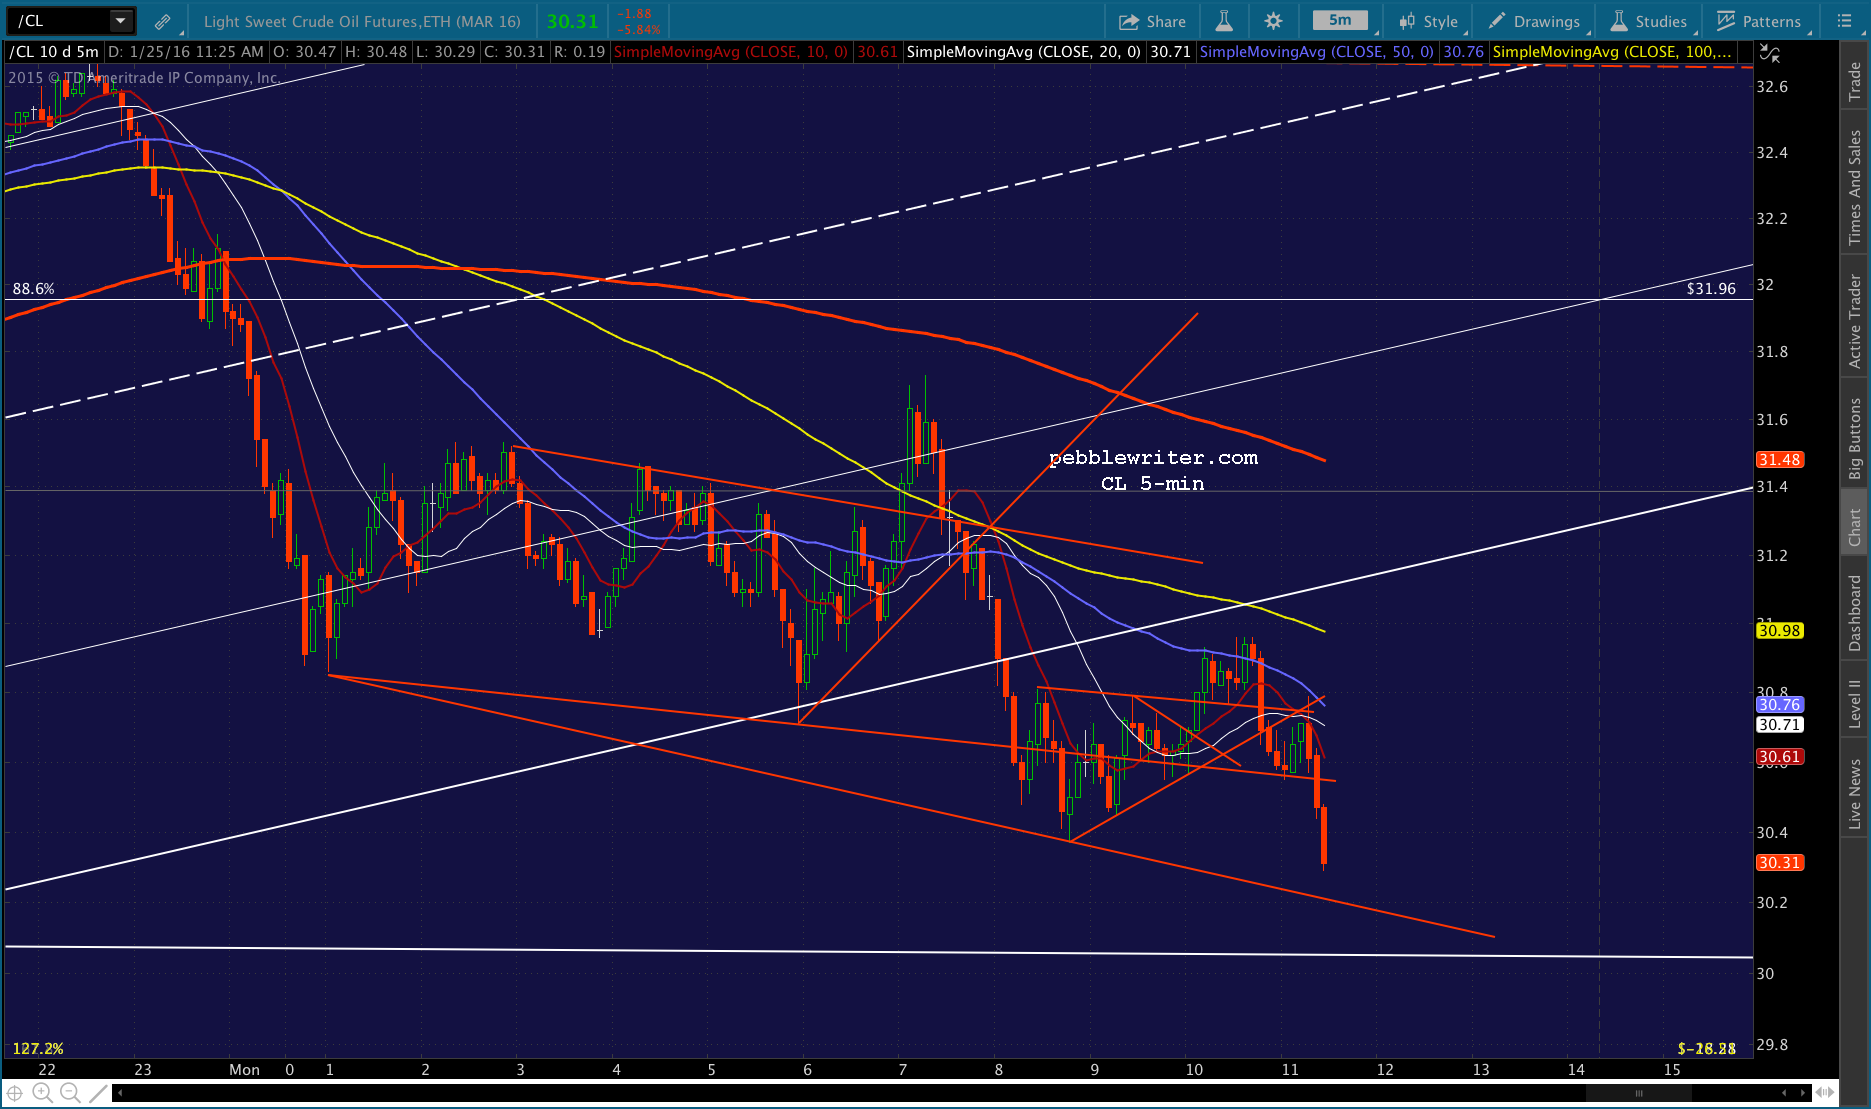
  …but, CL has a lot of SMAs to overcome, with the yellow SMA5 100 being the biggest resistance coming up.
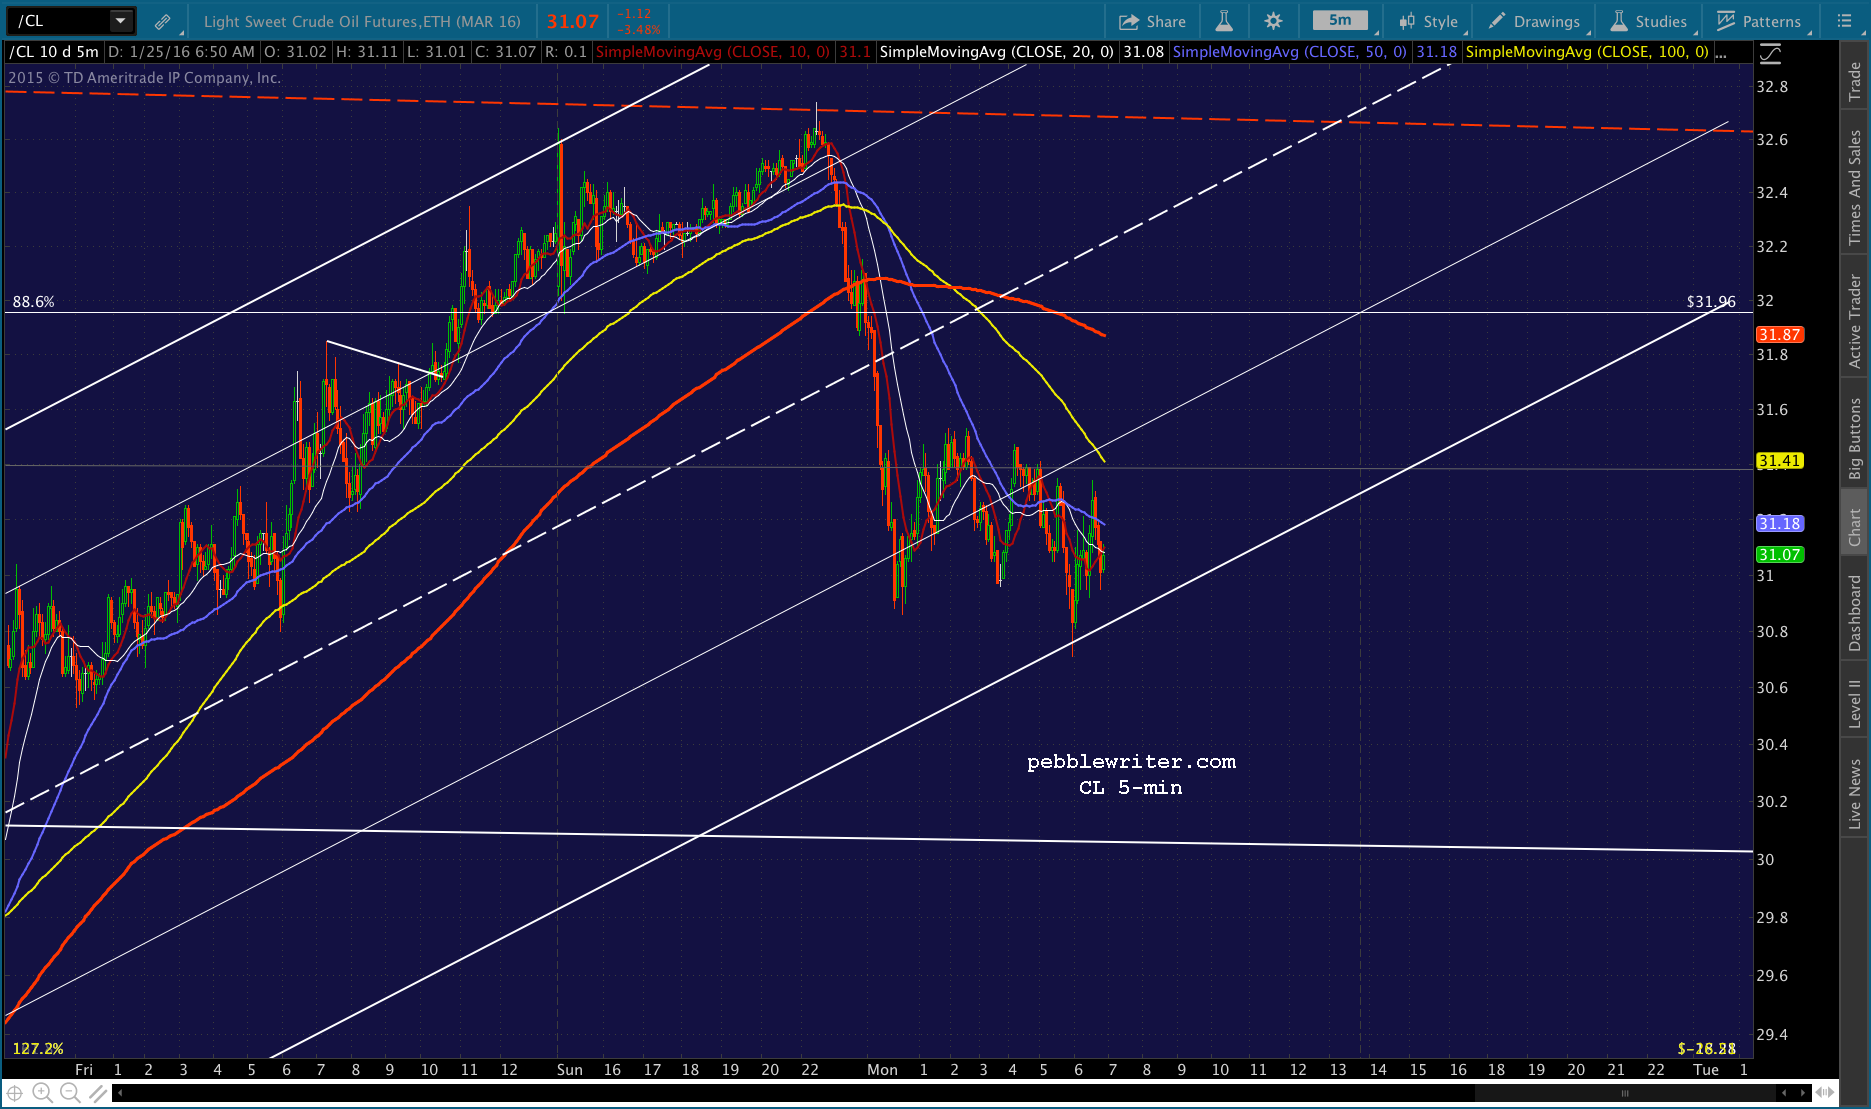 UDPATE: 10:06 AM
SPX just reached our bounce target on a spike by CL and USDJPY. I’d sell the long position here at 1902.16 and go to cash while we wait to see if USDJPY and CL will push through.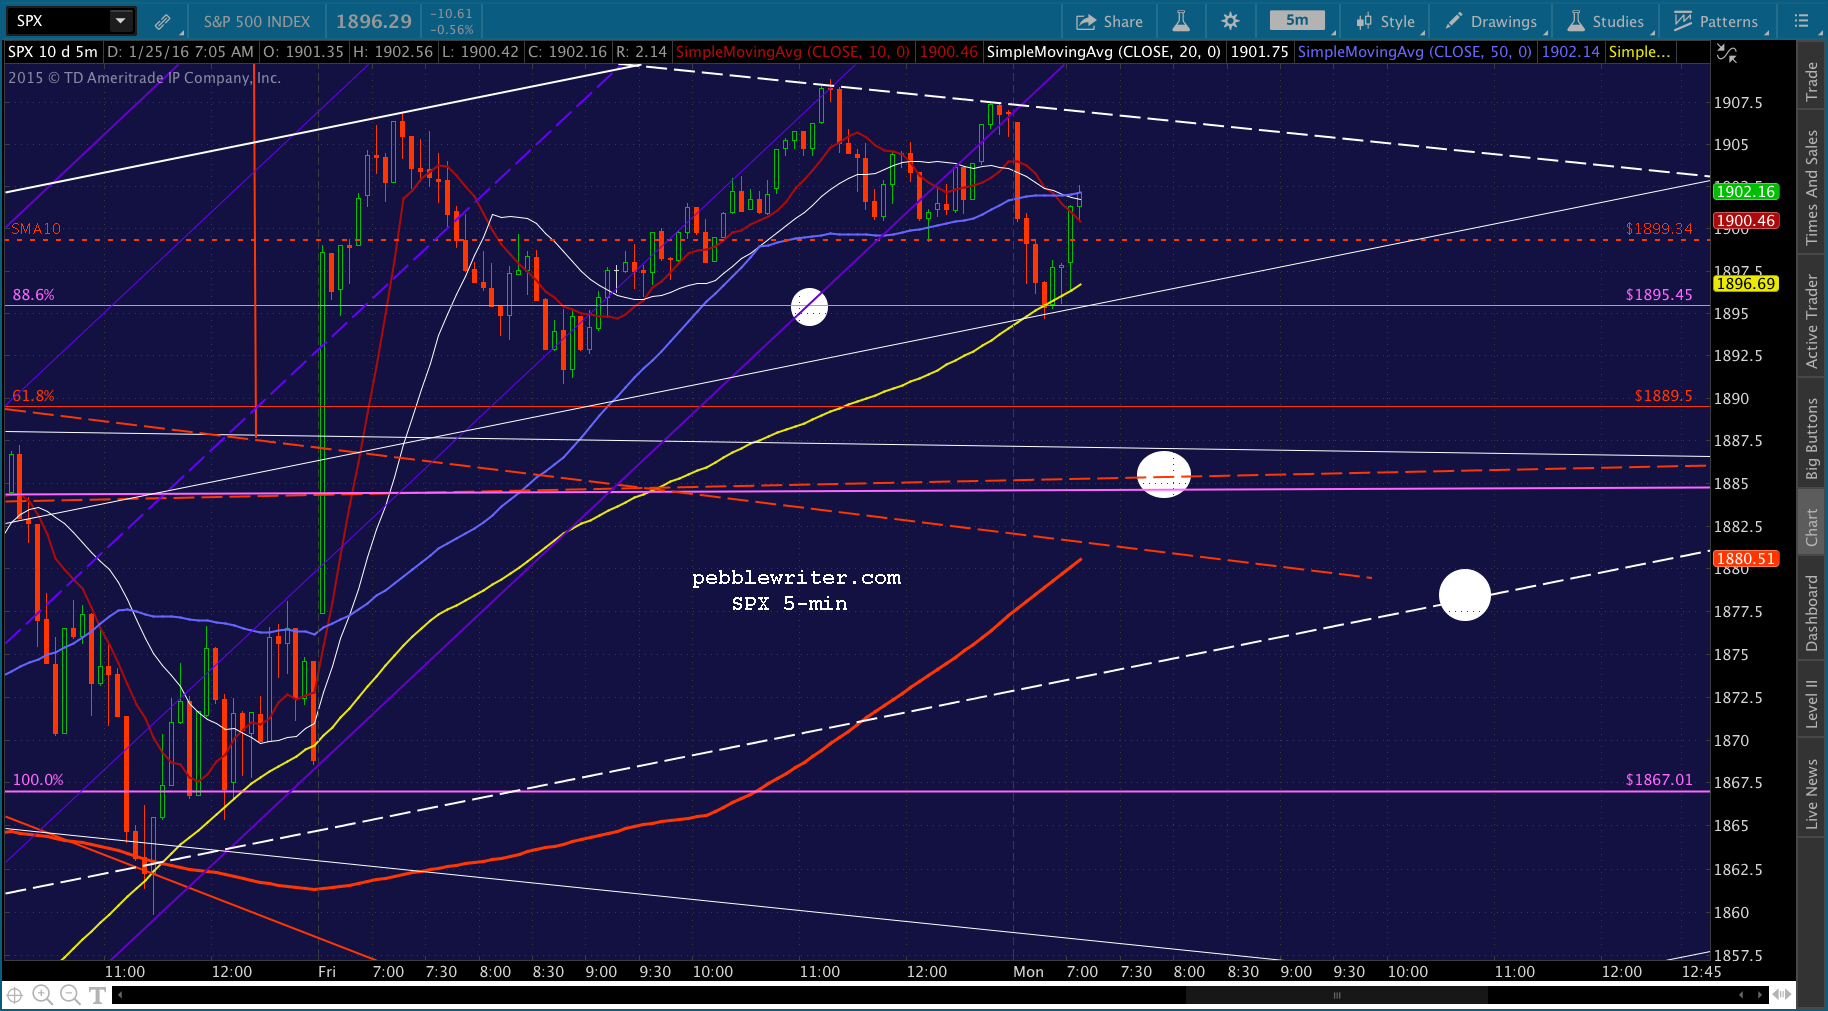
 UPDATE: 10:15 AM
SPX is dropping through the SMA100. Back to short for 1886ish. UPDATE: 10:17 AM
Drop through support saved by another leg up by USDJPY and CL. Back to cash.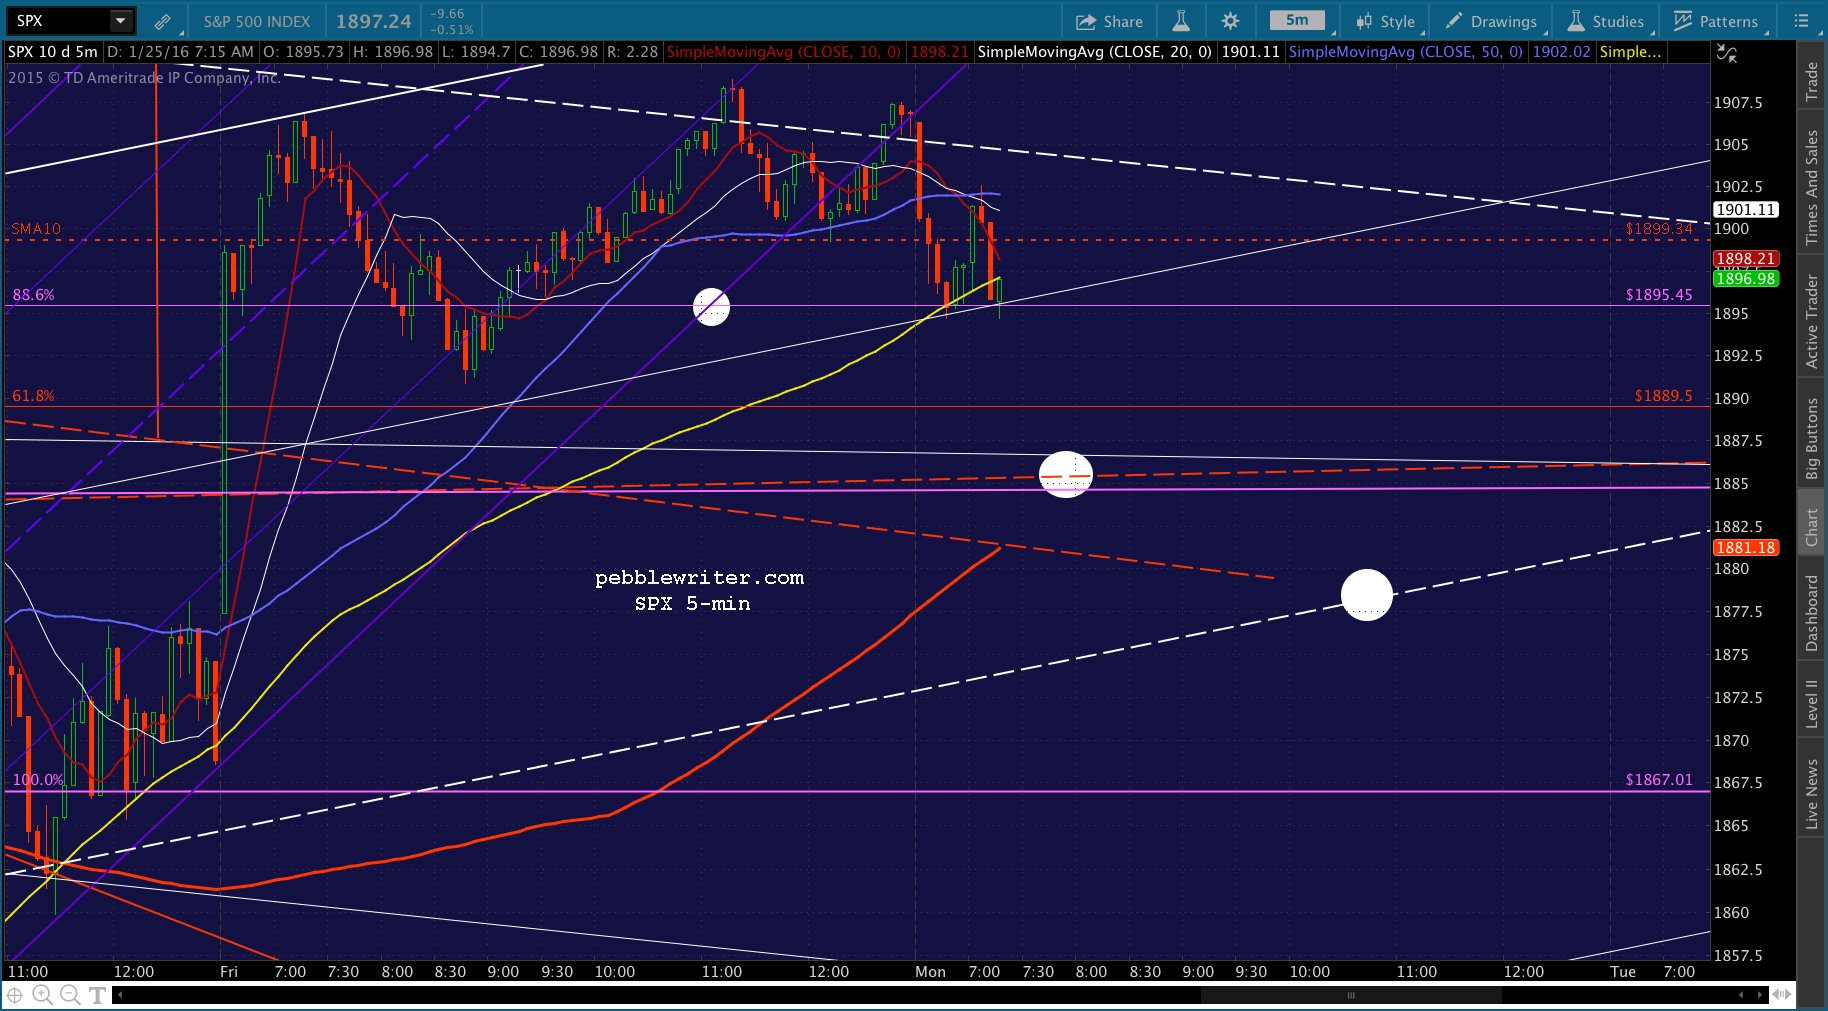 UPDATE: 10:21 AM
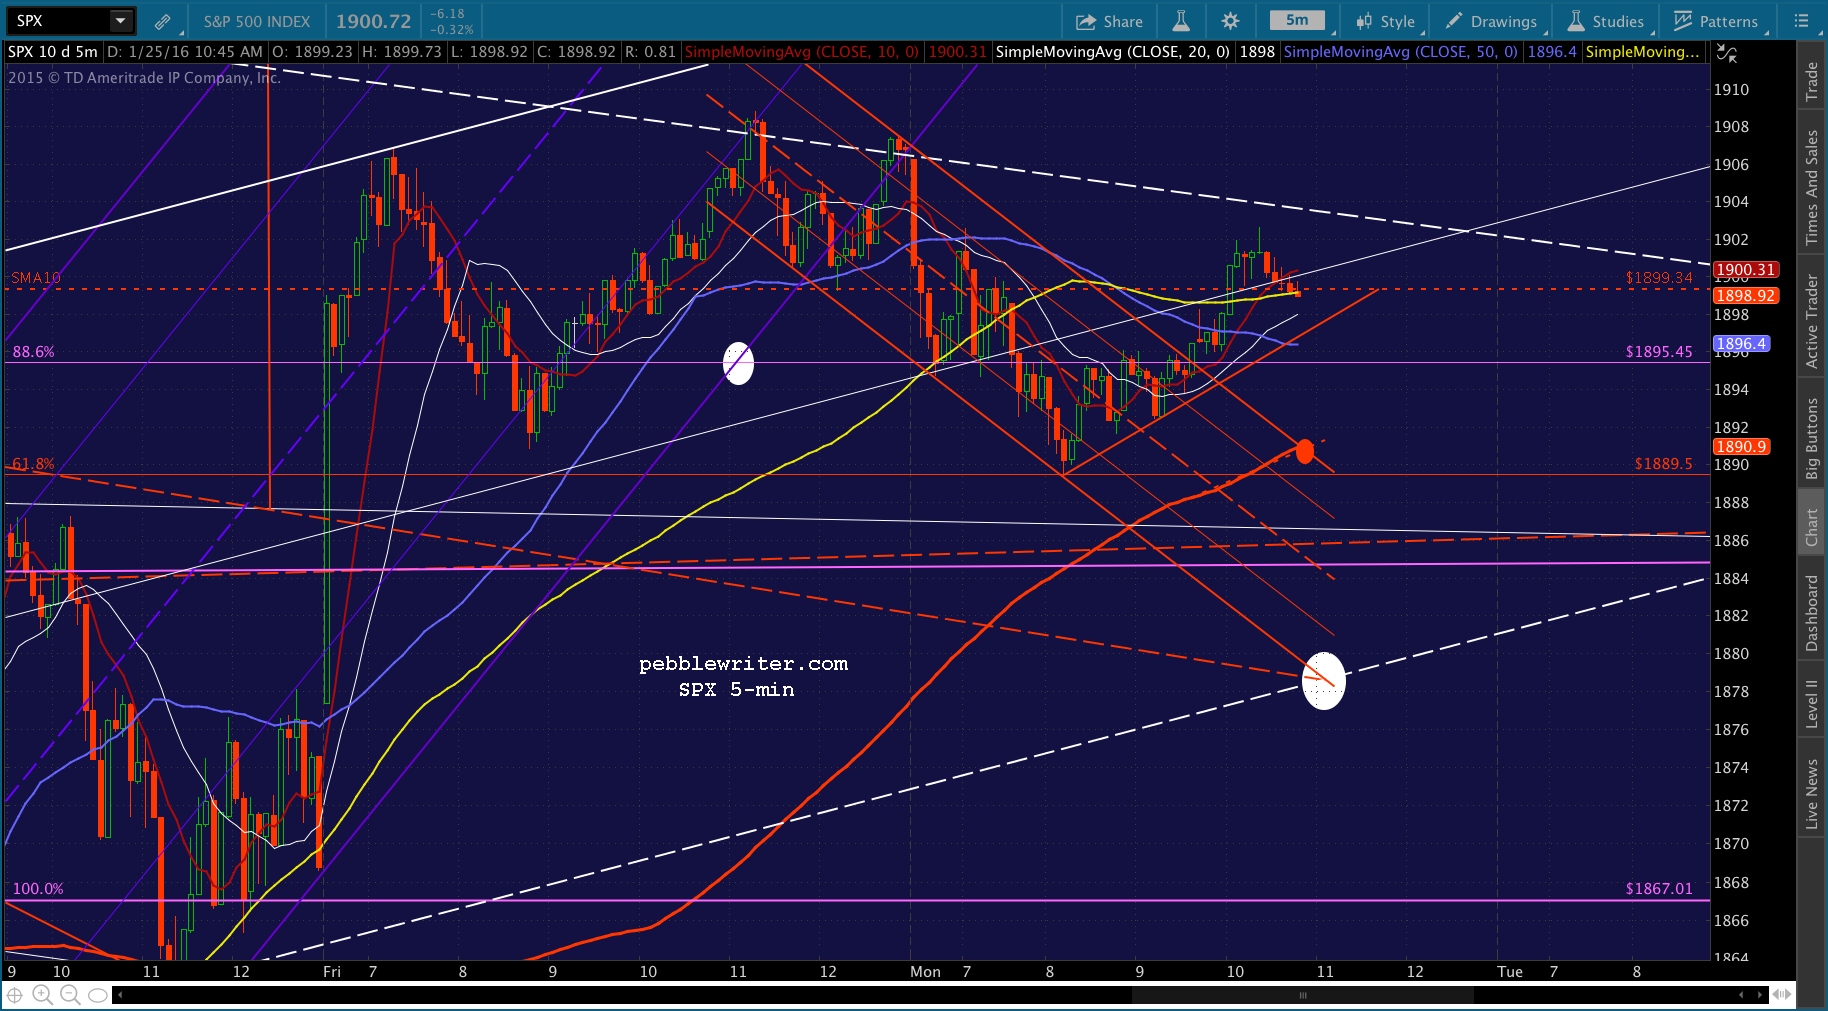
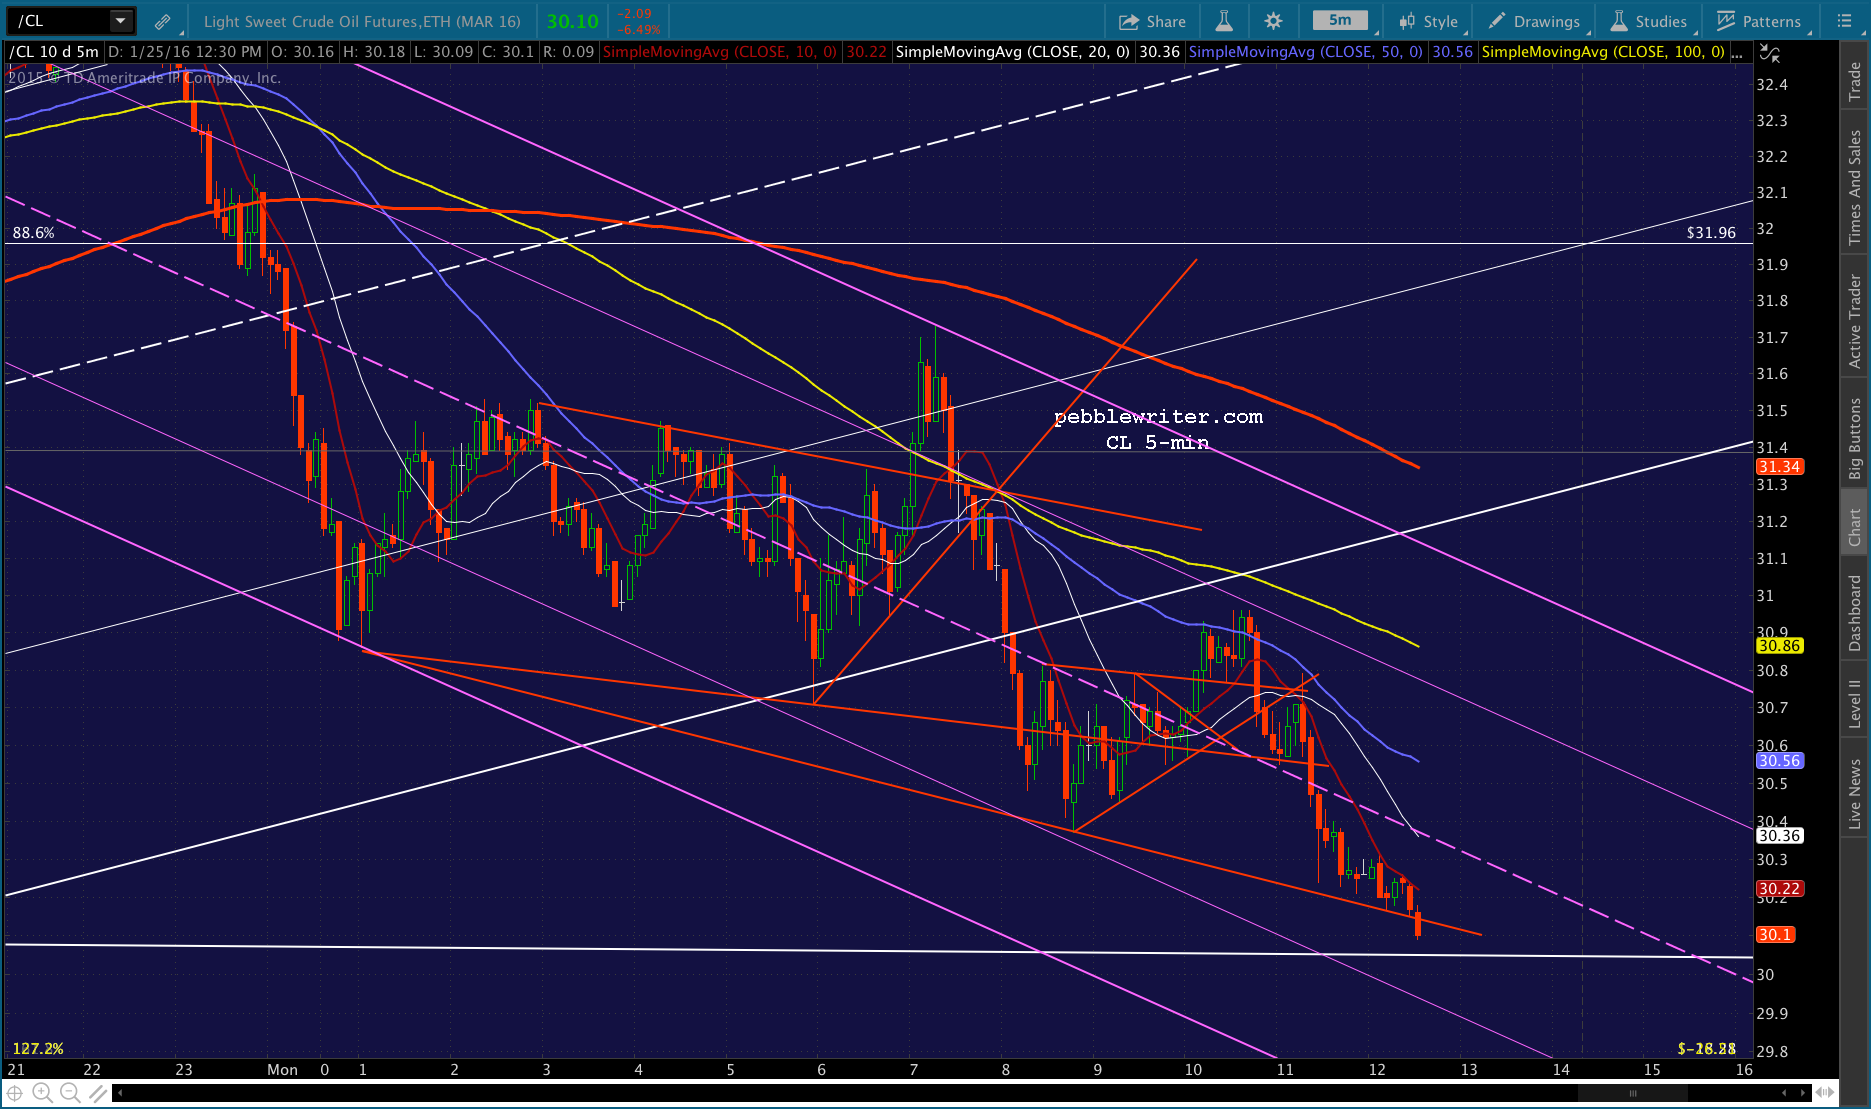
I believe that last spike was designed to delay the drop through 1895 until the SMA5 200 reaches the red midline: 1885 around 11:05?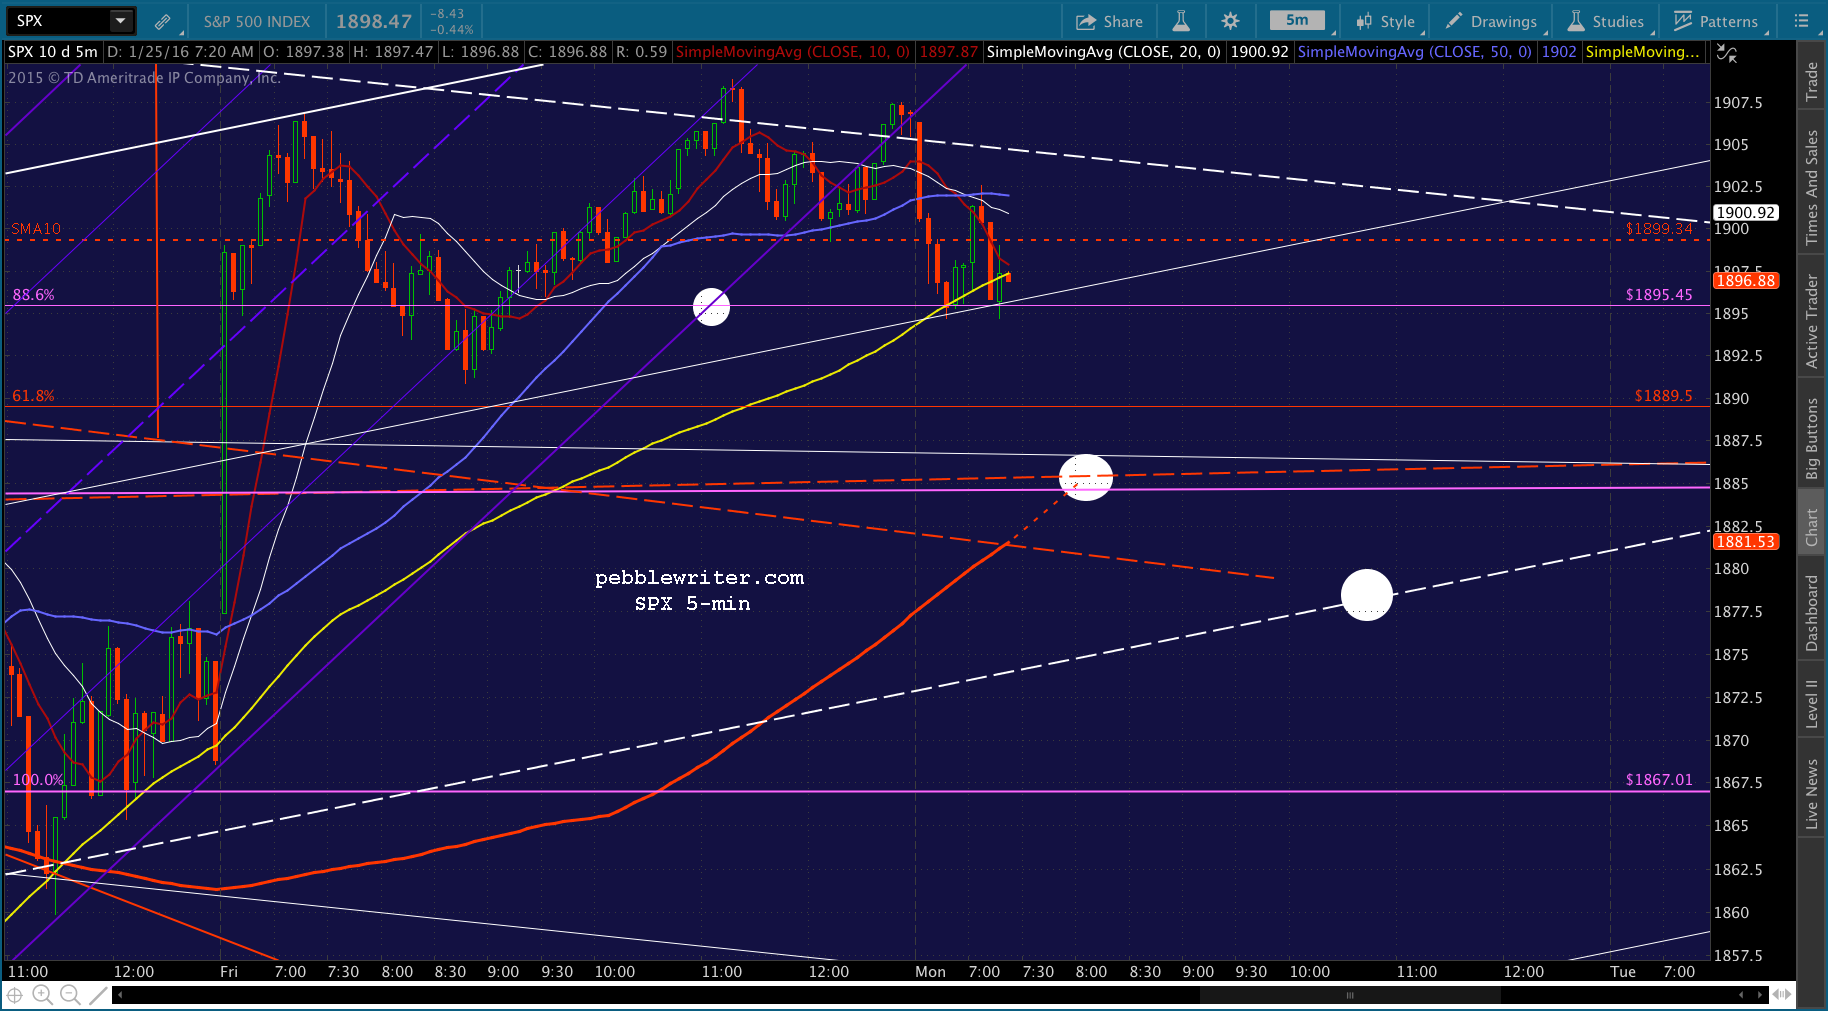 At some point, CL will tag both the red SMA5 200 at 31.85 and backtest the flag top around 31.34. Unclear which order, though.
 USDJPY is threatening to break out, but the drop back into the falling red channel means further downside is still in the cards.
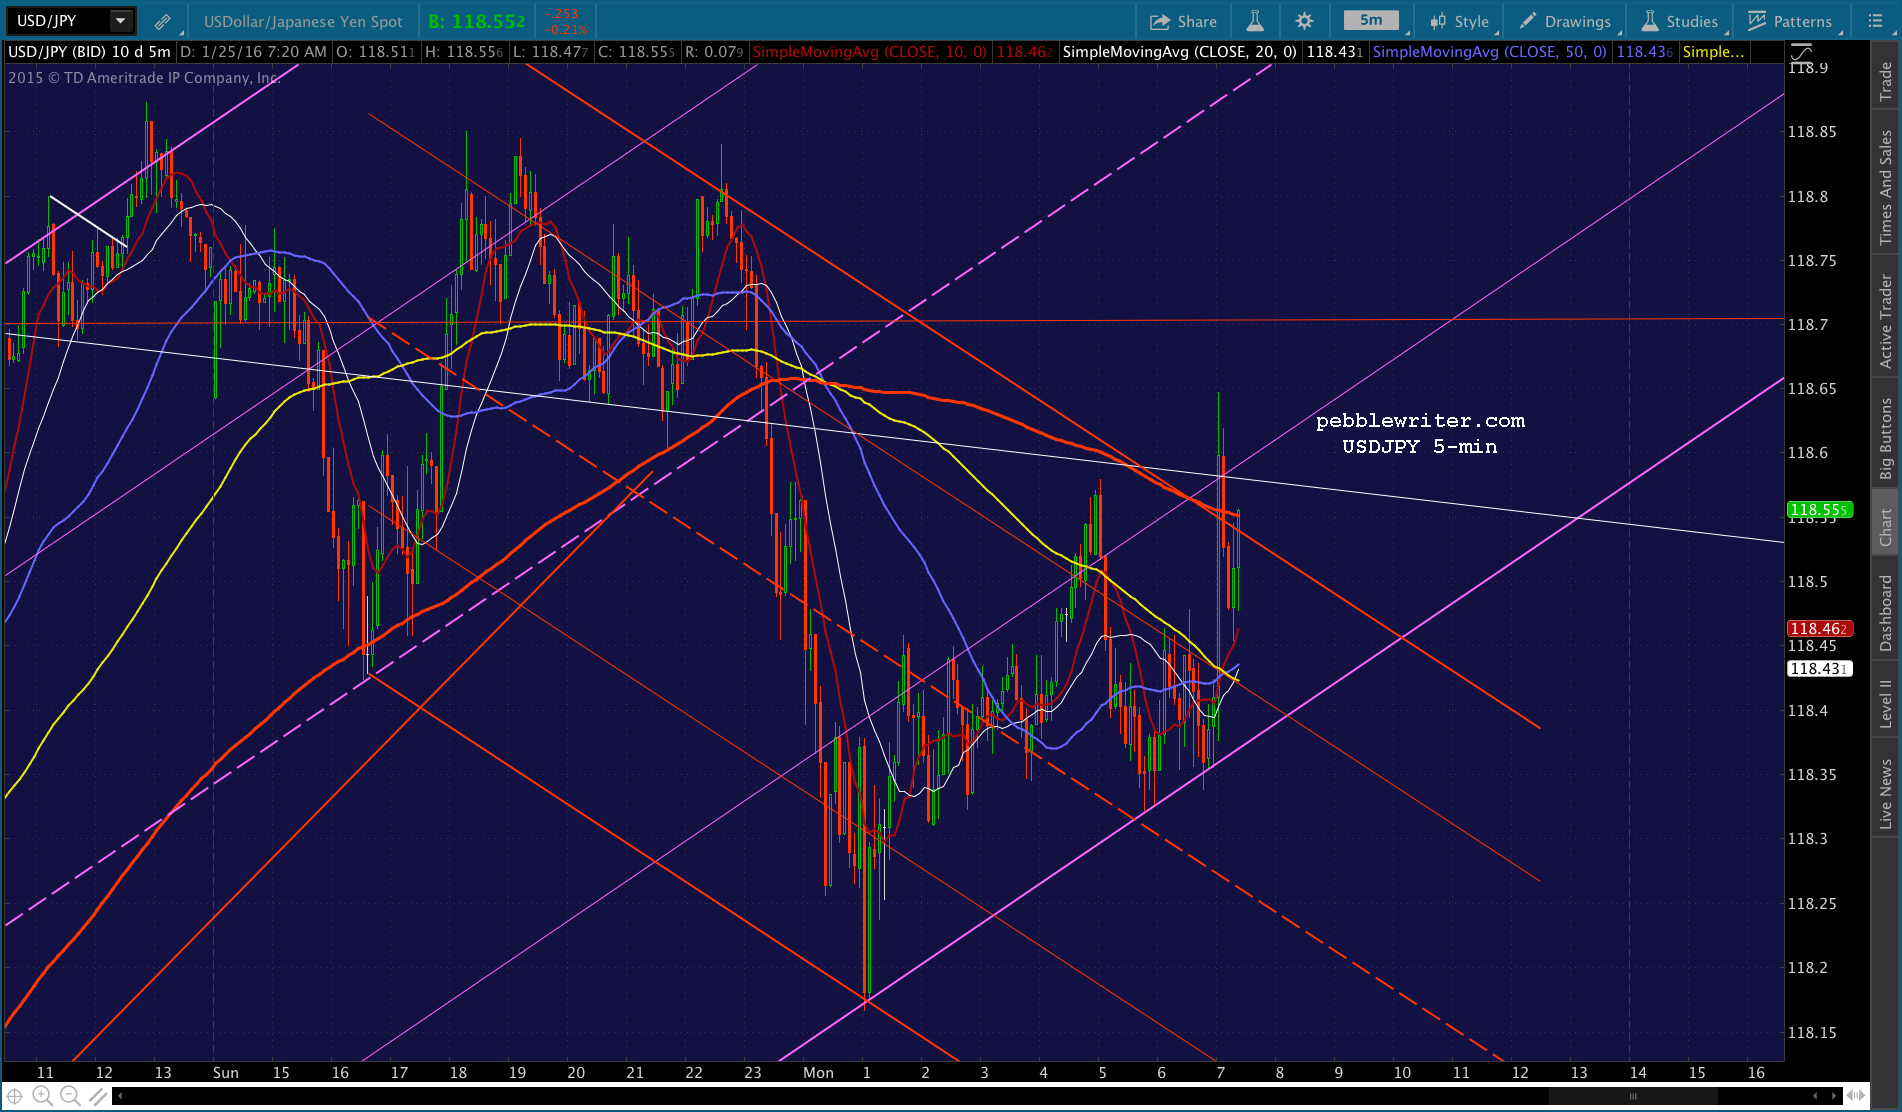
UPDATE: 10:25 AM
Will try another short position here at 1898.91 as CL just poked down into the flag and USDJPY is back below the red channel top. UPDATE: 11:00 AM
Yep, a timing issue. Looks like the 1886 target has been pushed back thanks to an otherwise inexplicable spurt by USDJPY back above the red channel top. Look for it to reverse to the purple channel bottom when the time is right.
Note that while the red channel midline is very important — it dates back to 2009 — it has been violated many times in the past week. So a stop right there at 1886 isn’t necessarily The Plan.
The red neckline currently at 1880 is just as likely, if not more. And, where it intersects the rising white channel midline at 1878.50 later this afternoon would be even more logical. So, as always, we’ll keep an eye on USDJPY and CL to know when/where to expect bounces.

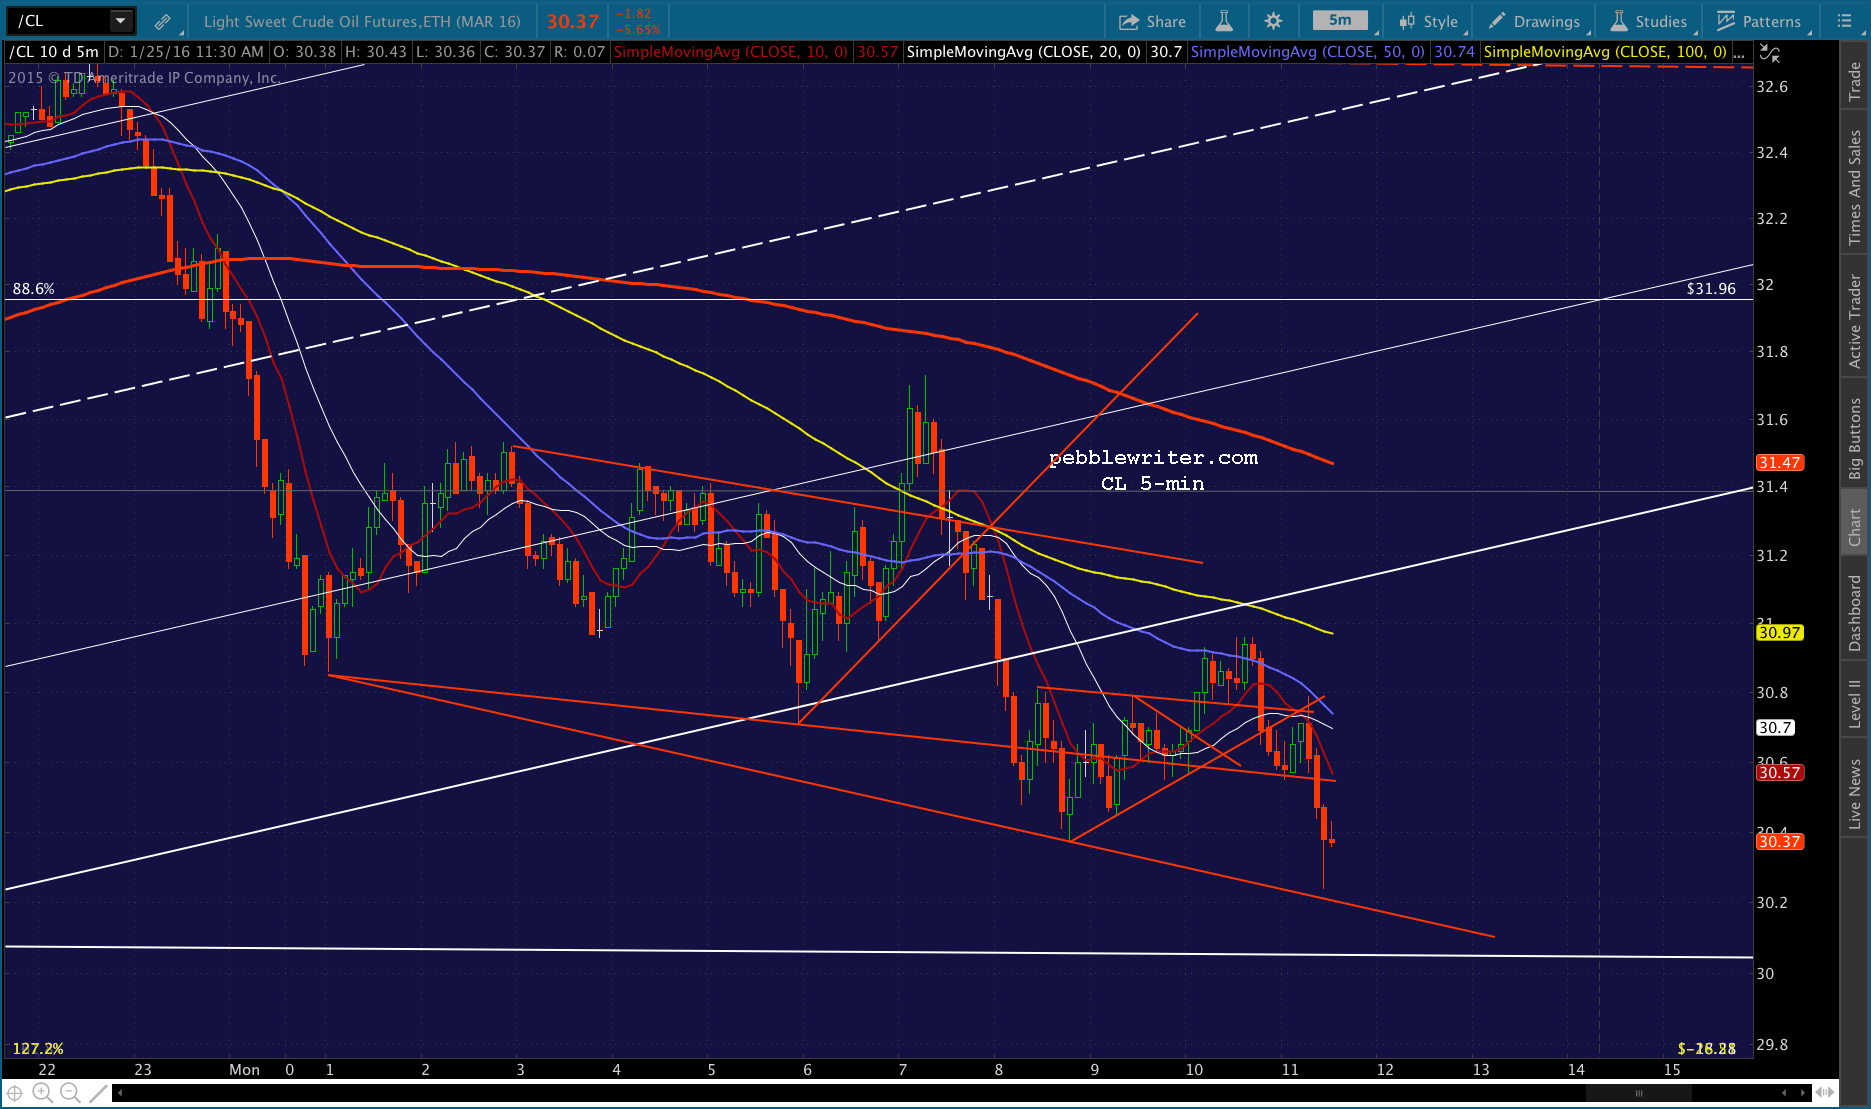
 CL is signaling that it’s time right now.
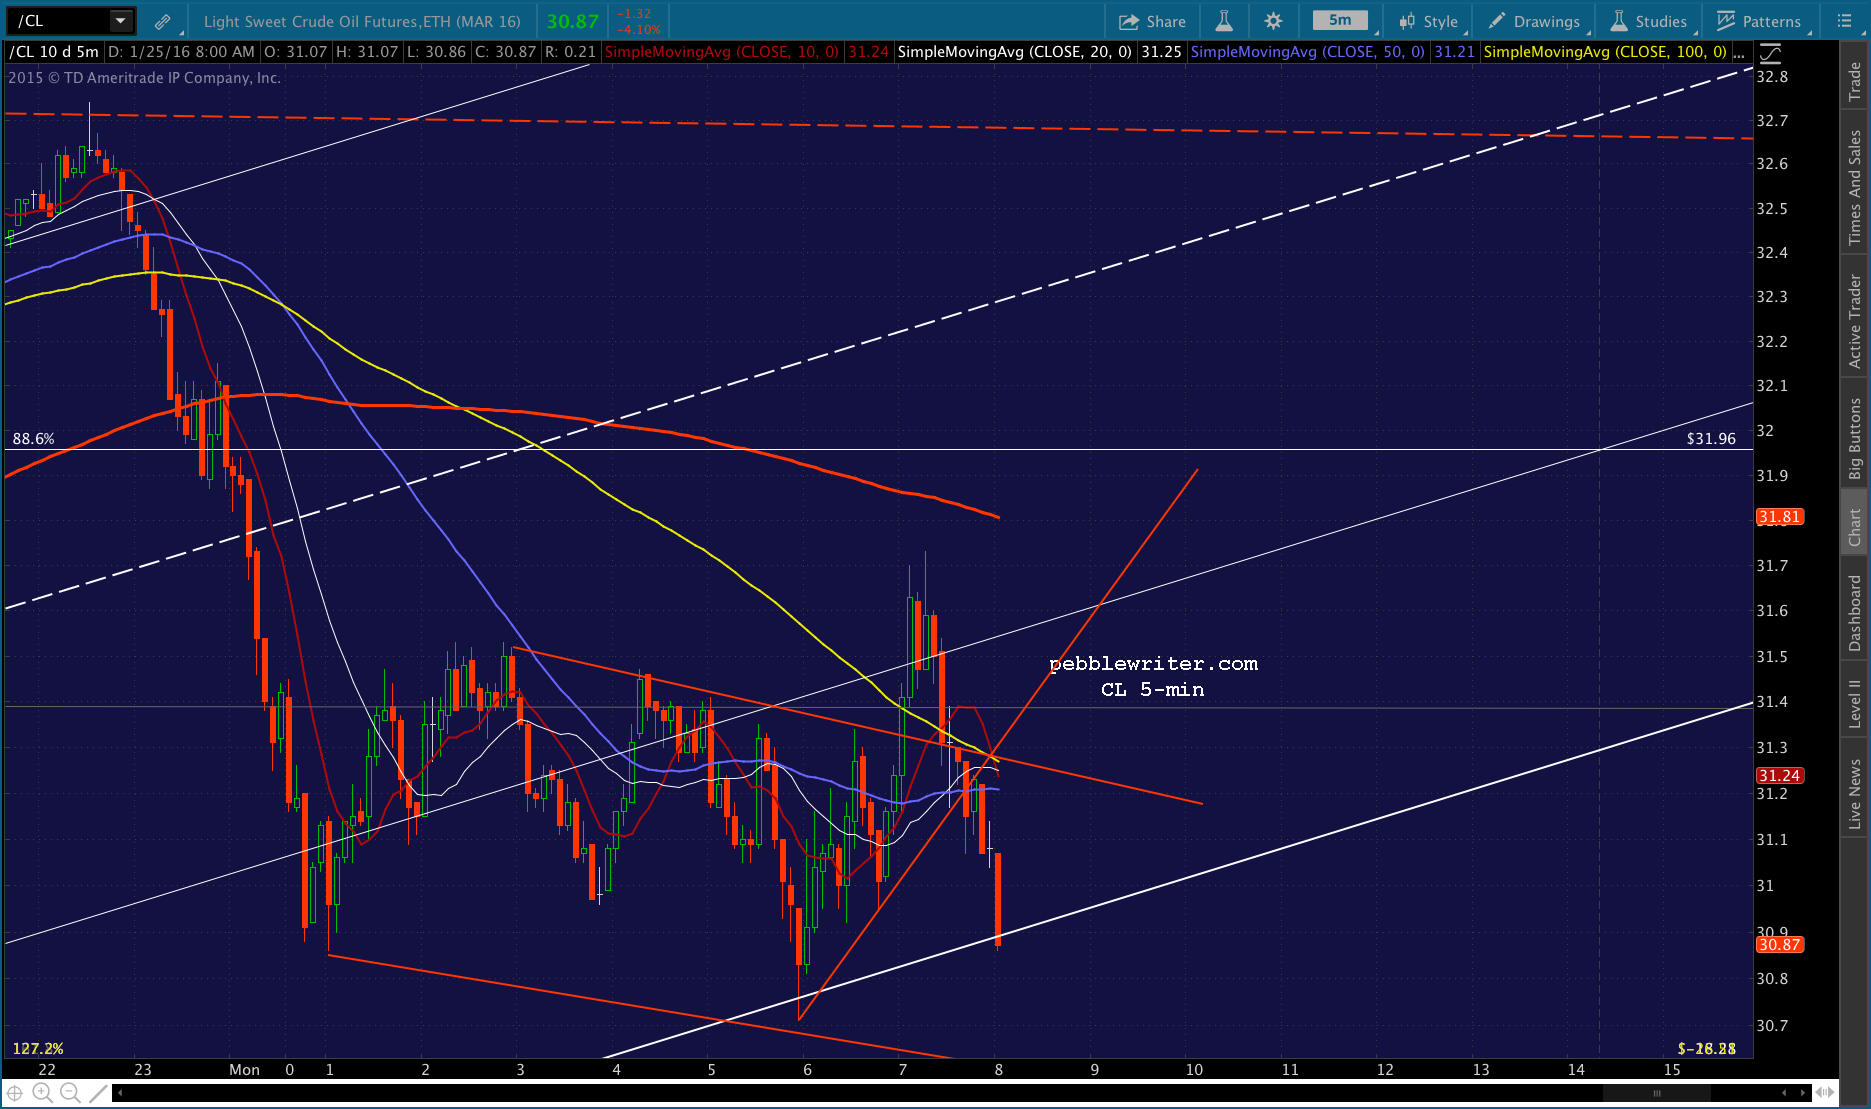 UPDATE: 11:13 AM
CL just pushed below TL support. Should be getting close.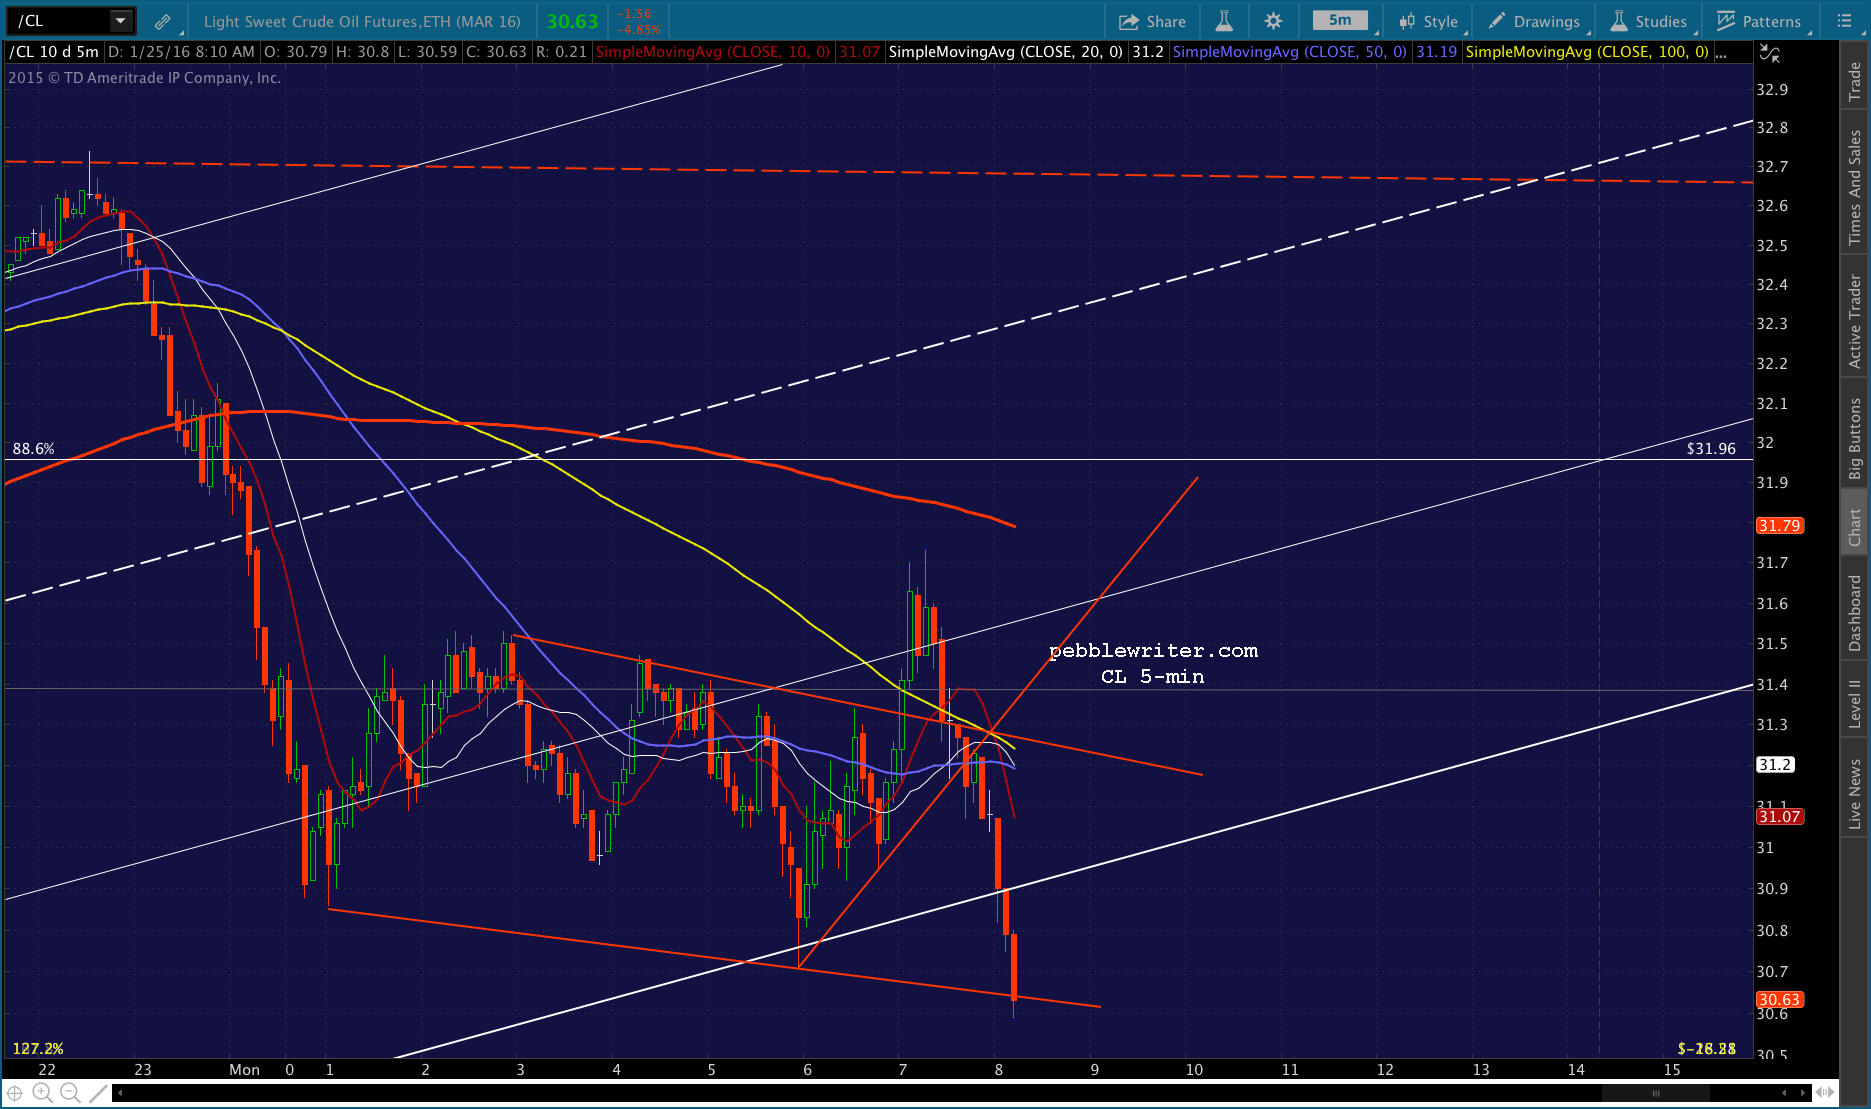

 UPDATE: 11:28 AM
Looks like we’ll get another SMA10 backtest before going down any further. Euro close coming up.
 UPDATE: 12:07 PM
SPX has gone from looking like it was just backtesting the SMA20 to a likely test of the SMA50/100 up at 1898. I’m redrawing the falling red channel and would blow out the short position unless it starts down through the SMA5 10 very soon. UPDATE: 12:27 PM
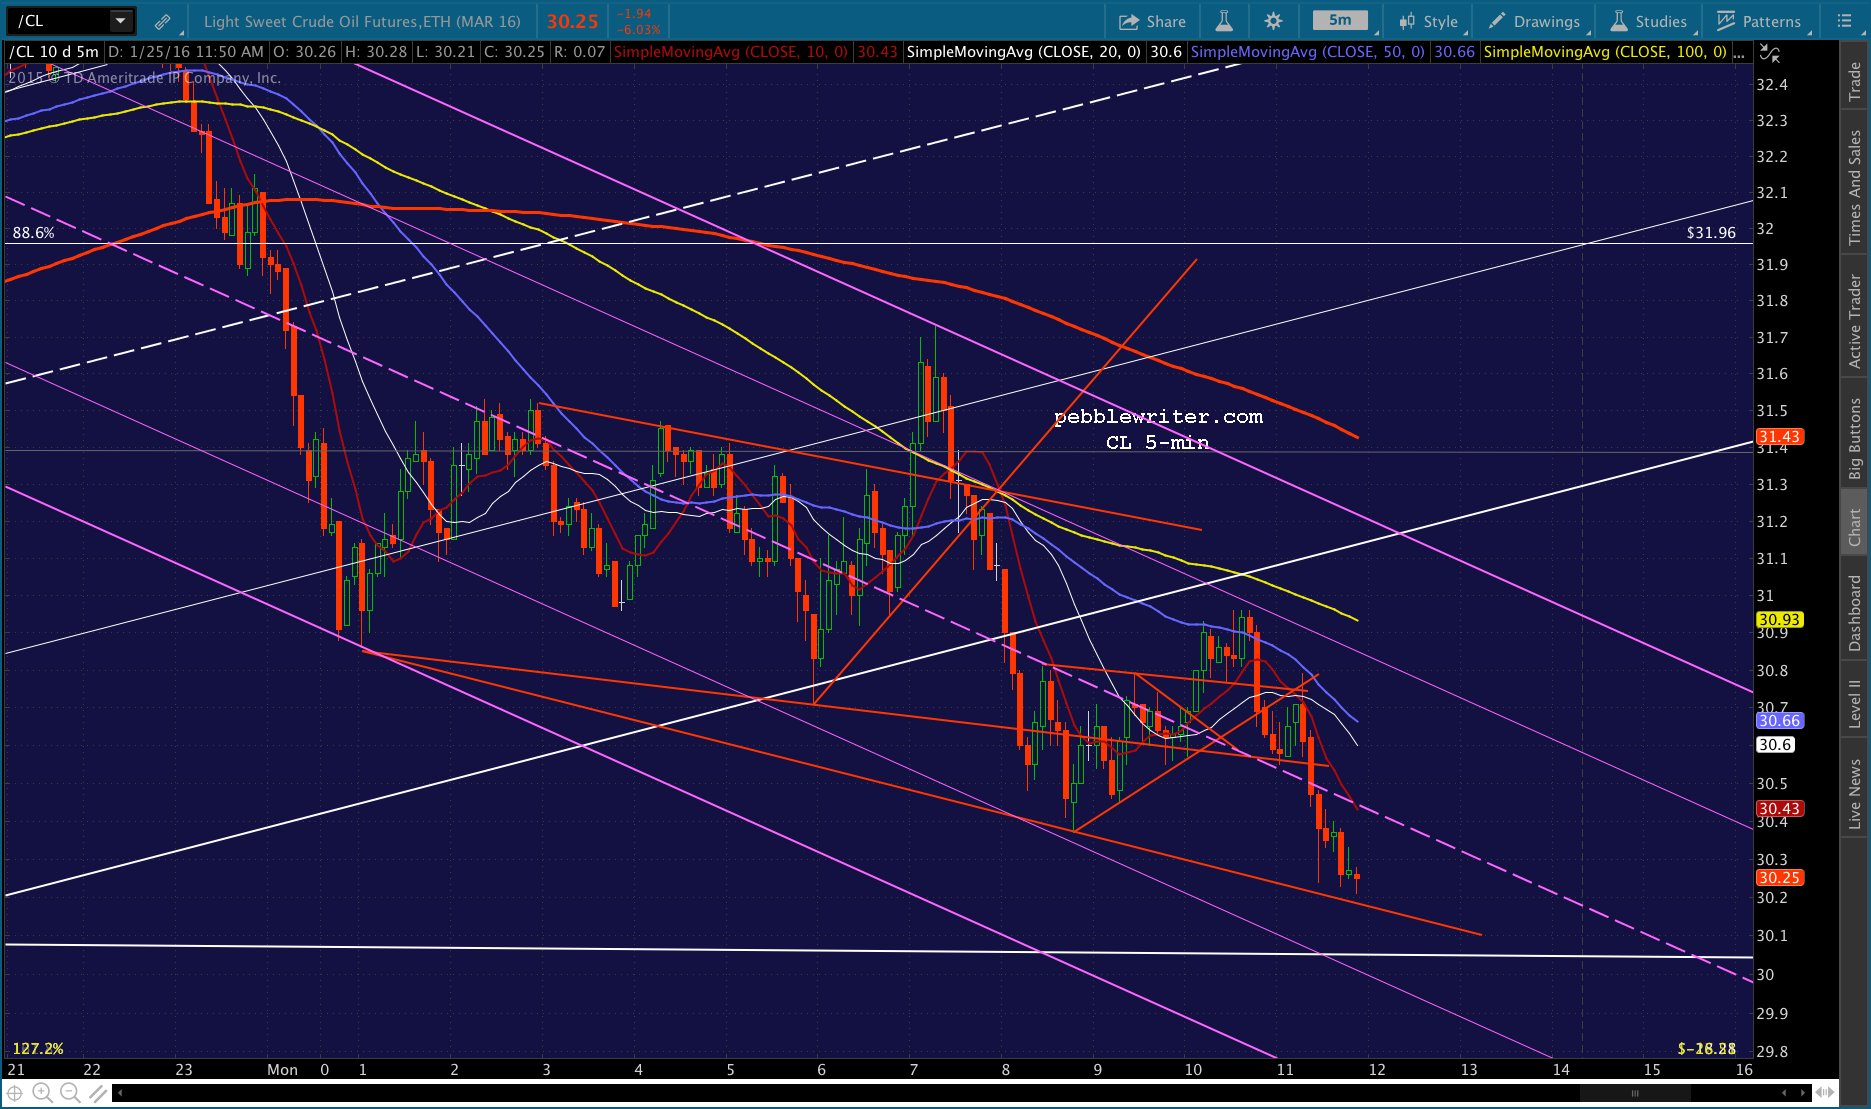
CL is working SPX higher, presumably to tag the purple SMA5 50. At this point, SPX can dip down to the SMA5 200 without much of a decline: 1888.14. The neckline target is now closer to 1878.25 around 2PM.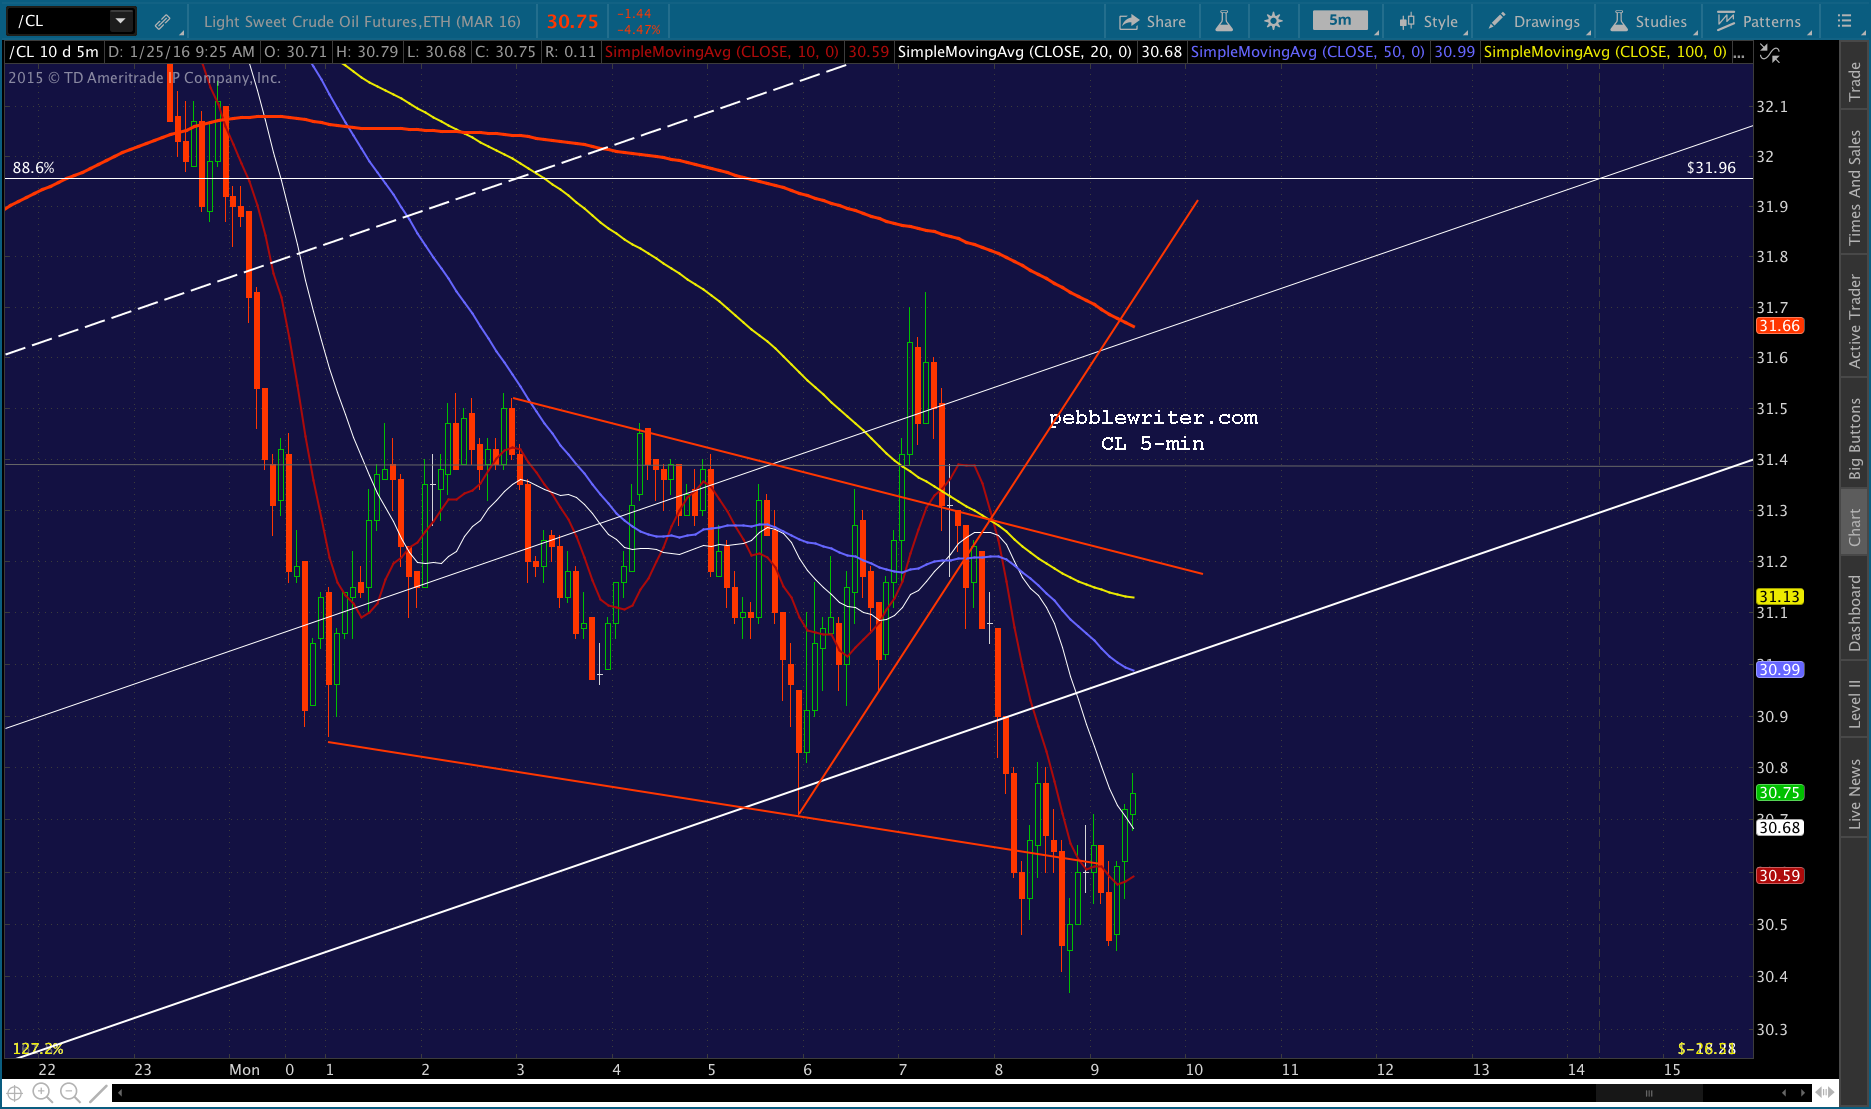
 UPDATE: 12:34 PM
Closing the short here at 1894.22, but will gladly reopen it if CL pushes down through the TL again.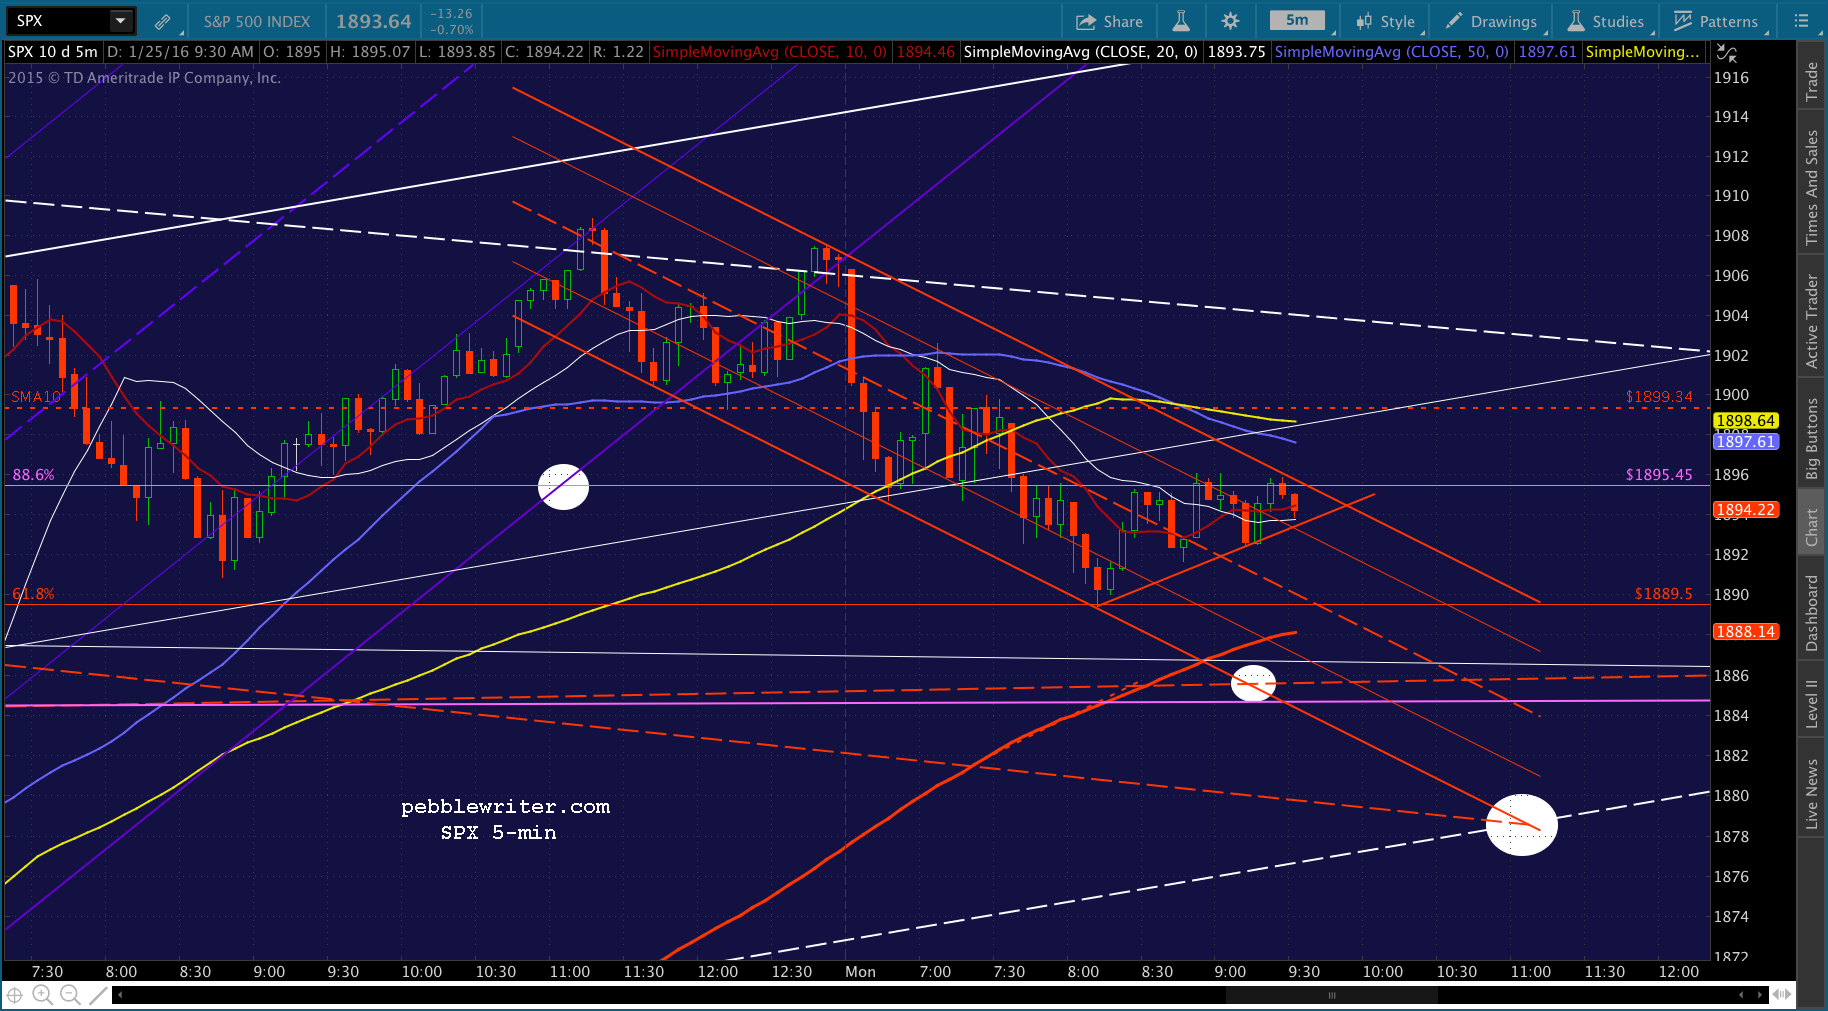

UPDATE: 12:53 PM
Tagged the SMA5 50 and is reversing slightly — though, could be targeting the SMA5 100 at 1898. The key will be breaking down below the SMA5 20 at 1894.88ish, which means we need USDJPY to dip to or below the purple channel bottom and/or CL to dip below the two red TLs. 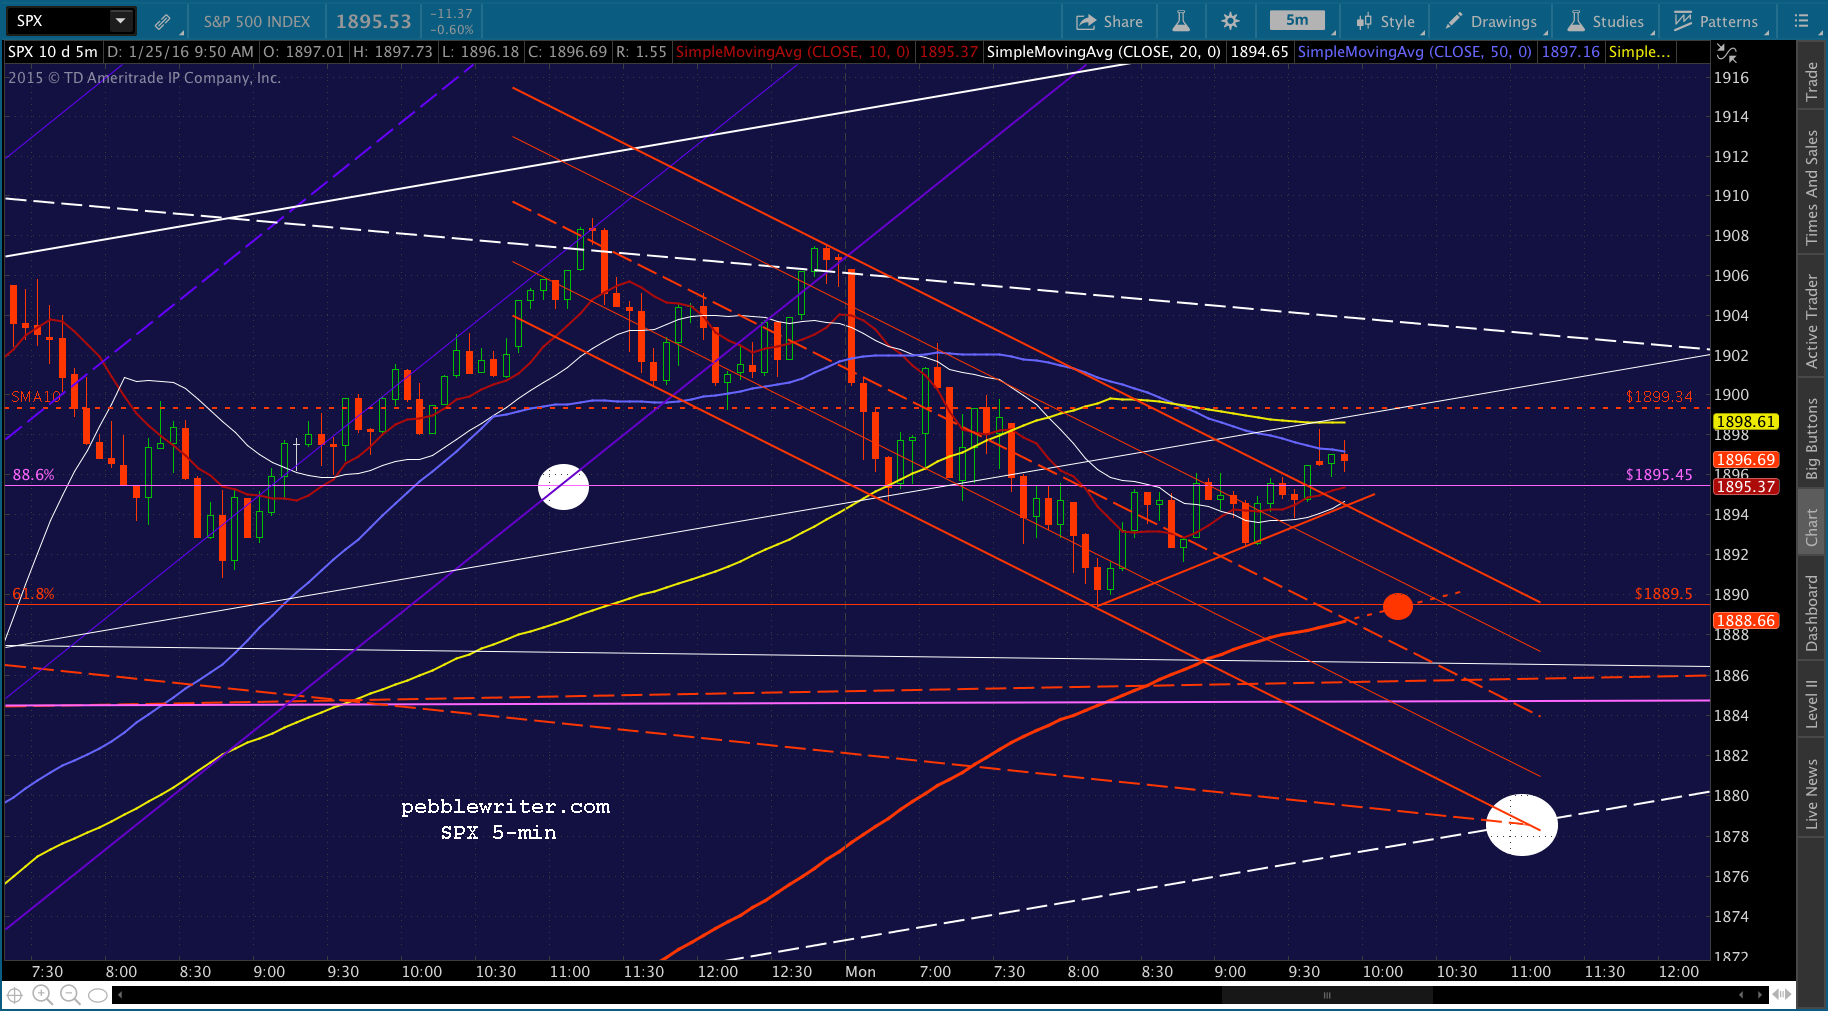


UPDATE: 12:58 PM
Taking a crack at a short position here at 1898.84 at the top of the hour. The daily SMA10 is just above at 1899.34.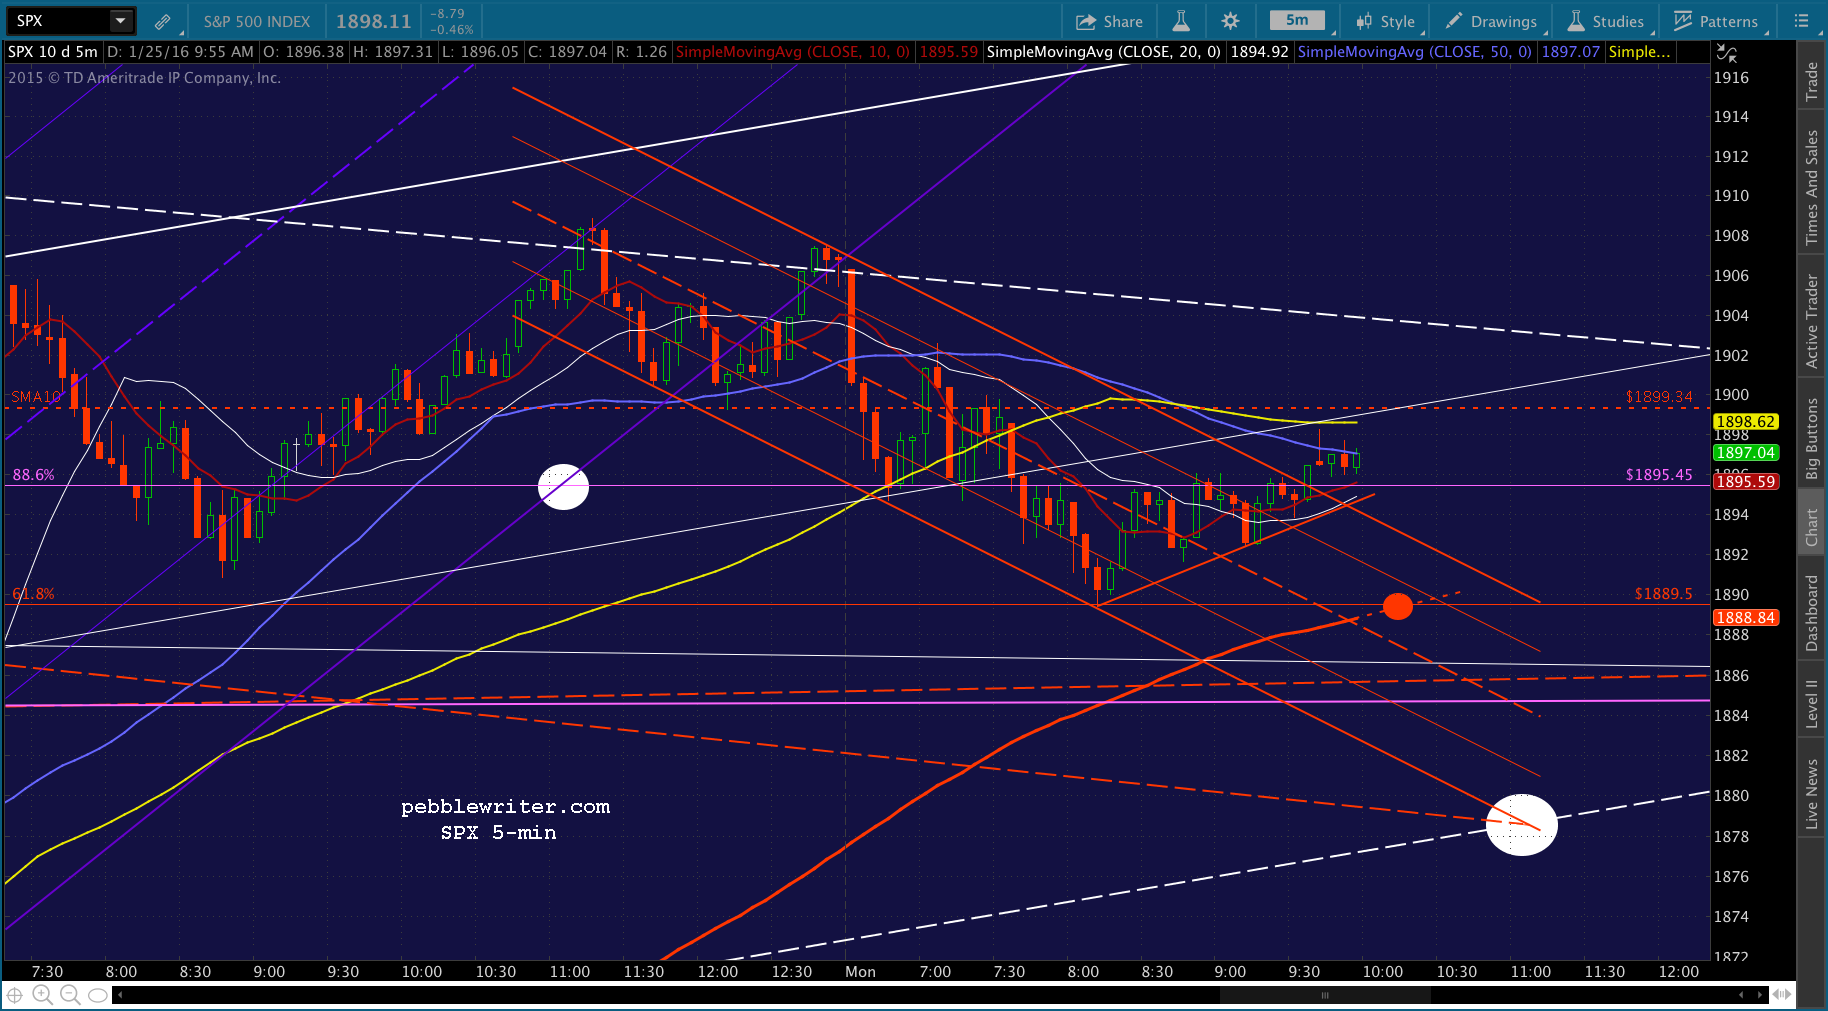
USDJPY and CL are on the brink of a breakdown or breakout. Should know pretty quickly.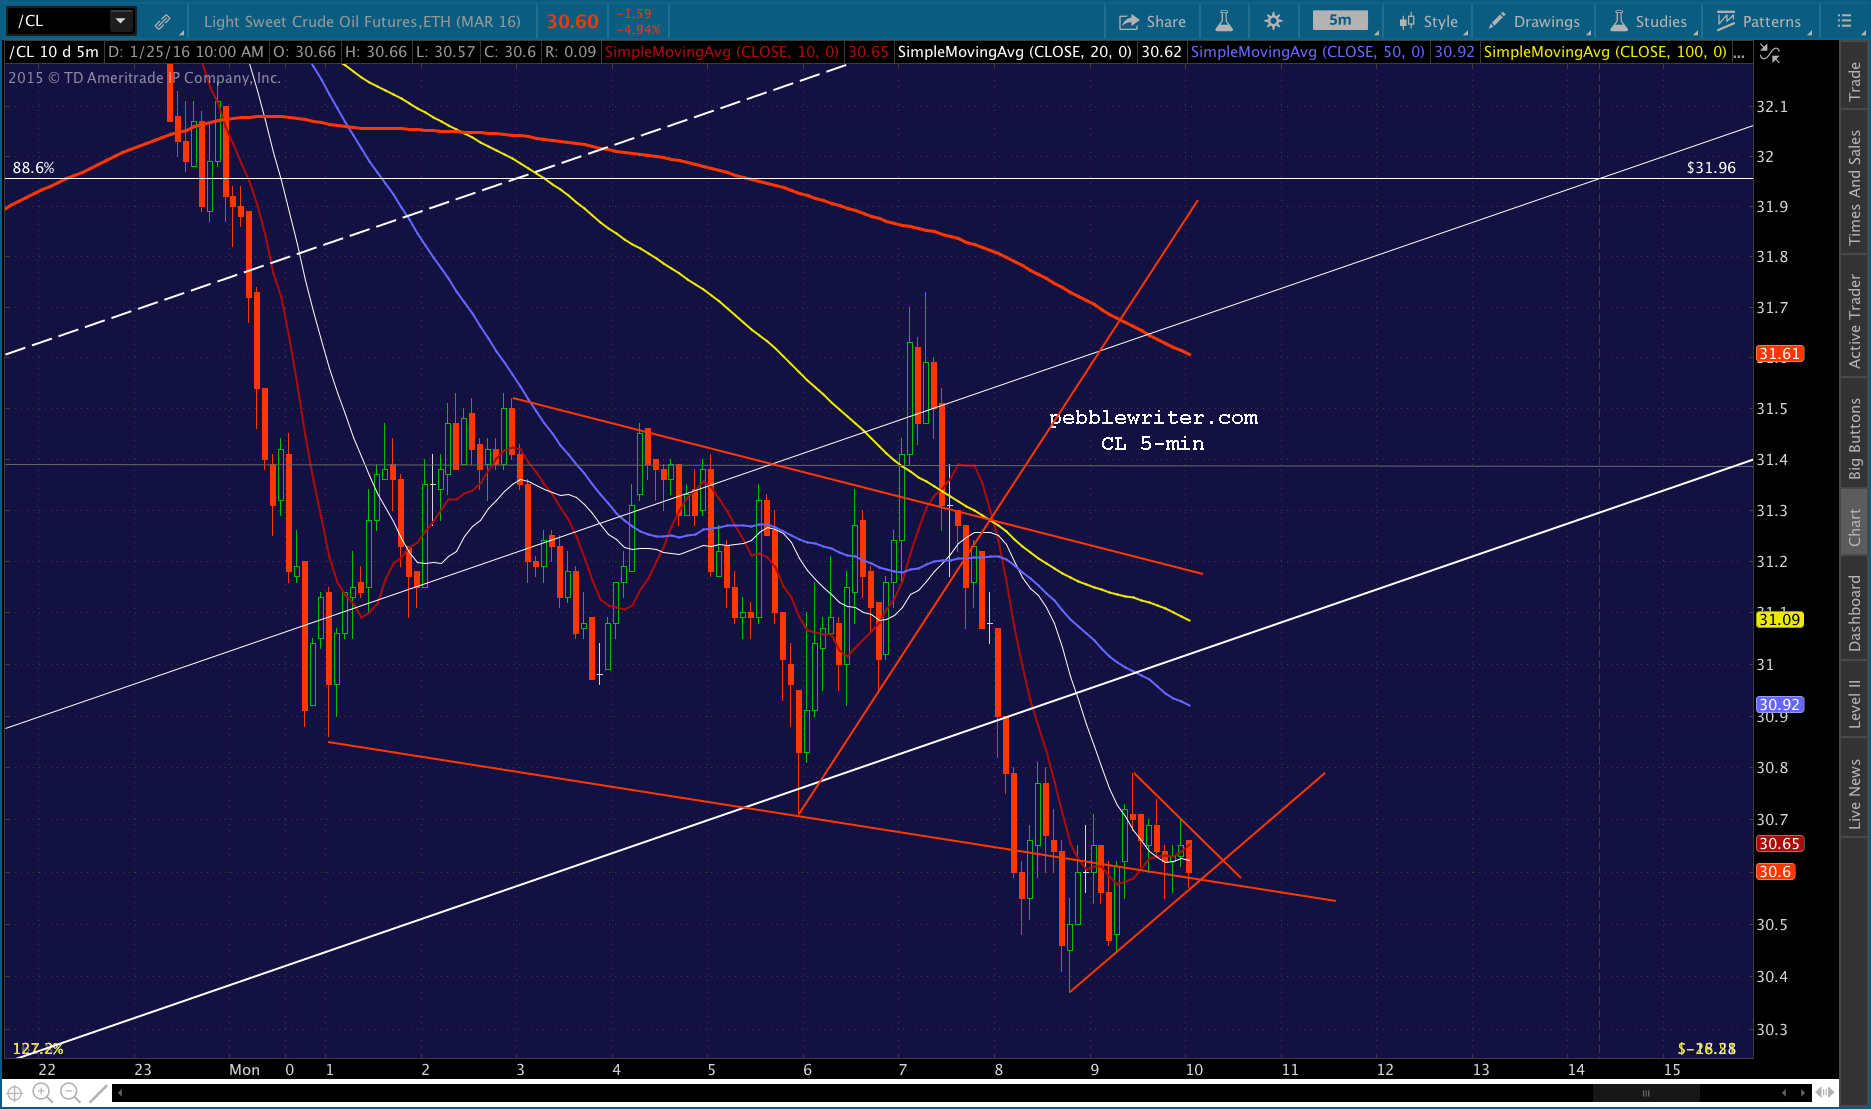

UPDATE: 1:04 PM
Easing up through the SMA10, so back to cash here at 1899.27 for me.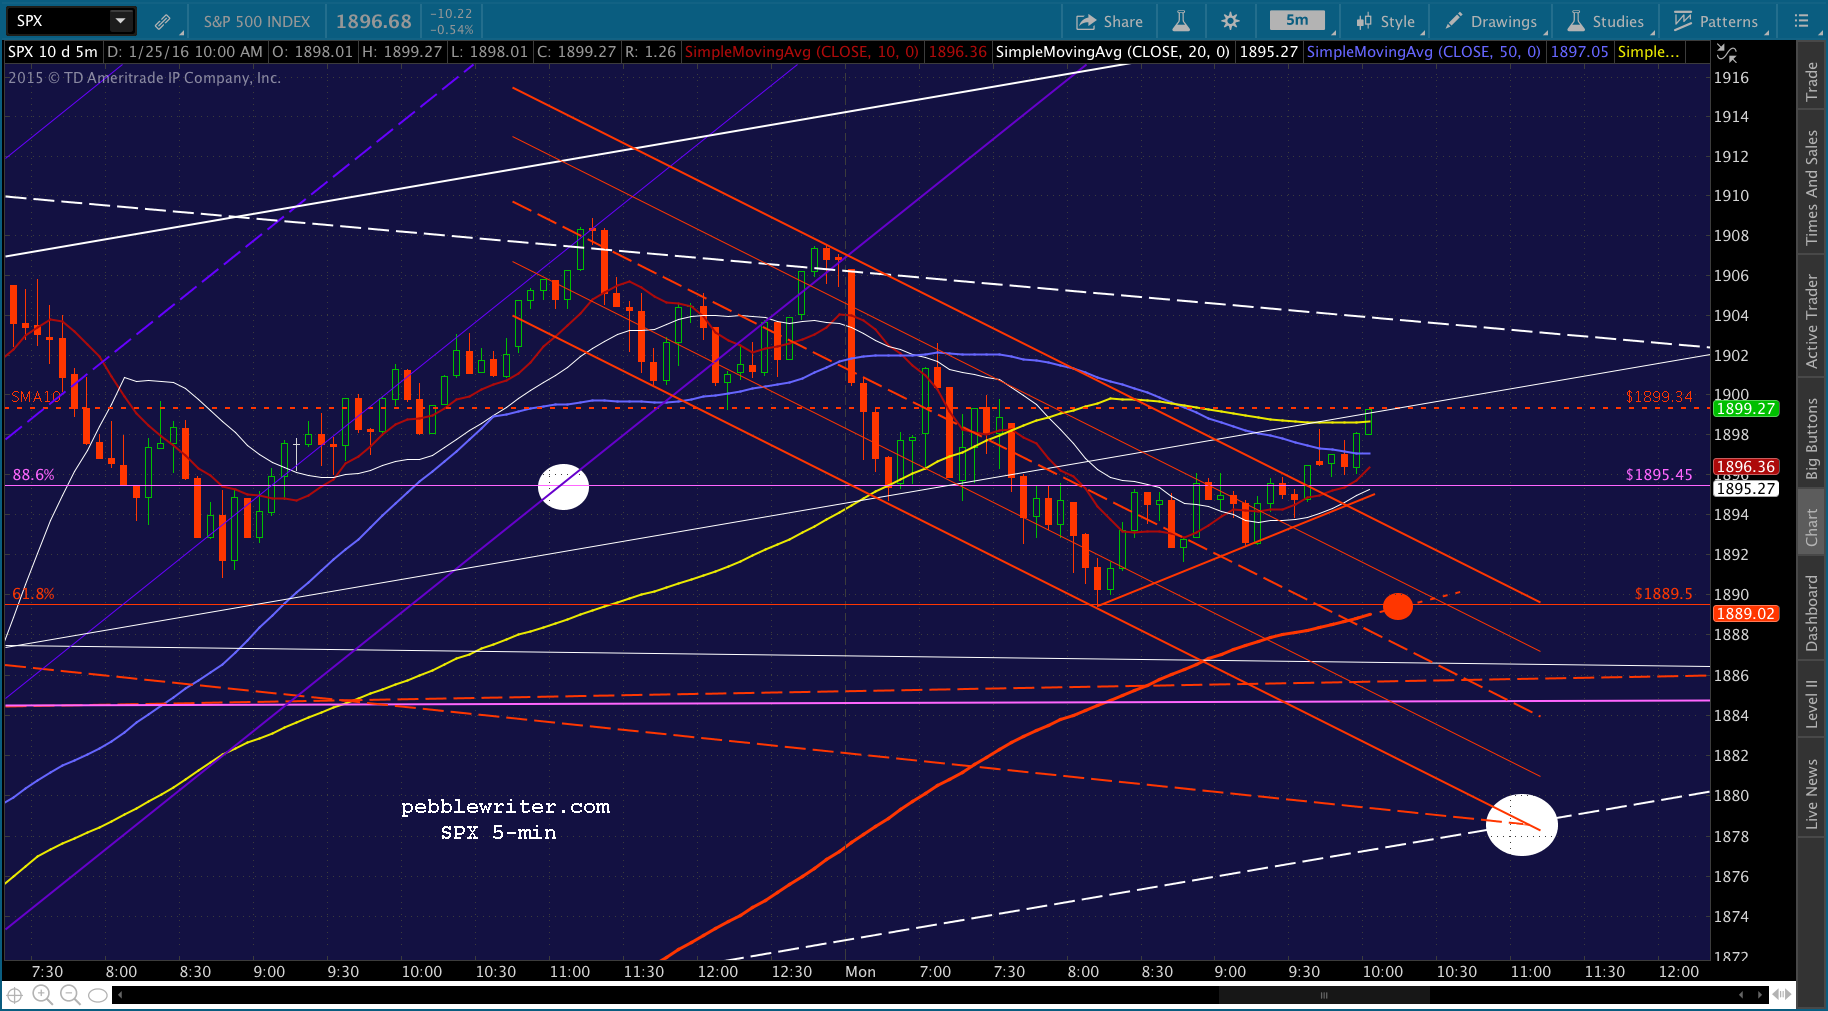
UPDATE: 1:07 PM
That move was driven entirely by ES, so I’ll try another short position here at 1901.35 now that it’s reached its SMA200 and channel top. The only hitch is that USDJPY and CL are now on the verge of breaking out. This one’s 50:50 at best, but if it plays out it’s worth 10+ points — so worth a shot IMO — especially with the IH&S neckline still down there at 1878.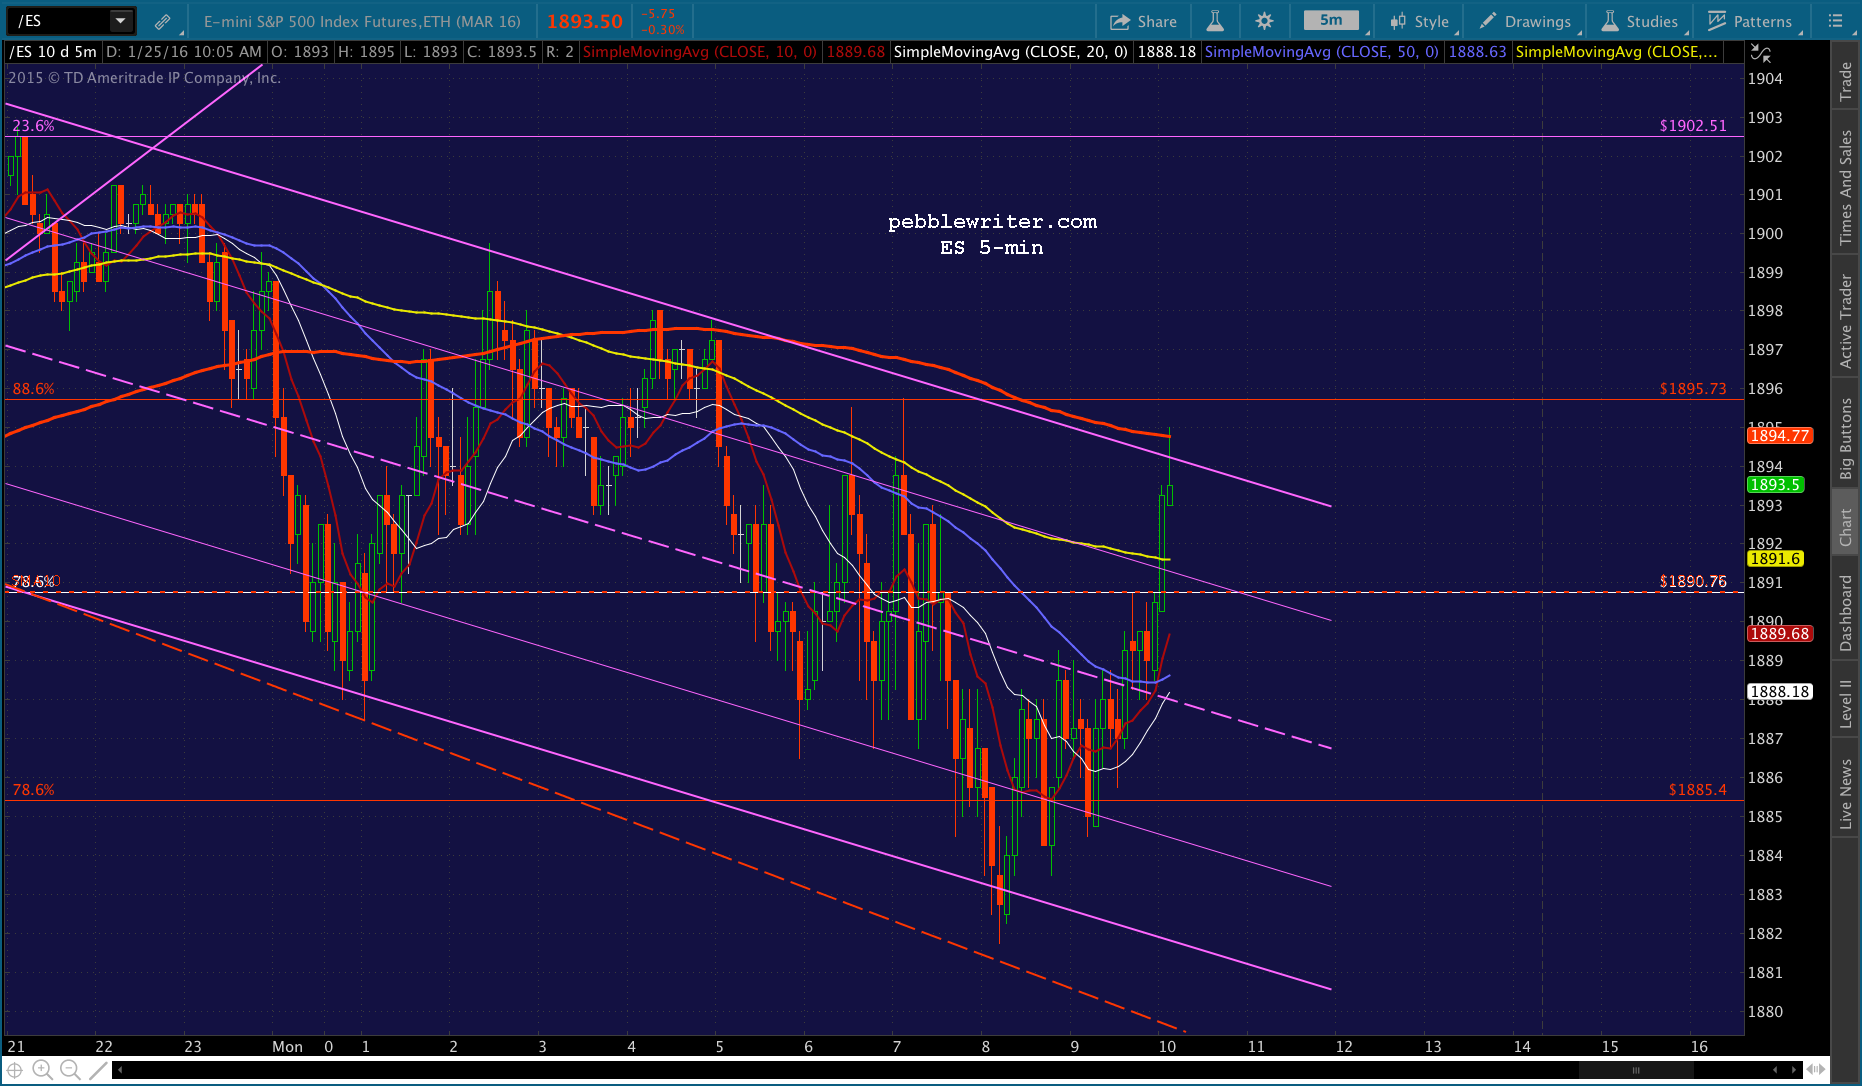


UPDATE: 1:19 PM
ES melting up, despite USDJPY and CL dipping. Back to cash at 1901.30.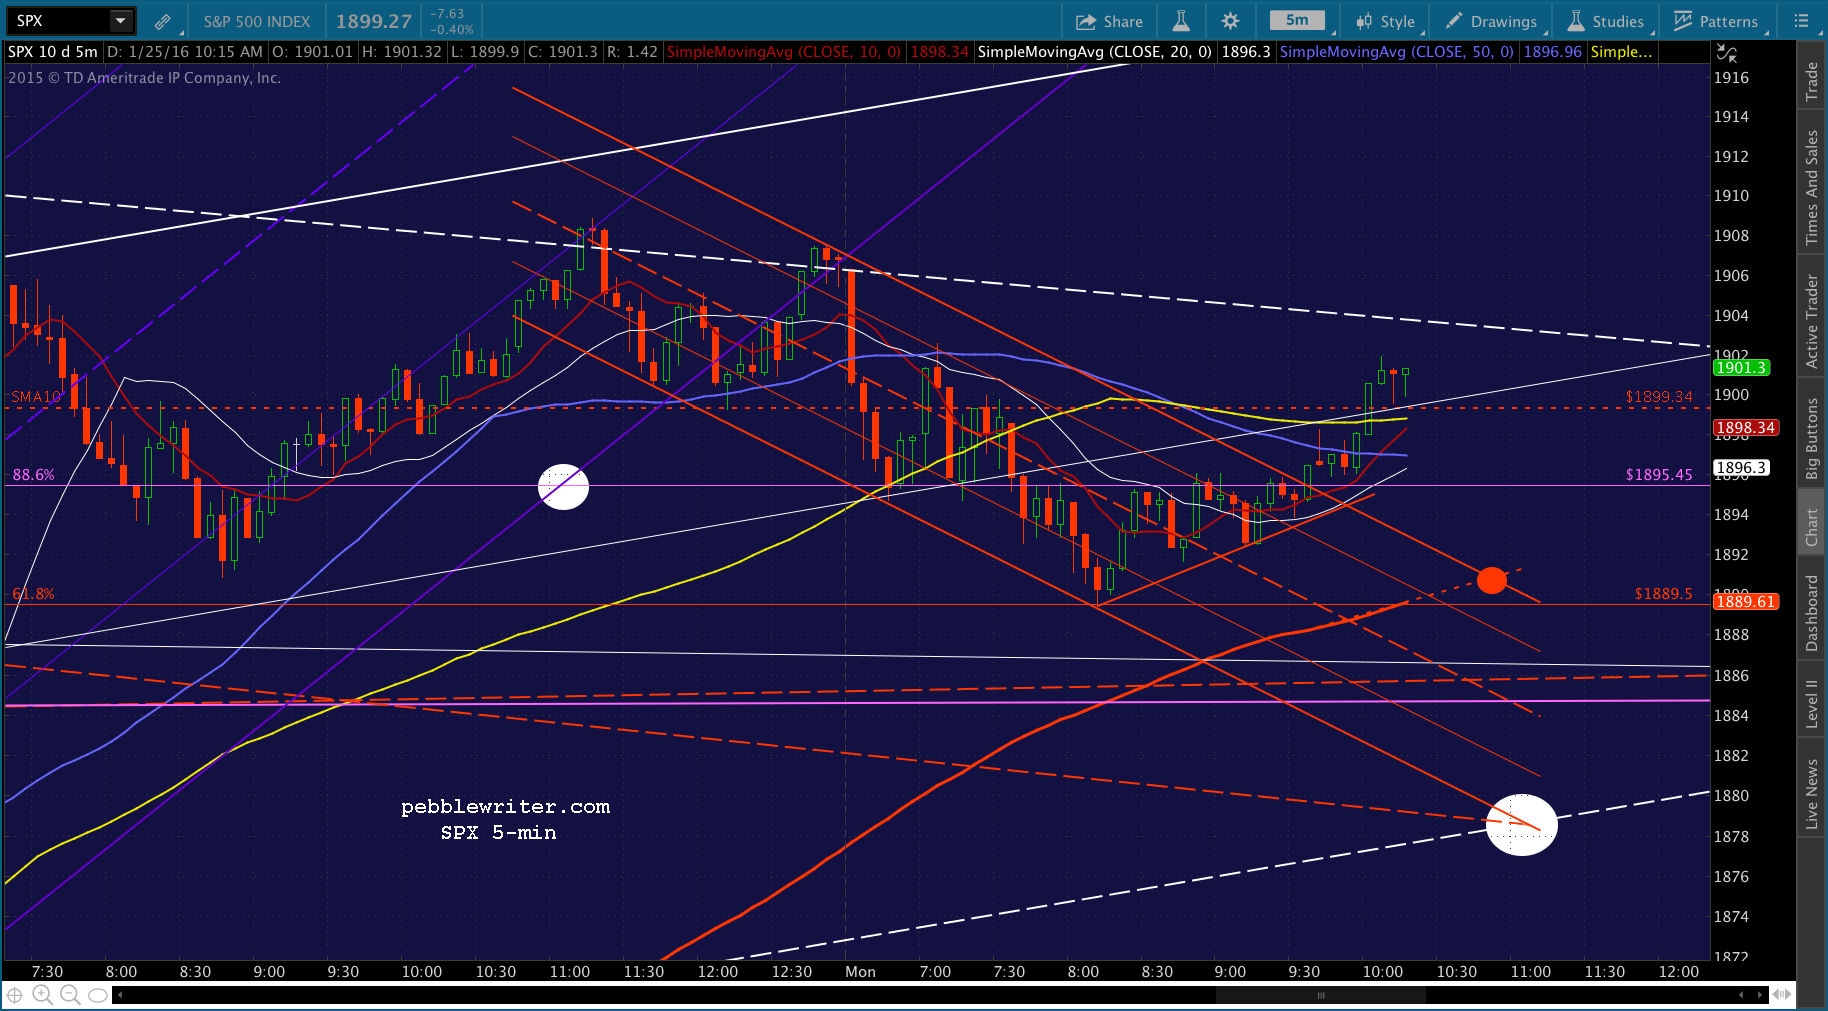
We’ve seen many instances lately of obvious downside targets being averted early in the session, followed by a gradual meltup that erases the early losses. Then, there’s either a sudden decline towards the end of the day or a gap down the following morning. No reason to think today is any different — but hard to figure out the timing, as it goes from watching paint dry to a sudden plunge in seconds.
UPDATE: 1:48 PM
Speak of the devil…. Shorting here again on the USDJPY and CL decline. Should get that red channel backtest at the SMA200.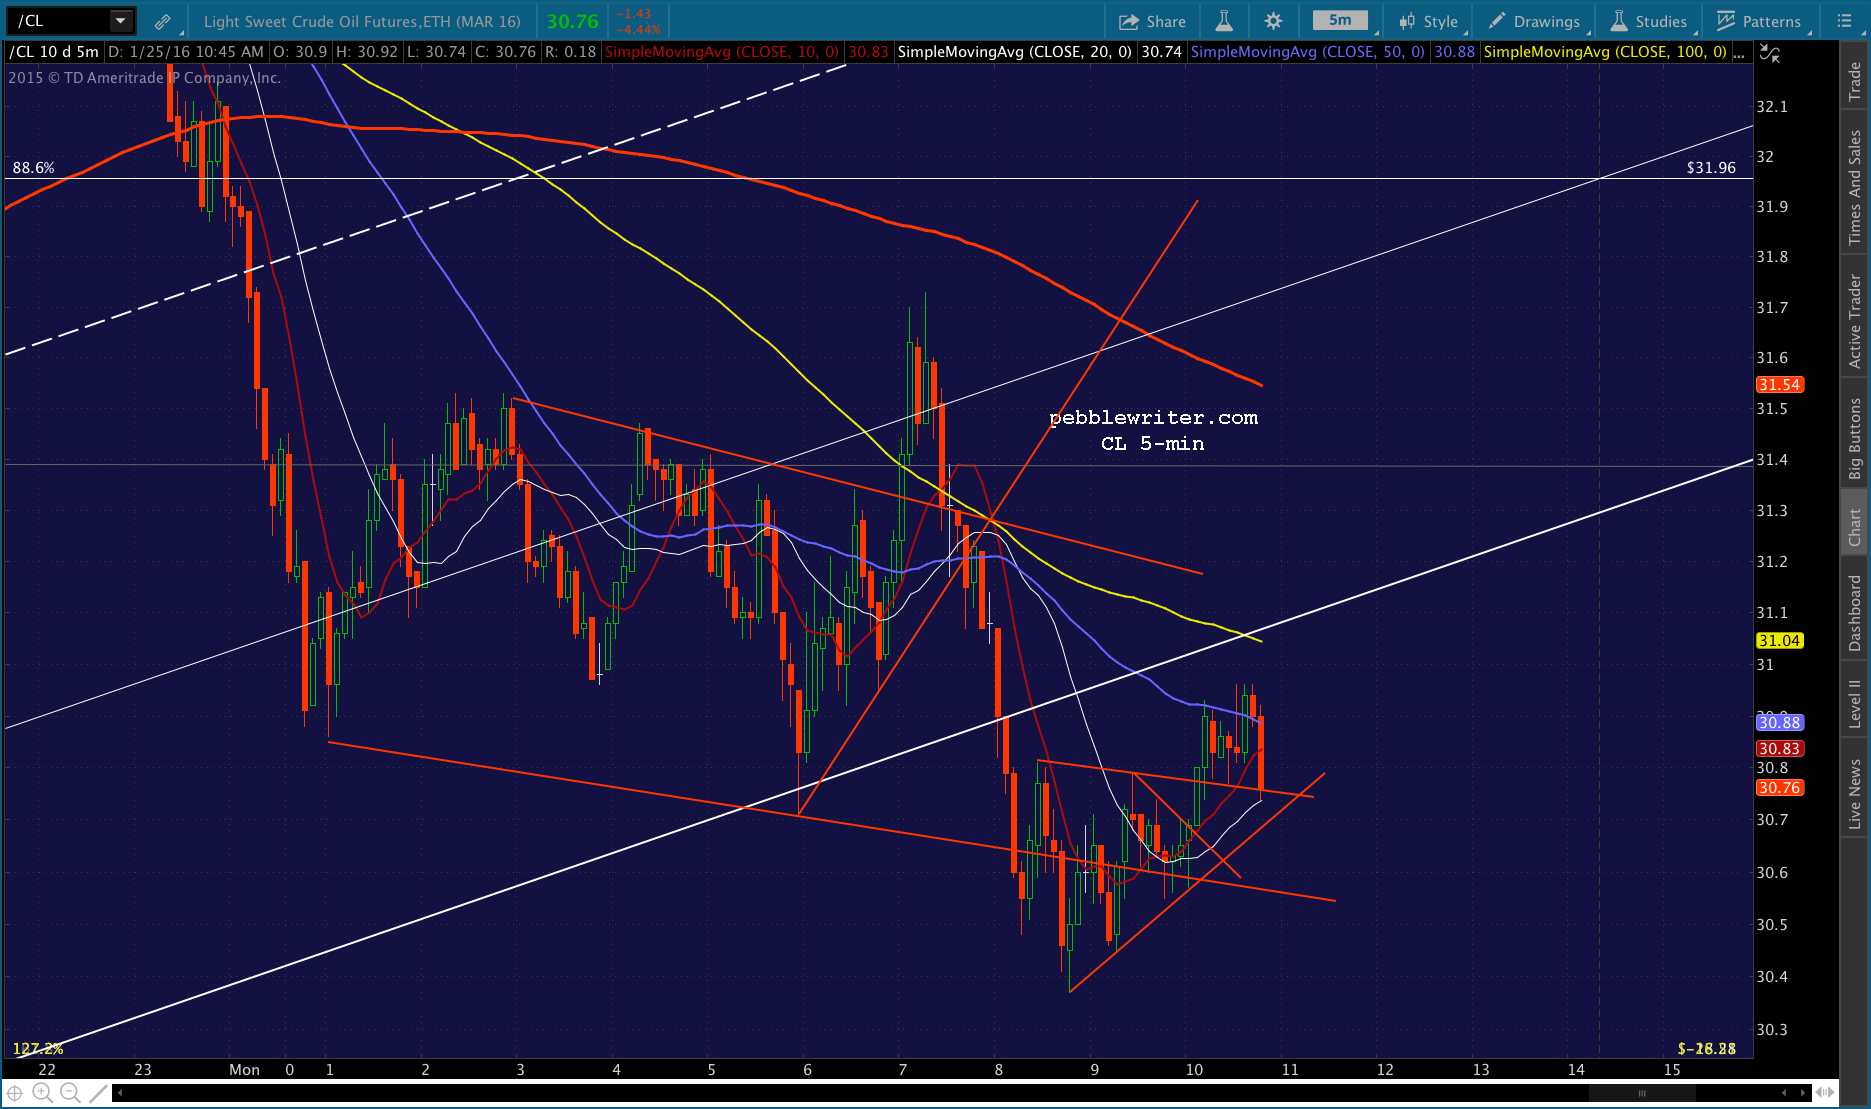
 ES reaching purple midline support – watch out for a bounce.
 UPDATE: 1:56 PM
USDJPY testing the purple channel bottom.  If it fails, here’s an alternative falling white channel that gets SPX to the neckline in the next 15 minutes or so.
  UPDATE: 2:27 PM
SPX finally tagged the SMA5 200. Back to cash at 1891.77.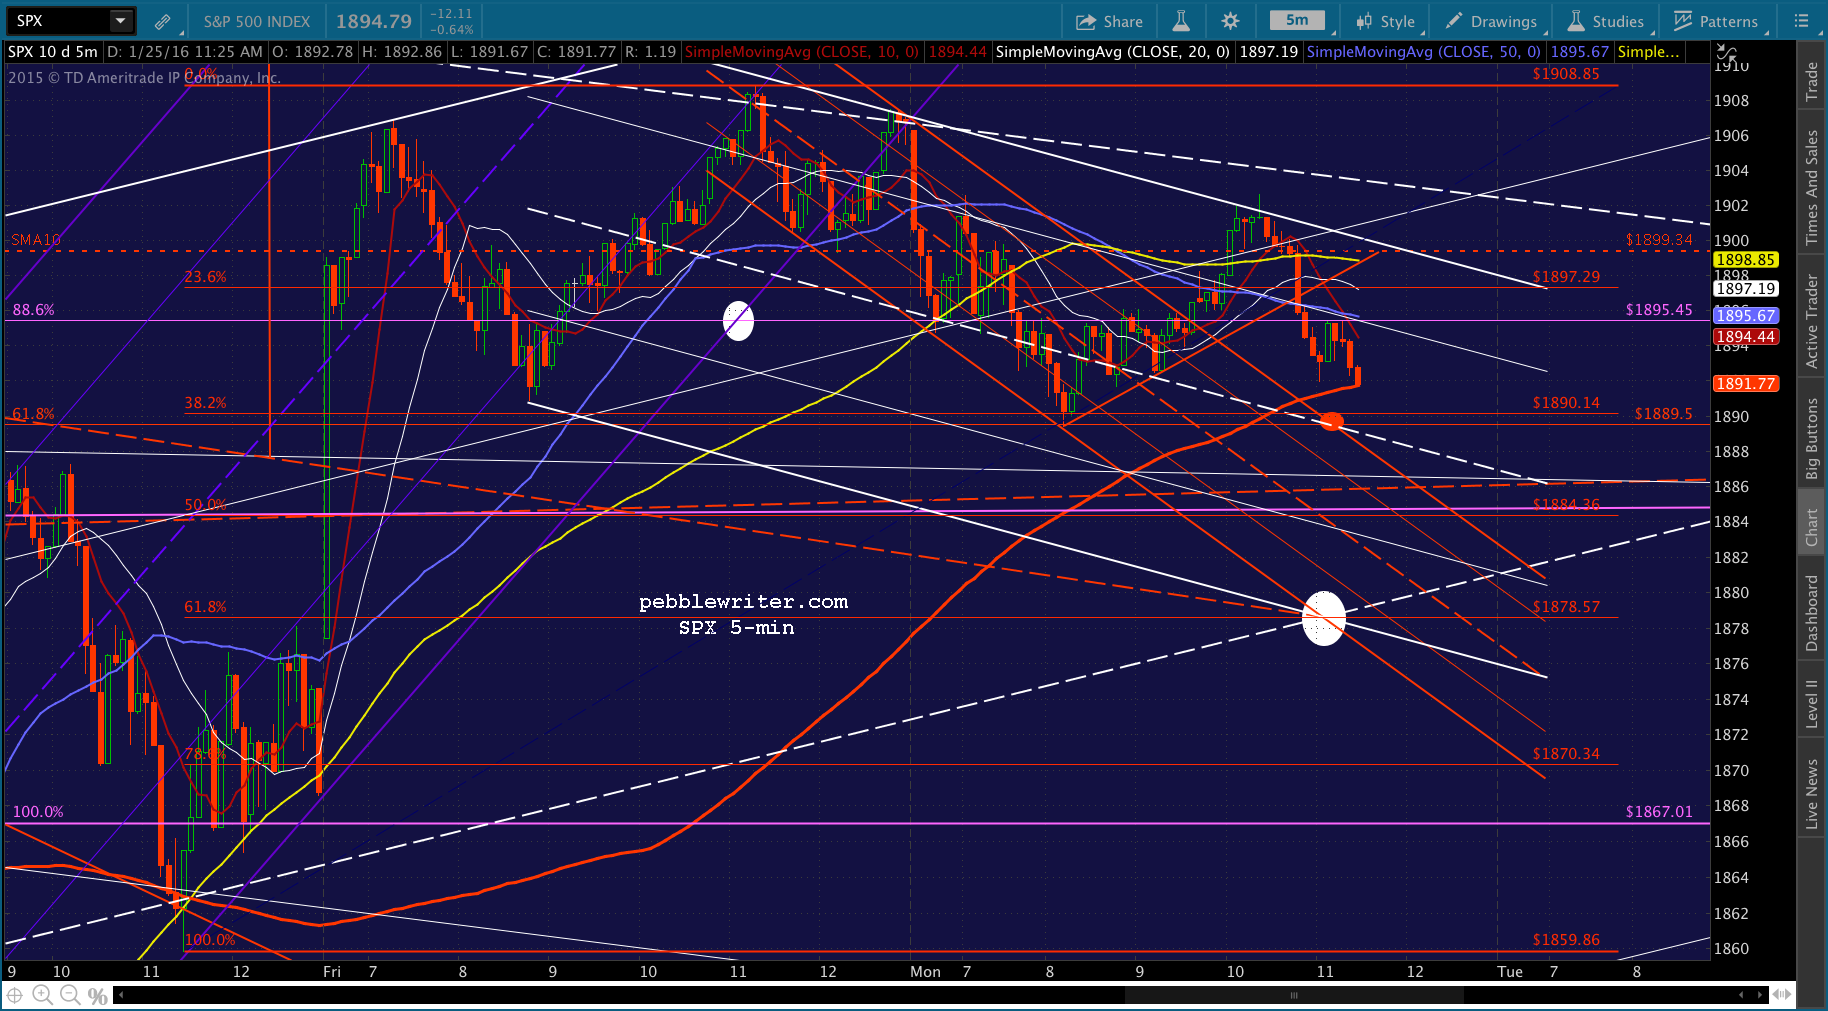

 UPDATE: 2:30 PM
Trying another short here at 1893.81 the SMA5 10 in case there’s another leg down as ES, CL and USDJPY are suggesting.
 UPDATE: 2:52 PM
We usually get a bump around the 3:00 hour, and CL is approaching a TL from early this morning. So, watch your stops. This would be an ideal time for a backtest of the SMA5 200 at 1882 as the SMA5 10 crosses.

 UPDATE: 3:26 PM
That seems to be about it. I’ll revert to cash here at 1881.68. Although there seems to be at least a little more downside to the neckline, I’d stay in cash overnight just in case unless you’re able to hedge or keep a close eye on things.
 UPDATE: 3:28 PM
USDJPY and CL are signalling more downside. Back to short for the .618 at 1878.57.

 UPDATE: 3:36 PM
That’s better. I’ll revert to cash here at 1877.24 — the neckline and white channel bottom. EOD:
EOD:
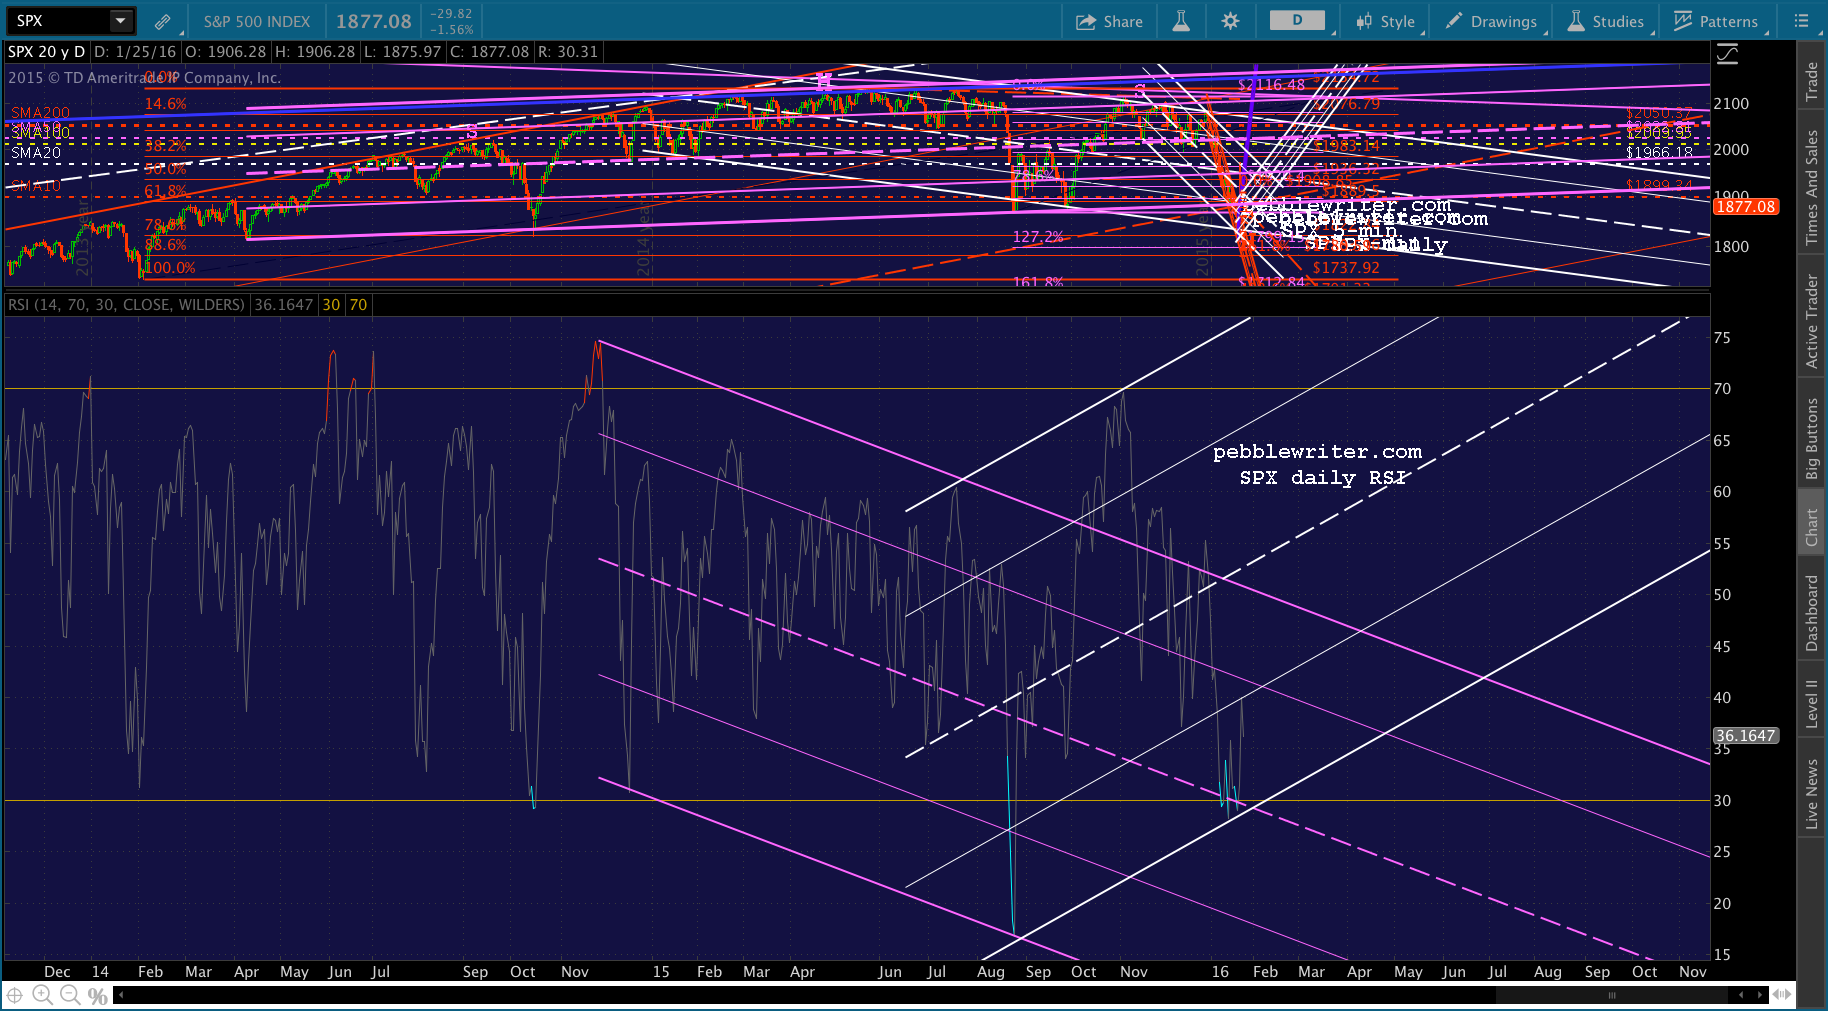
In response to Reeodd’s question about the VIX divergence… The Aug 24 decline was much stronger than the Jan 20 one. Note the difference in RSI between the two. While I have your attention, note how perfectly the channels fit the RSI except for the overshoot around Oct 23.
This was the push up through the falling channel top and the SMA200. Once RSI fell back within the falling purple channel in late December, SPX’s decline got underway with renewed vigor.
 If you’d like to know why the actual VIX calculation was much higher last August, you’d need to look at the way it’s calculated. Rather than copy and paste, I’ll direct you to the Investopedia article, which does a better job than I would.
http://www.investopedia.com/articles/active-trading/070213/tracking-volatility-how-vix-calculated.asp
Comments
4 responses to “Charts I’m Watching: Jan 25, 2016”
Pebble, What do you make of the VIX divergence. August 24 low produced a VIX high of 53.29 and the lower low in the SPX on January 20 only produced a VIX high of 32.09
Great question. The Aug 24 decline was much stronger than the Jan 20 one. Take a look at the RSI chart and you’ll see what I mean. I’ll post one at the end of today’s entry.
whats the target on the inverse head and shoulder thanks
1969