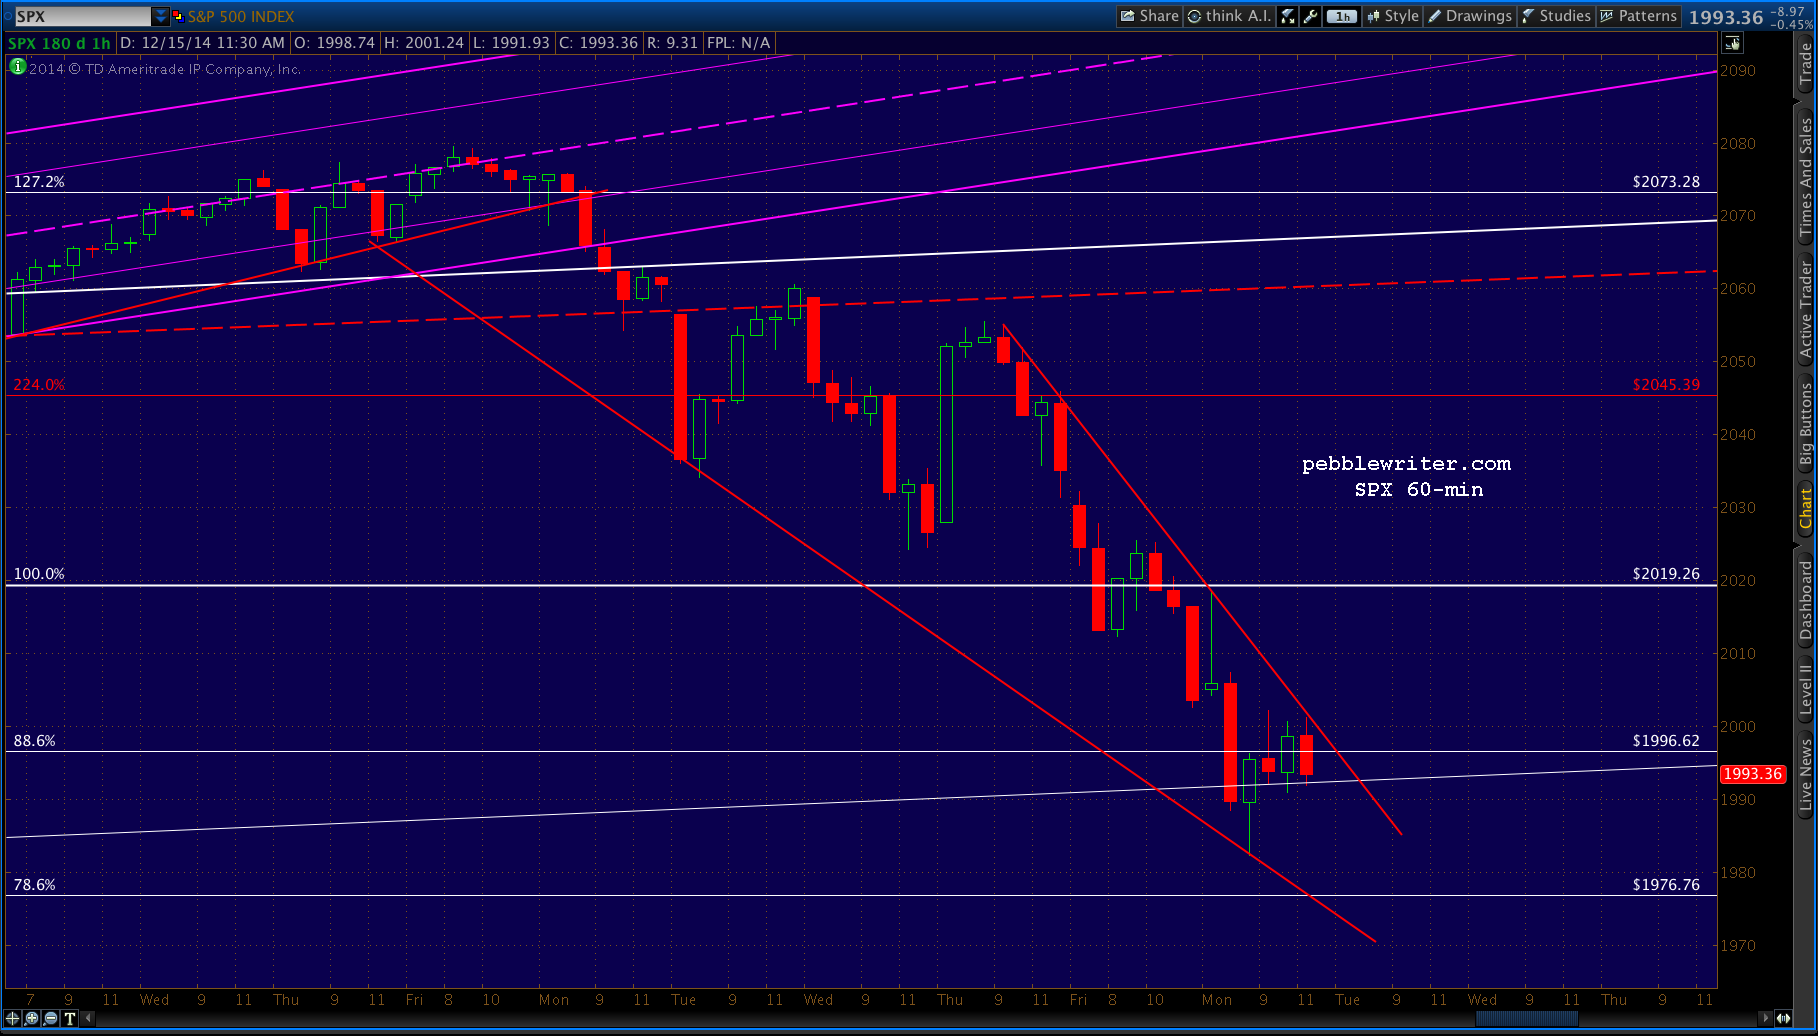
SPX came very close to Friday morning’s downside target of 1996:
If USDJPY continues to slide or even (horrors!) actually declines, SPX is going down. In that event, the SMA50 or SMA100 could team up with the .886 to provide a stop at 1996.
USDJPY did continue to slide, and SPX along with it. SPX dropped 33 points to 2002.33, just missing the SMA50 at 2000.75.
 The small red channel from above in more detail:
 In an unrigged market, SPX would continue down and tag the .886 or even .786. But, futures are pointing 16 points higher at present. As usual, it will depend largely on USDJPY.
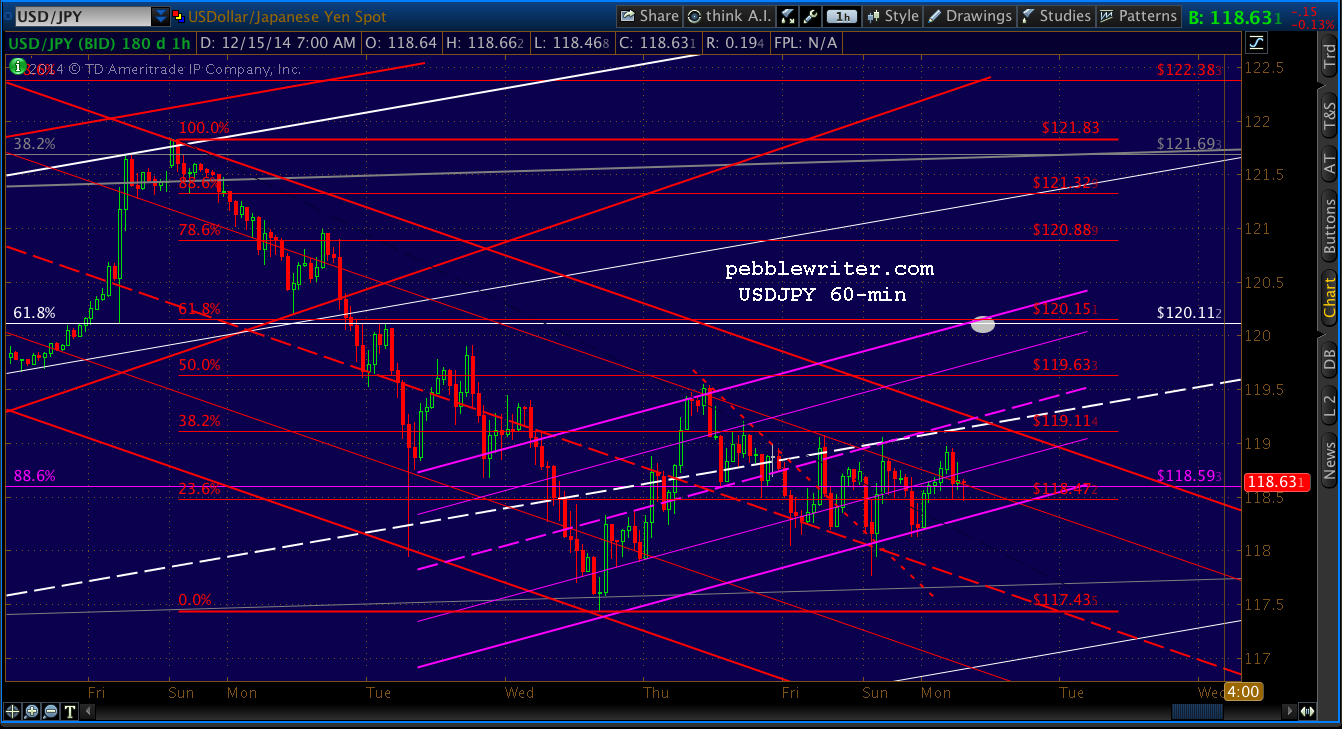
USDJPY moved lower into the weekend, but it was a higher low than seen earlier in the week. And, the pair is back above the purple .886. It was enough of an improvement to help boost futures. But, USDJPY is in a triangle until we get either a breakout or breakdown.
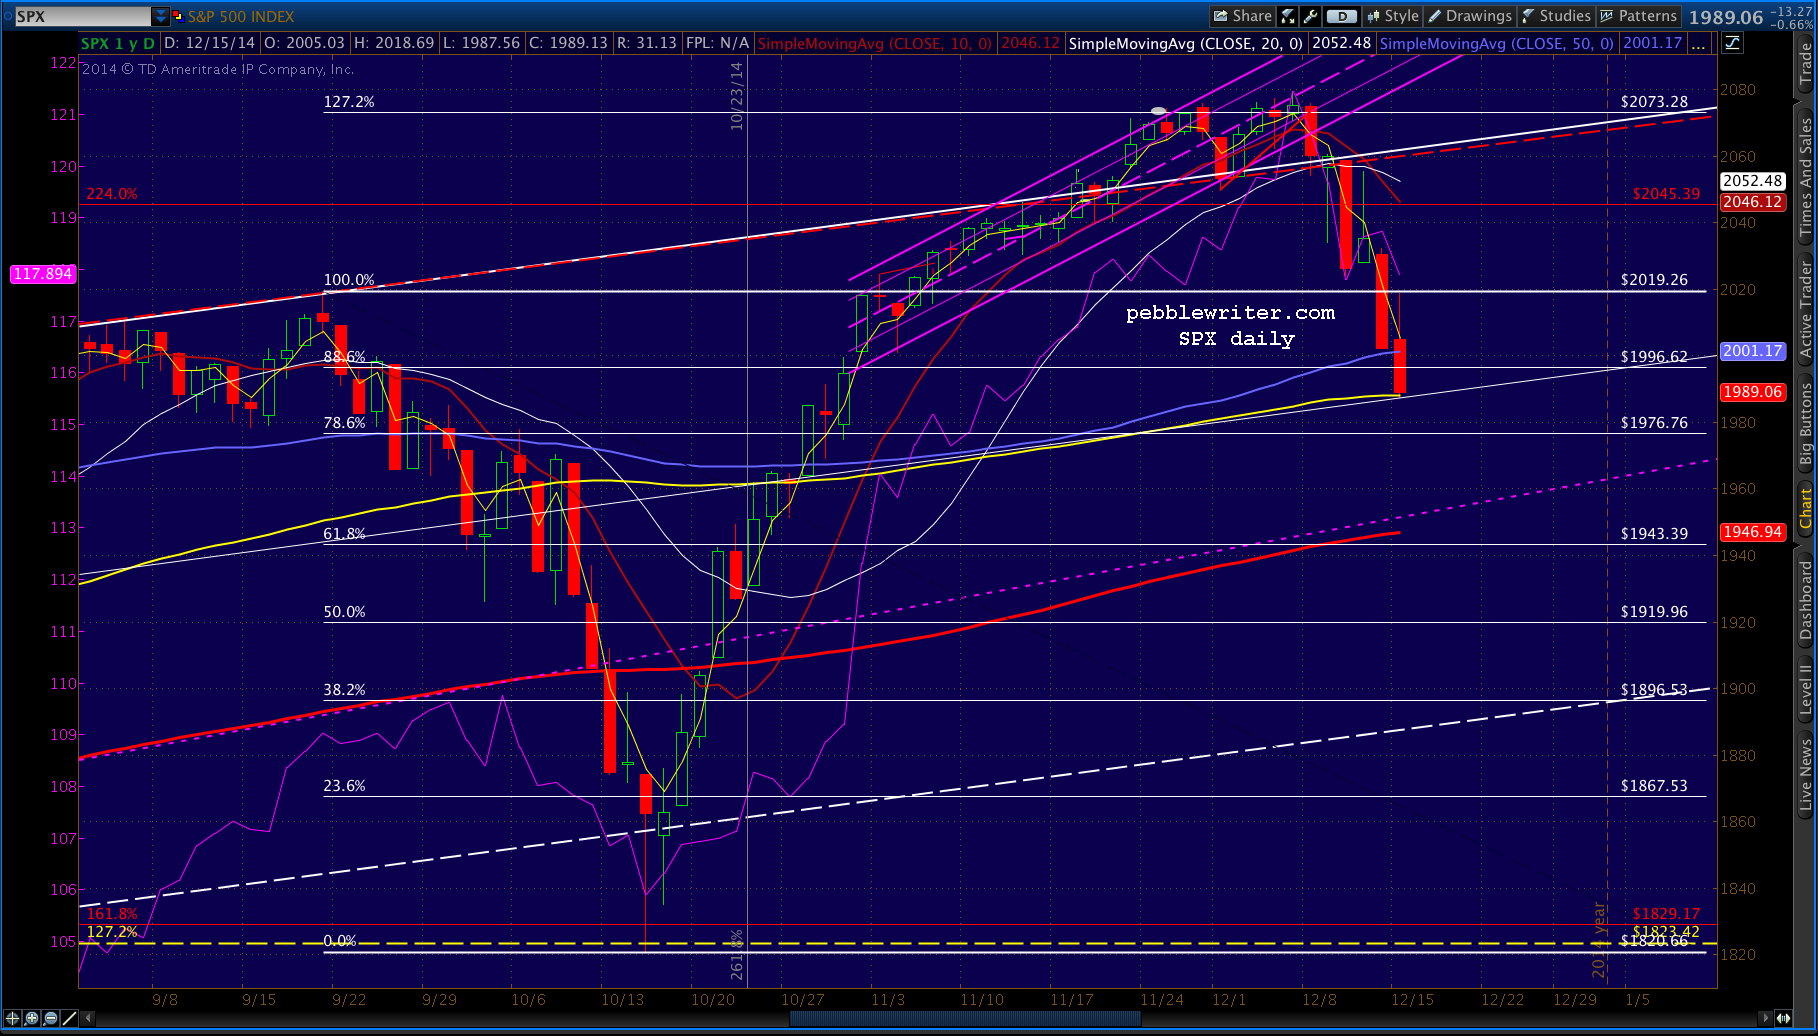
 SPX should test 2019 — the previous high and the red channel top. I’d be mildly surprised if we didn’t get a reversal there — whether or not it eventually breaks out.
I’d also keep an eye on the e-mini’s 50-period moving average on the 60-min chart (purple, below) — a fairly accurate short-term indicator lately.
 Assuming we get a reversal at 2019, what next?
continued for members…
It’s entirely plausible that SPX continues lower and actually tags the .886 at 1996 or even the .786 at 1976. The 50-day and 100-day moving averages are currently around 2002 and 1988, so that’s a nice cluster of support.
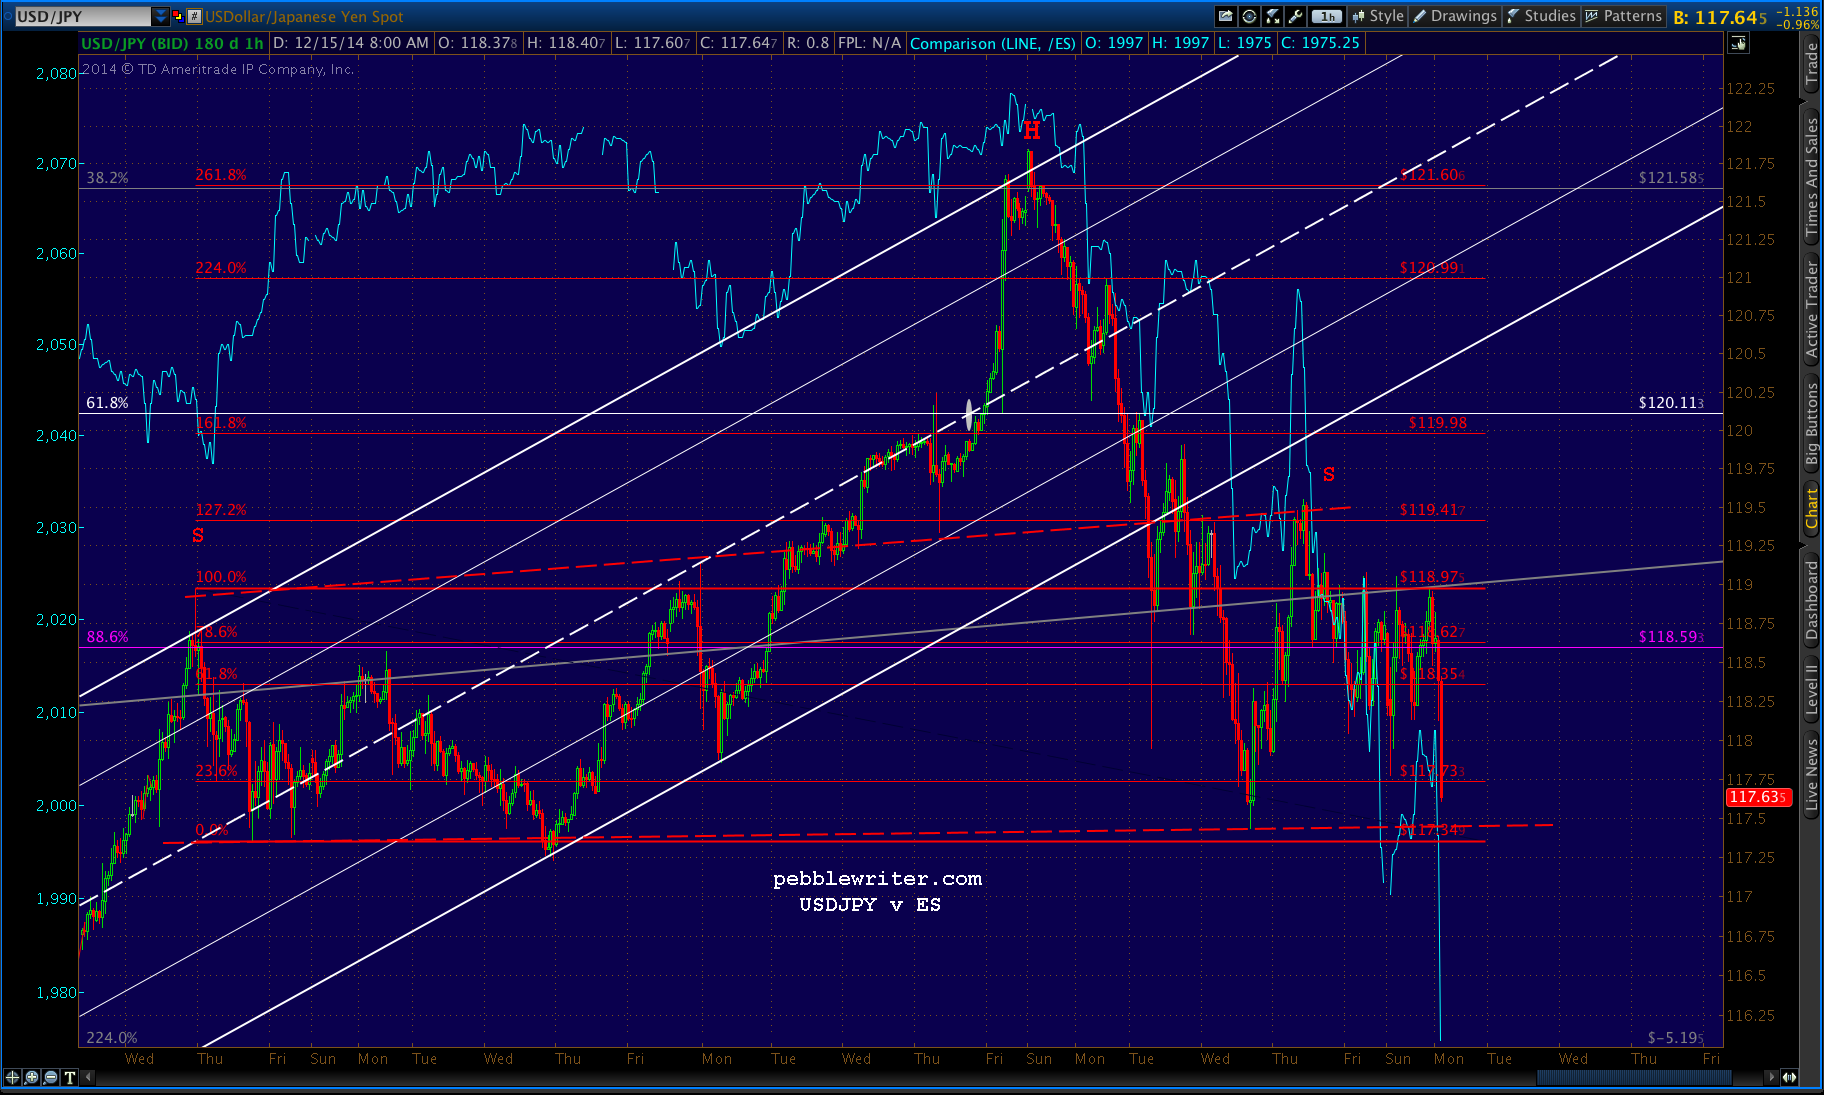
As bearish as the market has felt the past week, USDJPY is still hanging around the purple .886 and is within striking distance of the white .618 (the really important Fib level.)
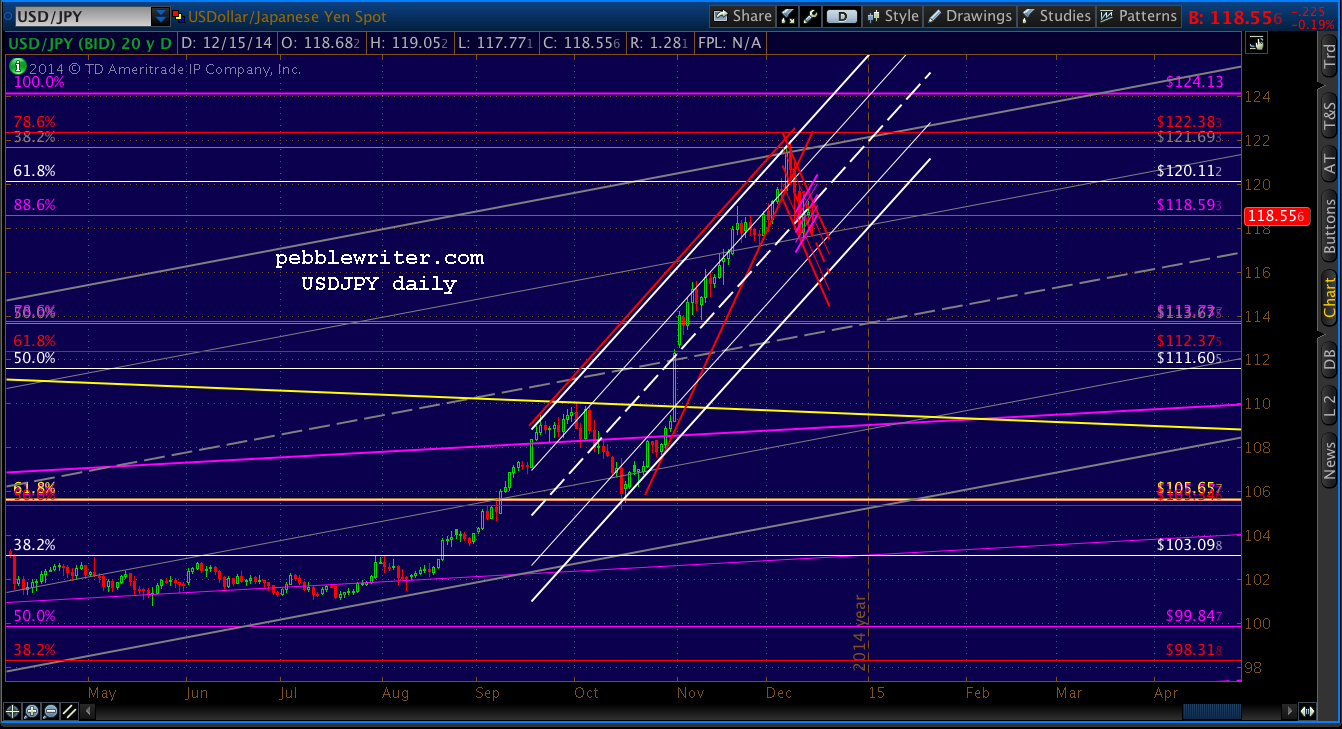 Note that the white .618 is also roughly .618 of the drop from the high at 121.83.
 Odds are USDJPY is going back to the white .618. If it reverses there, SPX is going lower. If it punches through, SPX will go on to new highs.
As we expected last week, USDJPY seems to be establishing a floor. As such, it can move sideways for many more days, basing for a move higher — which I expect it to make unless Yellen et al. rain on the bulls’ parade when the FOMC wraps on Wednesday.
If this week is like many in the past, SPX’s .886 or .786 tag might even come in the first 10 minutes following any announcements, then yield to algos that drive the “market” significantly higher toward our year-end target of 2138-2141. I wouldn’t be surprised to see the algos driven by USDJPY moving back above the .618.
But, that’s all conjecture. Simply let USDJPY be your guide, and keep an eye on its relevant channels and Fib levels. Today, it’s job is to stay in the rising purple channel — a flag pattern. If it drops below, then we can pretty much expect SPX to seek out one of the targets mentioned above.
UPDATE: 11:30 AM
SPX got most of the way to our 2019 target, reversing at 2018.69 and heading south in a jiffy. It just reached the SMA100 and looks like it might reach the .786 at 1976.76.
 I think it would be worth trying a long position here for a good-sized bounce, but with tight stops. Why?
USDJPY is nearing that floor we’ve been discussing. If it plunges through, we’re looking at a completed H&S Pattern. That would be potentially devastating for stocks. SPX has fallen about 100 points since USDJPY fell 4.40.
Another 4.40 would theoretically translate into another 100 points. H&S don’t always work very well with currency pairs. But, whether you call it a neckline or a floor, breaking 117.34 would be quite risky for the bulls.
 Just watch for ping-ponging, as the SMA50 at 2001.37 is now resistance.
UPDATE: 3:20 PM
SPX ran all the way up to the resistance mentioned above, topping out at 2002.22 and tagging the SMA50. From here, it gets a little trickier.
I’m 50-50 on this, but my best guess is it goes down and tags the .786 to coincide with 10-yr yields slipping a little further (2.05%) and maybe even a dip to or below 117.45 for USDJPY. Crude light (CL) also has a bit further to fall before the next support level at 50.76.
But, I don’t think it makes sense to hold a short position into the close. If it should slip futher and tag 1976.76, maybe I’d consider a long position. But, otherwise, I think cash is a very good place to be — especially after a nice shorting opportunity this morning, and a great bounce off the SMA100.