

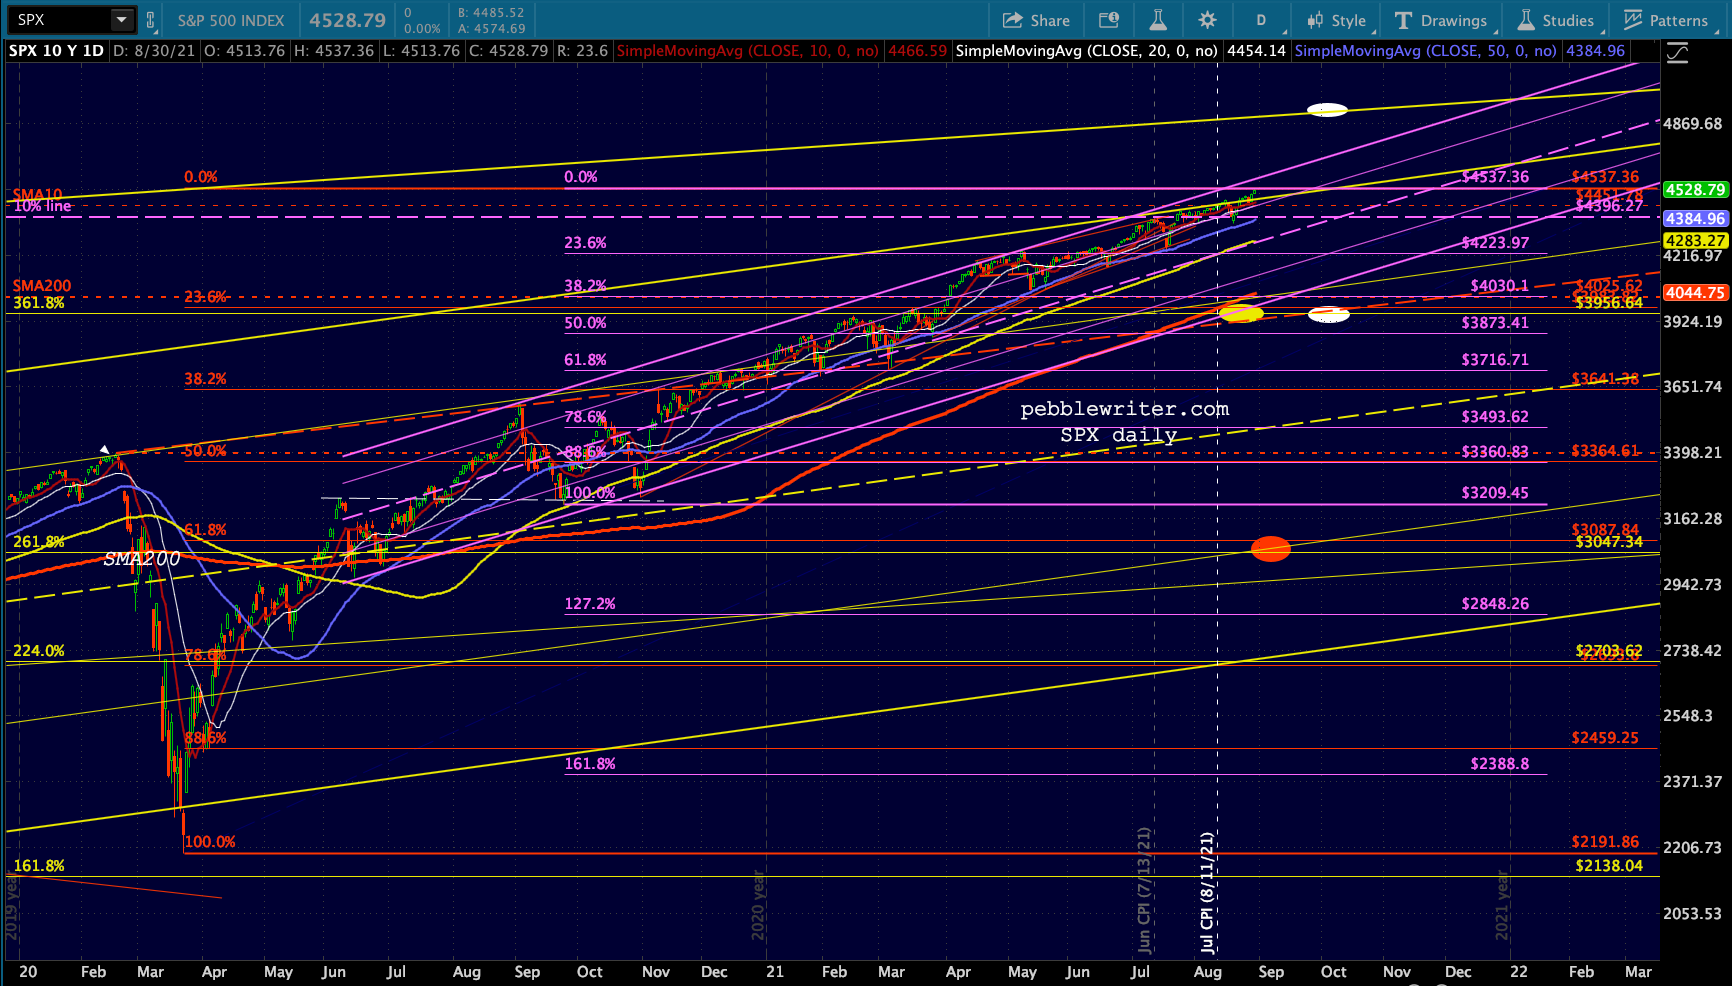
Stocks are drifting lower this morning as we close out the month – the 7th positive month in a row. A number of important patterns are being tested, including a Fibonacci fan from the Aug 19 lows.
 continued for members…
The big picture hasn’t changed. There is a narrowing window of opportunity for bears to wrestle ES/SPX down to the 3.618 extension.


 FWIW, I can’t help notice that the red .618 retracement now lies on top of its yellow 2.618 extension at 3076. We’ll keep an eye on this as the 2.618 was never properly backtested following the early 2020 crash.
 A reminder: VIX remains in a bullish (bearish for stocks) 10/20 alignment.
 The falling white channel continues to dominate…
 …but the RSI chart shows a relatively strong TL support and positive divergence re the lows.
  USDJPY continues to flash technically bullish signs – above the SMA10/20 and the fan line from January. But, it’s just a matter of time before it breaks down.
 EURUSD is also stalling, even pushing above the little triangle upper bound.
 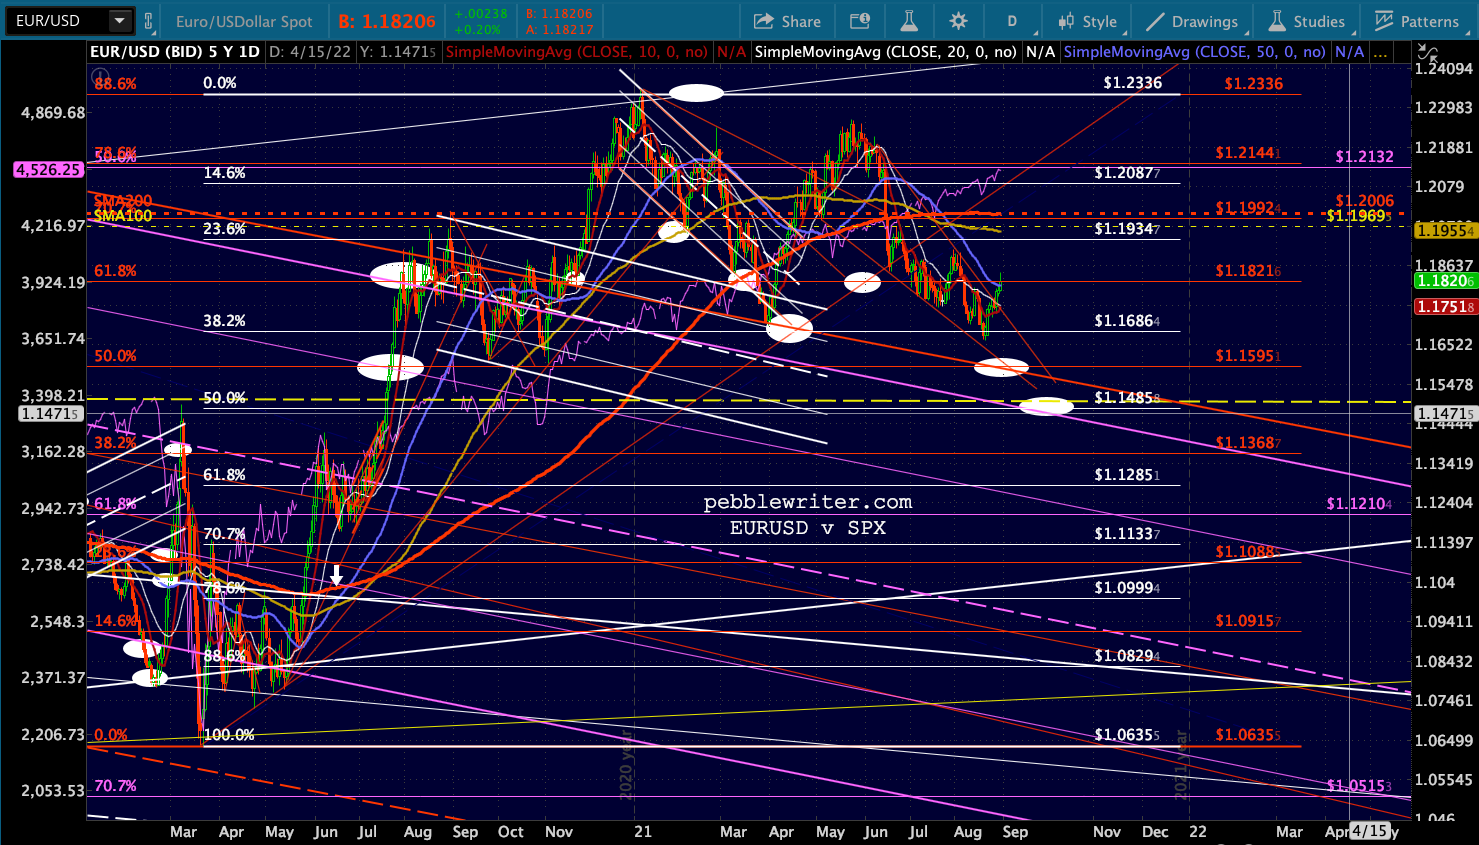 The resulting USD weakness shows in DXY breaking below the rising red TL from June – even though it will probably bounce upon backtesting the falling red TL from Nov 2020.
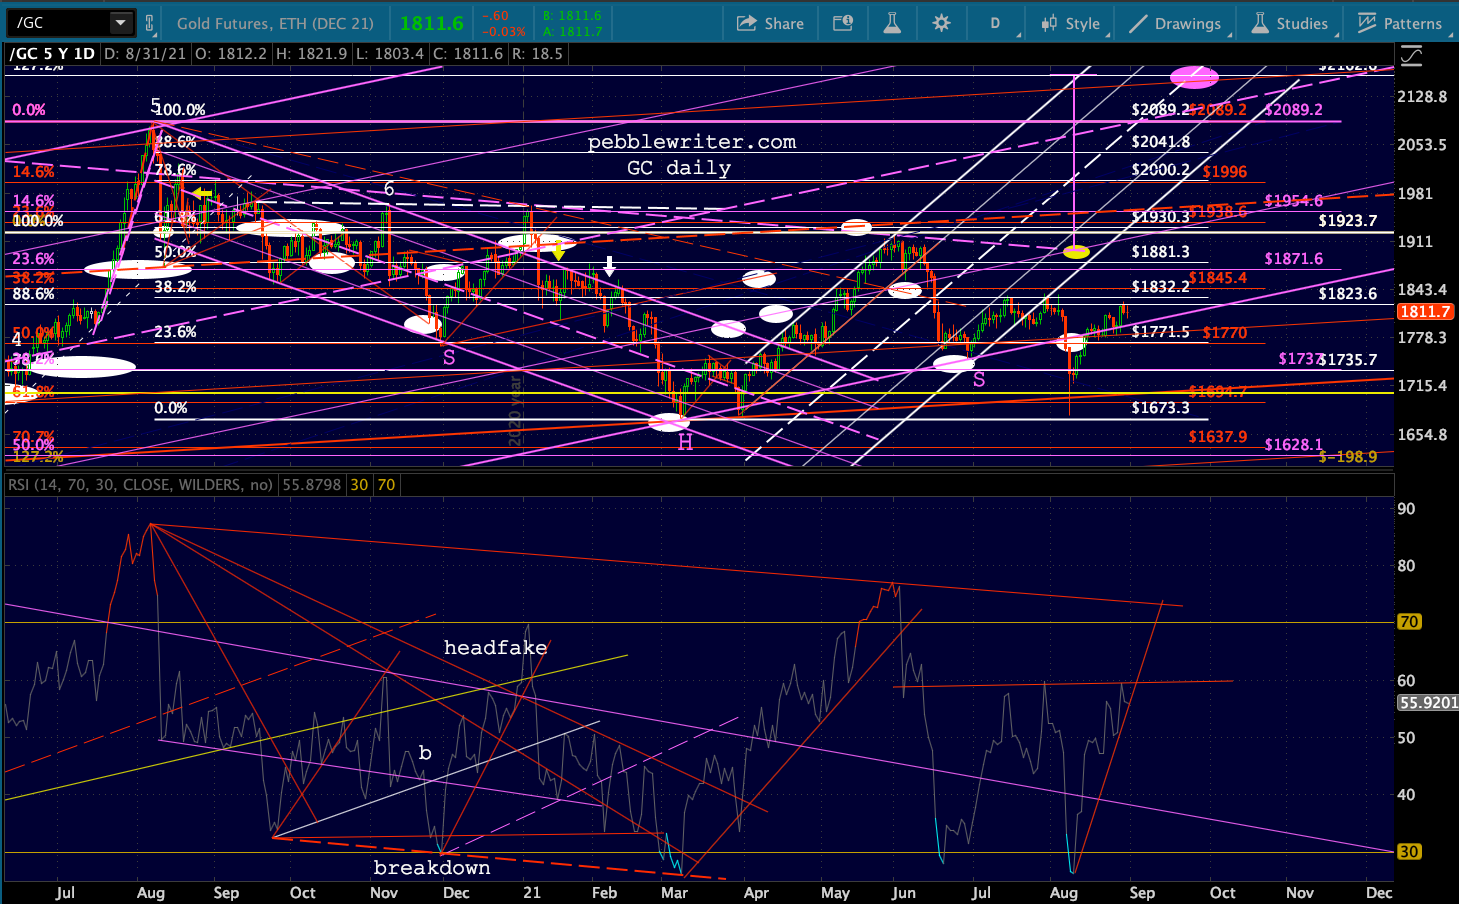
 GC and SI continue to eke out small gains. Though, again, these moves are not terribly convincing. GC is testing its July highs and is sitting just above its SMA200 – which it has been testing for the past several sessions.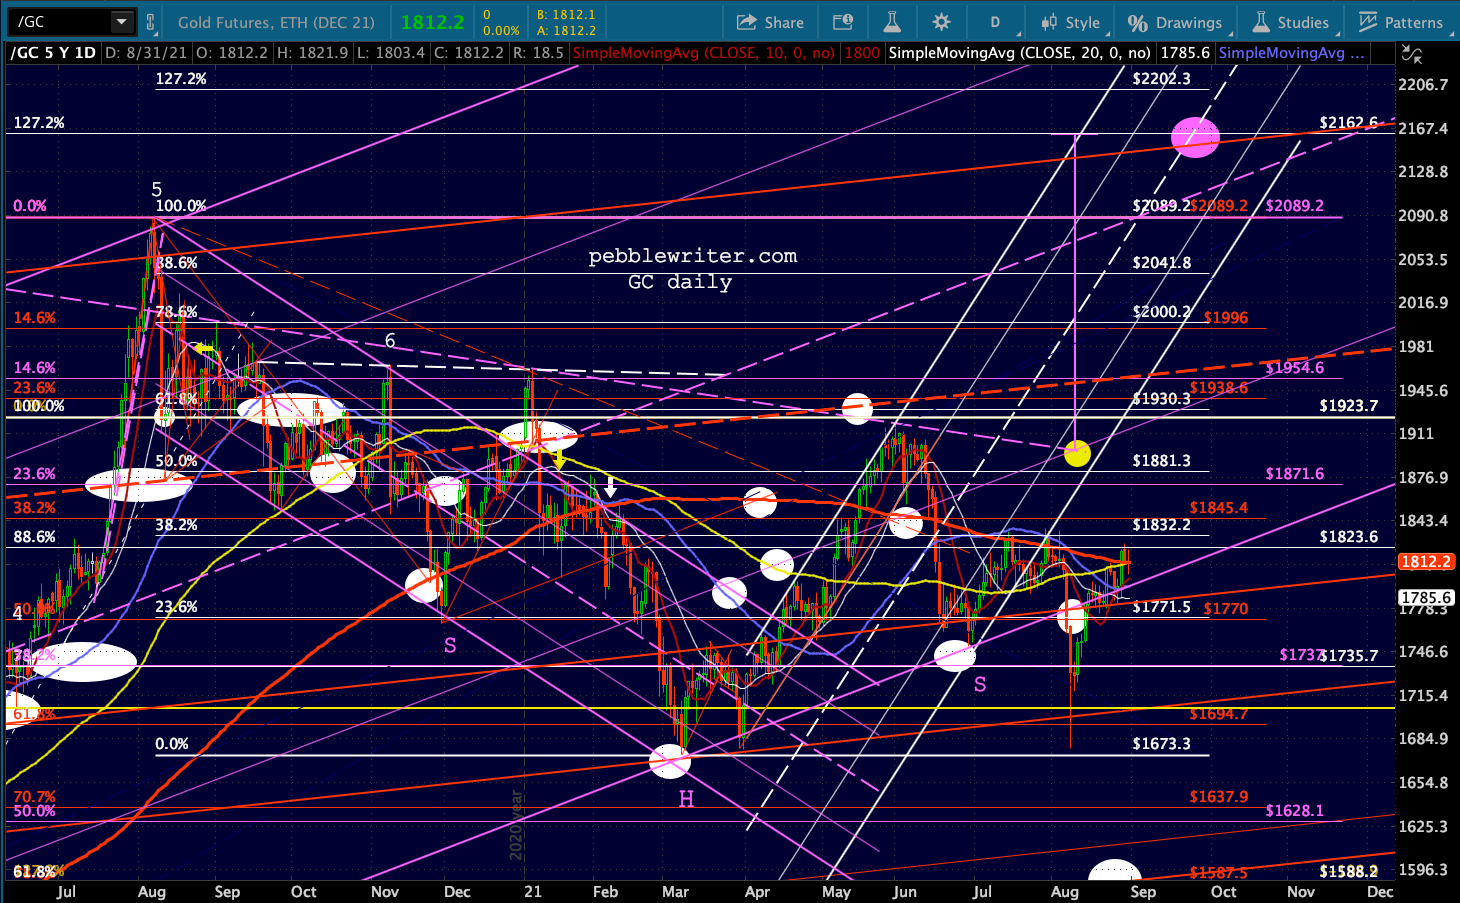
 And, SI has pushed through both its SMA10 and SMA20 with a TL from the June highs coming into view at around 24.75.
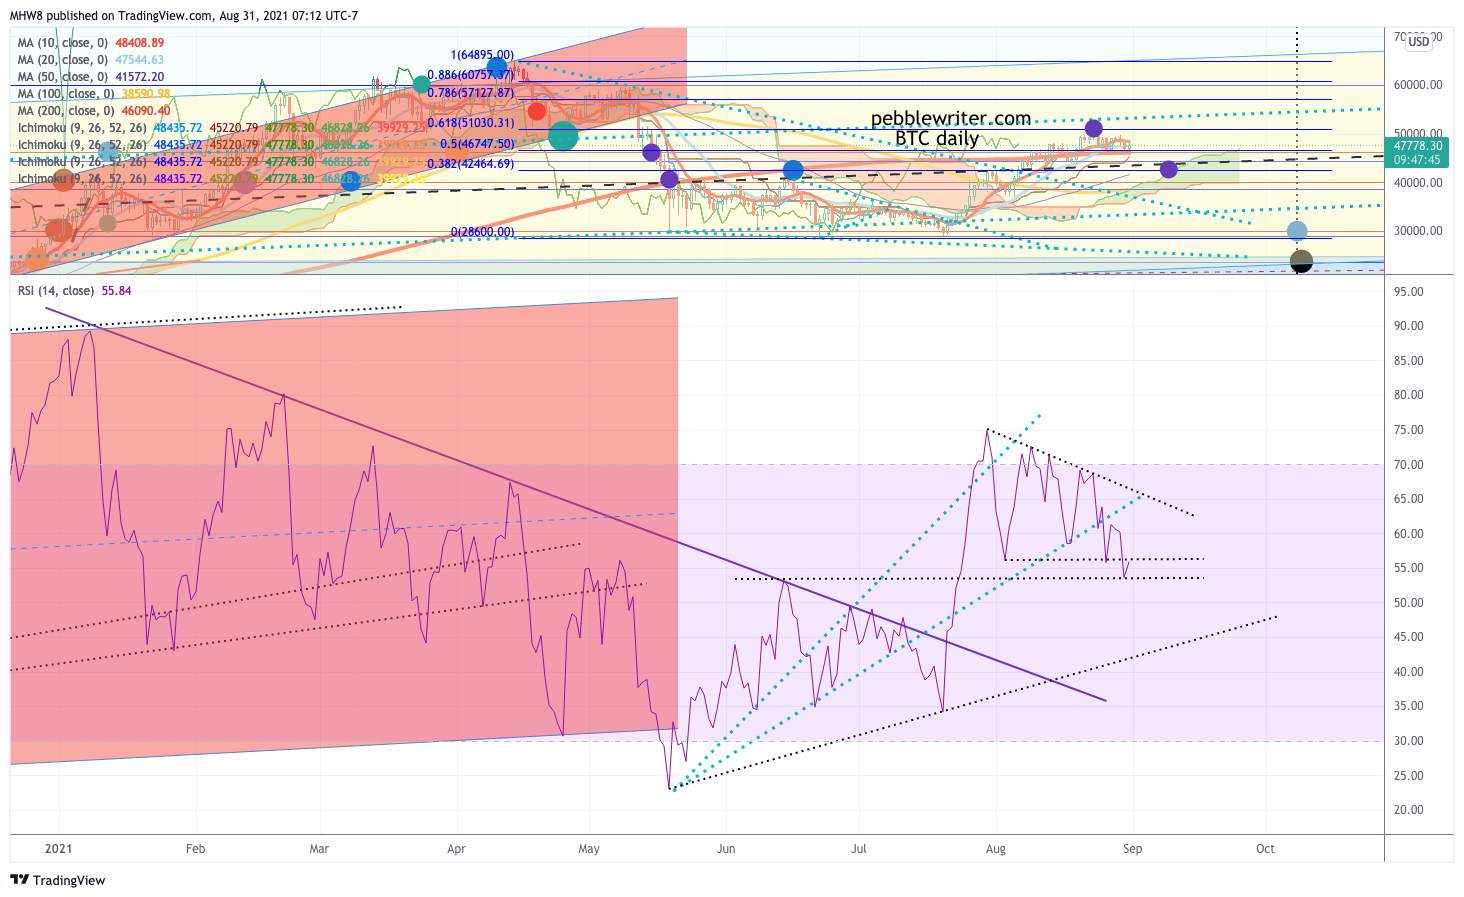
 BTC is still on top of its SMA200, but has gone nowhere since doing so. A drop through the SMA200 means the rally is over.
 CL and RB are both off about 1% this morning, but are still holding their SMA10s while eyeing their rising SMA200s.
 The bond market is likewise in a holding pattern. ZN is back inside the falling purple channel – though above the red channel bottom. It must commit to either a breakdown or breakout in the next week or so.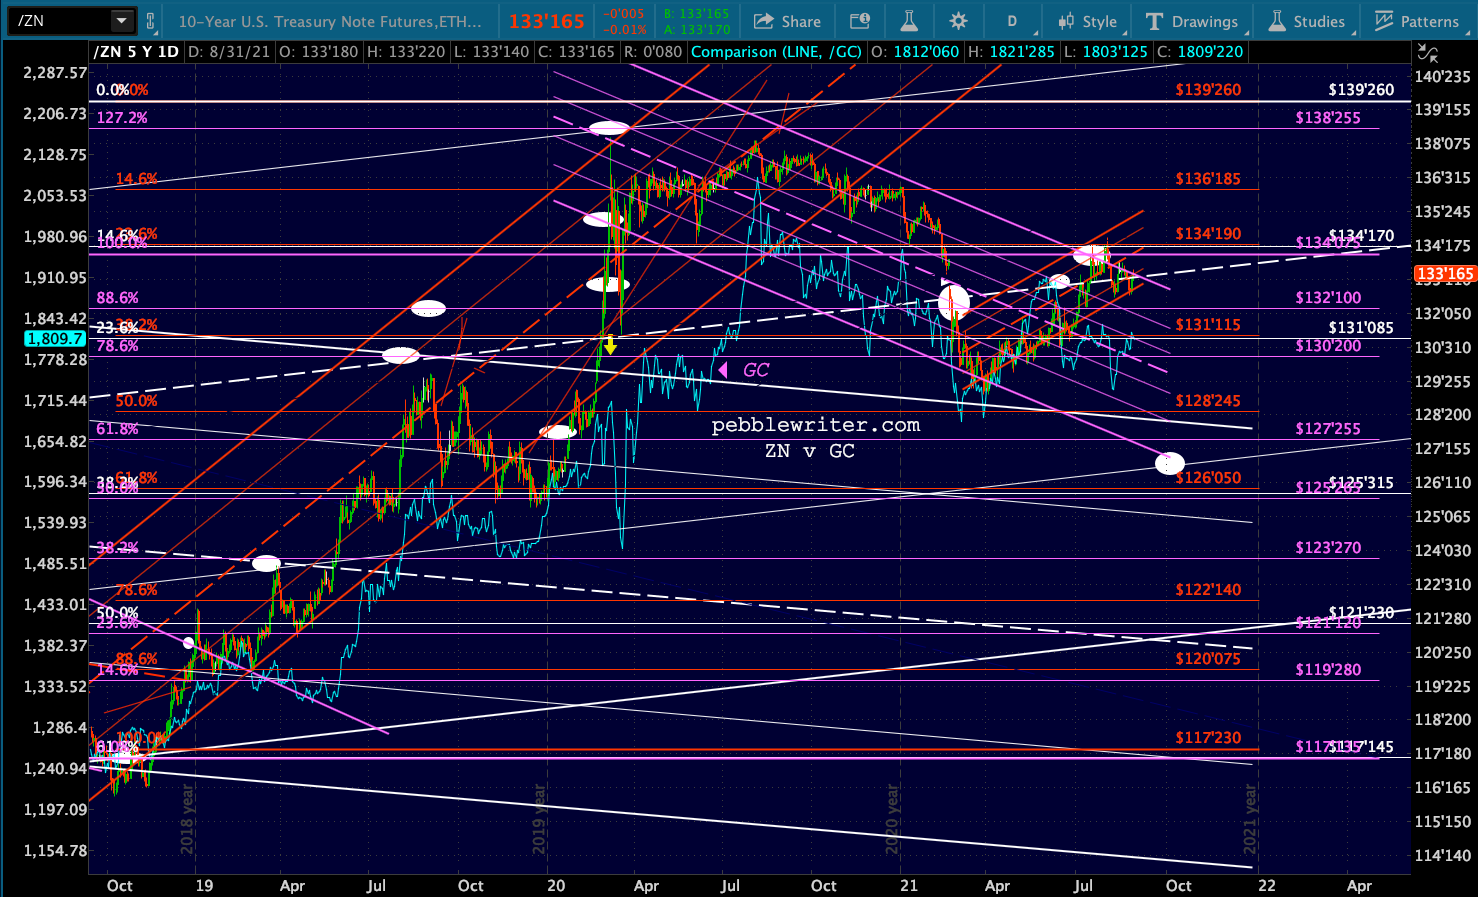
 Last, we take a look at NKD, which is often a good indicator of how much support equities will get from central bankers. It is still overdue a backtest of its yellow 1.618 extension – especially since experiencing a bearish 50/200 cross [a so-called “death cross”] two weeks ago. Dropping to 25,395 from here would be almost exactly a 10% correction – as would a drop by SPX/ES to their SMA200.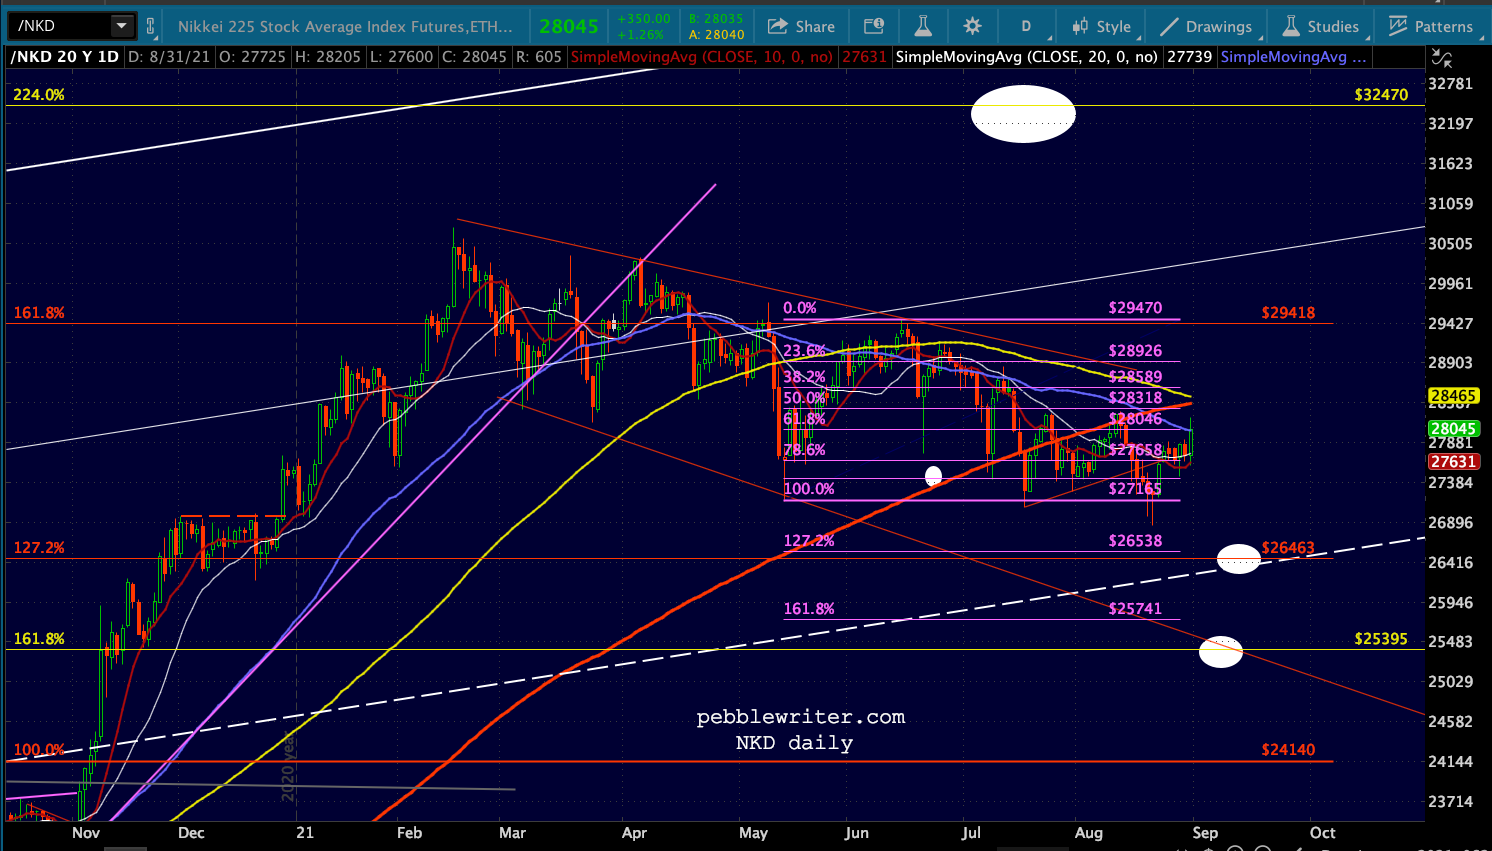
 GLTA.
GLTA.