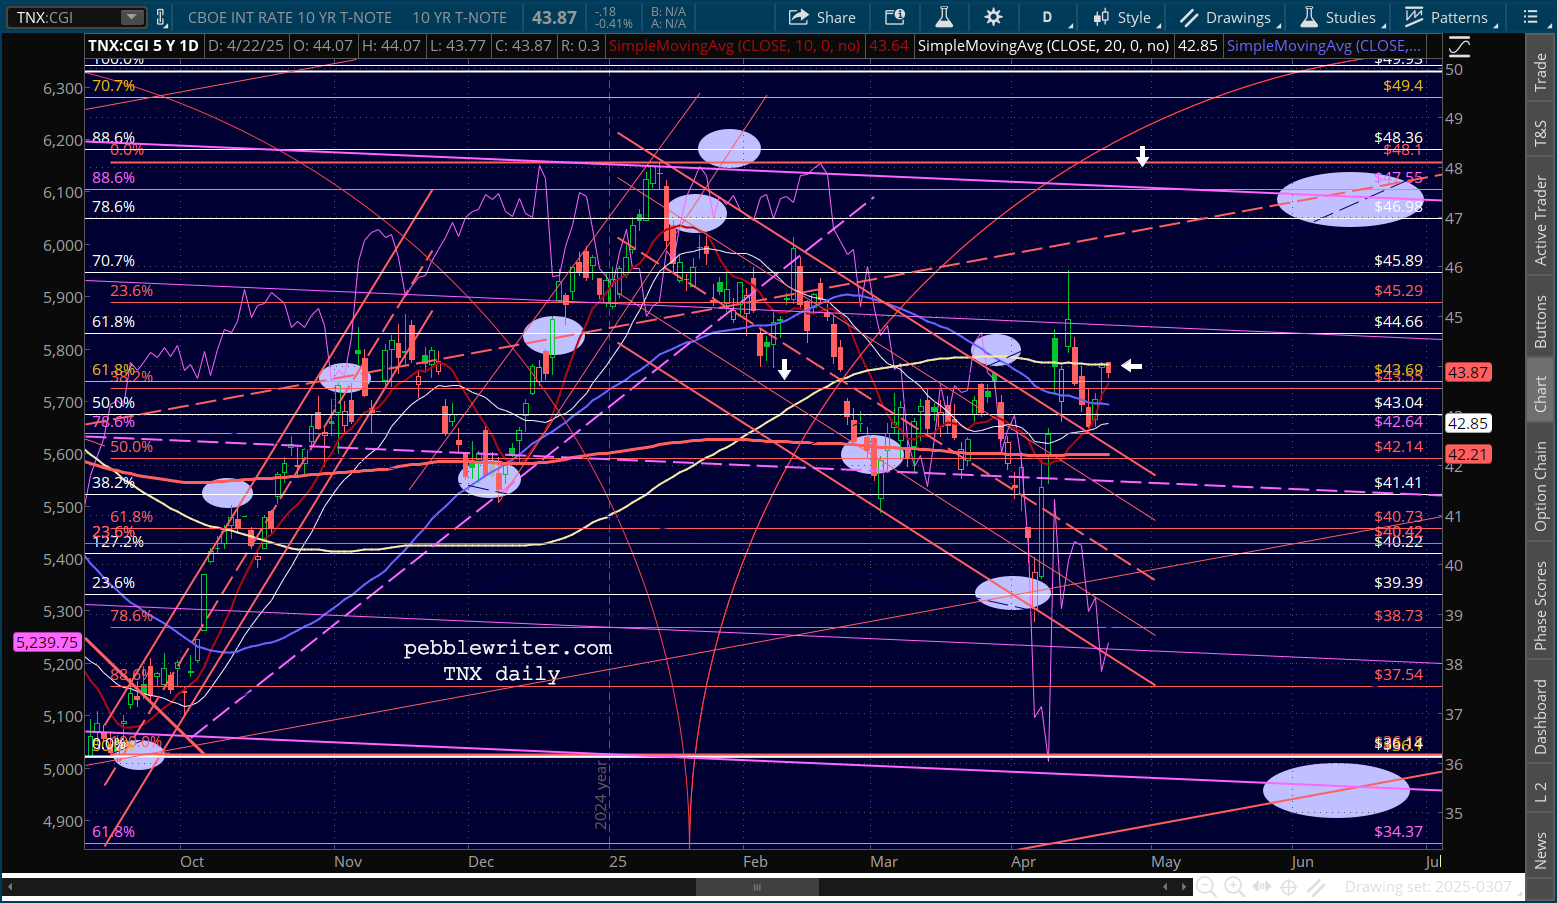
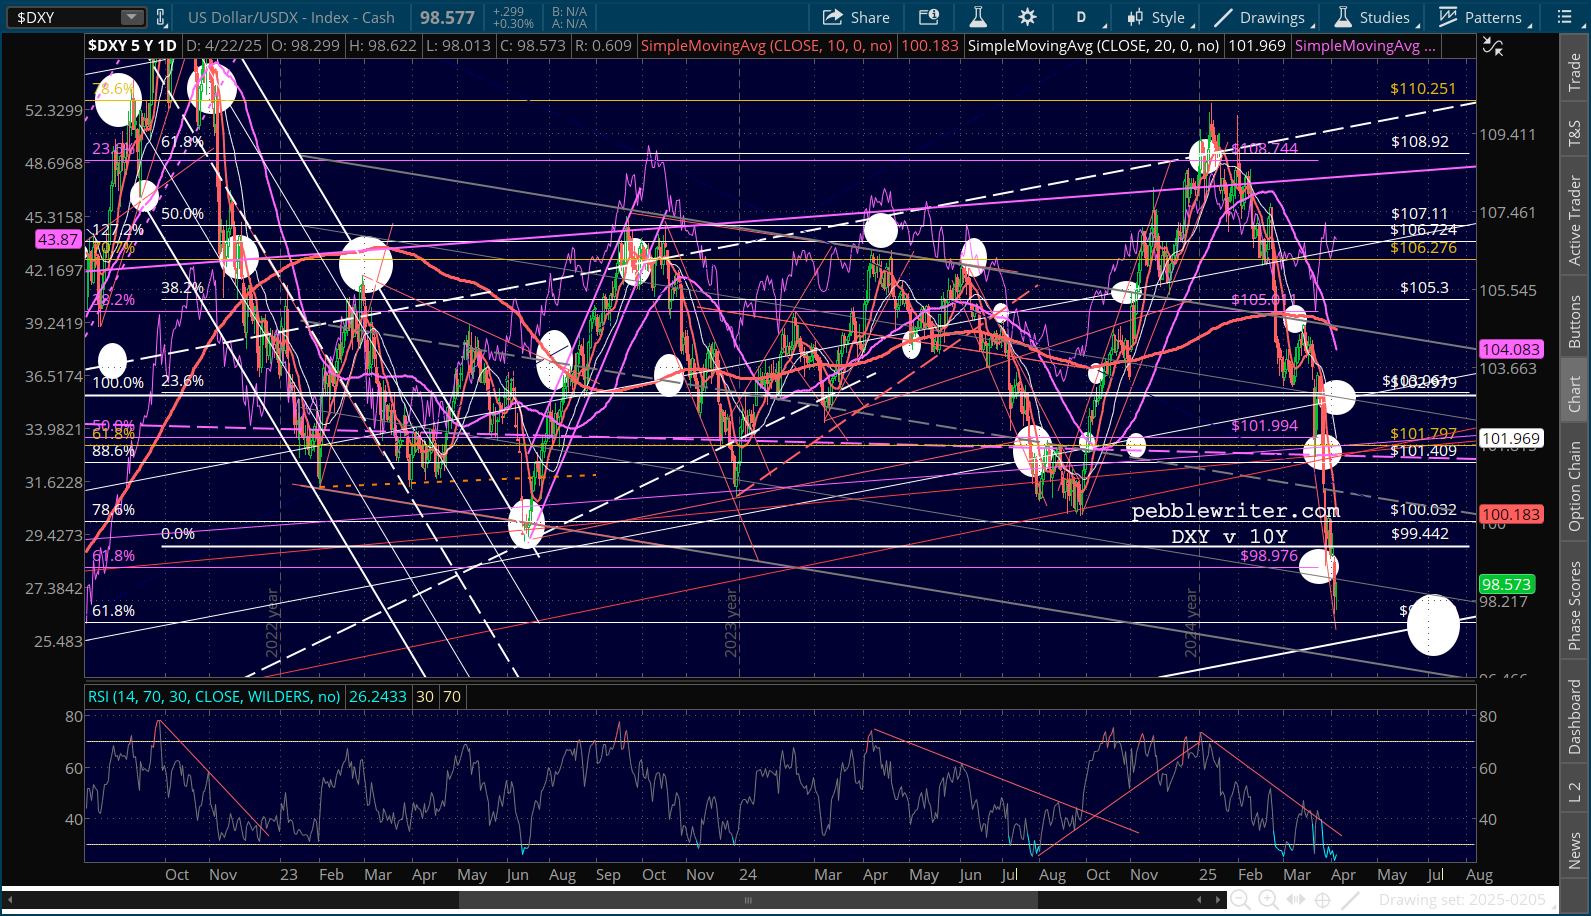
The 2s10s is still broken out. The 10Y is still broken out. The USD is still under pressure. Yet futures are up 50 points. At least one of these things is wrong.
 Thankfully, chart patterns offer a hint.
continued for members…
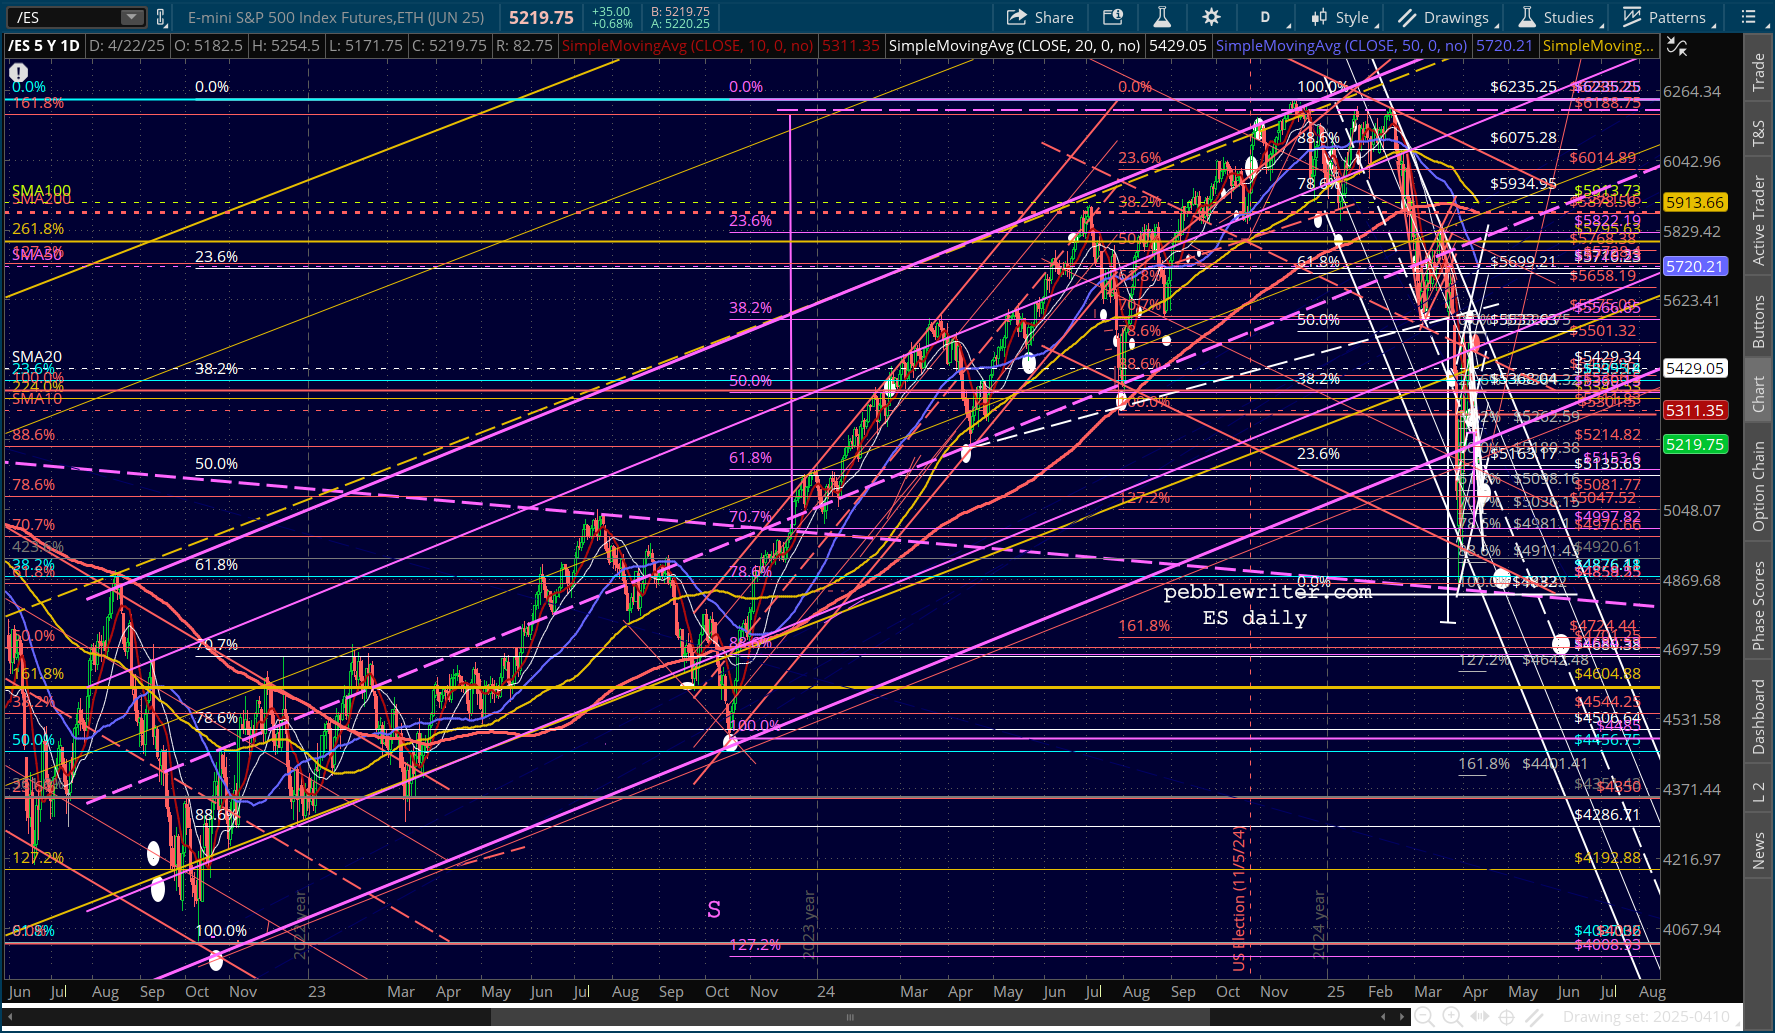
This is the first tag of the falling white channel top that was repeated shortly after the last one.The line in the sand is likely the 200-period SMA on the 15-min ES chart at 5250. 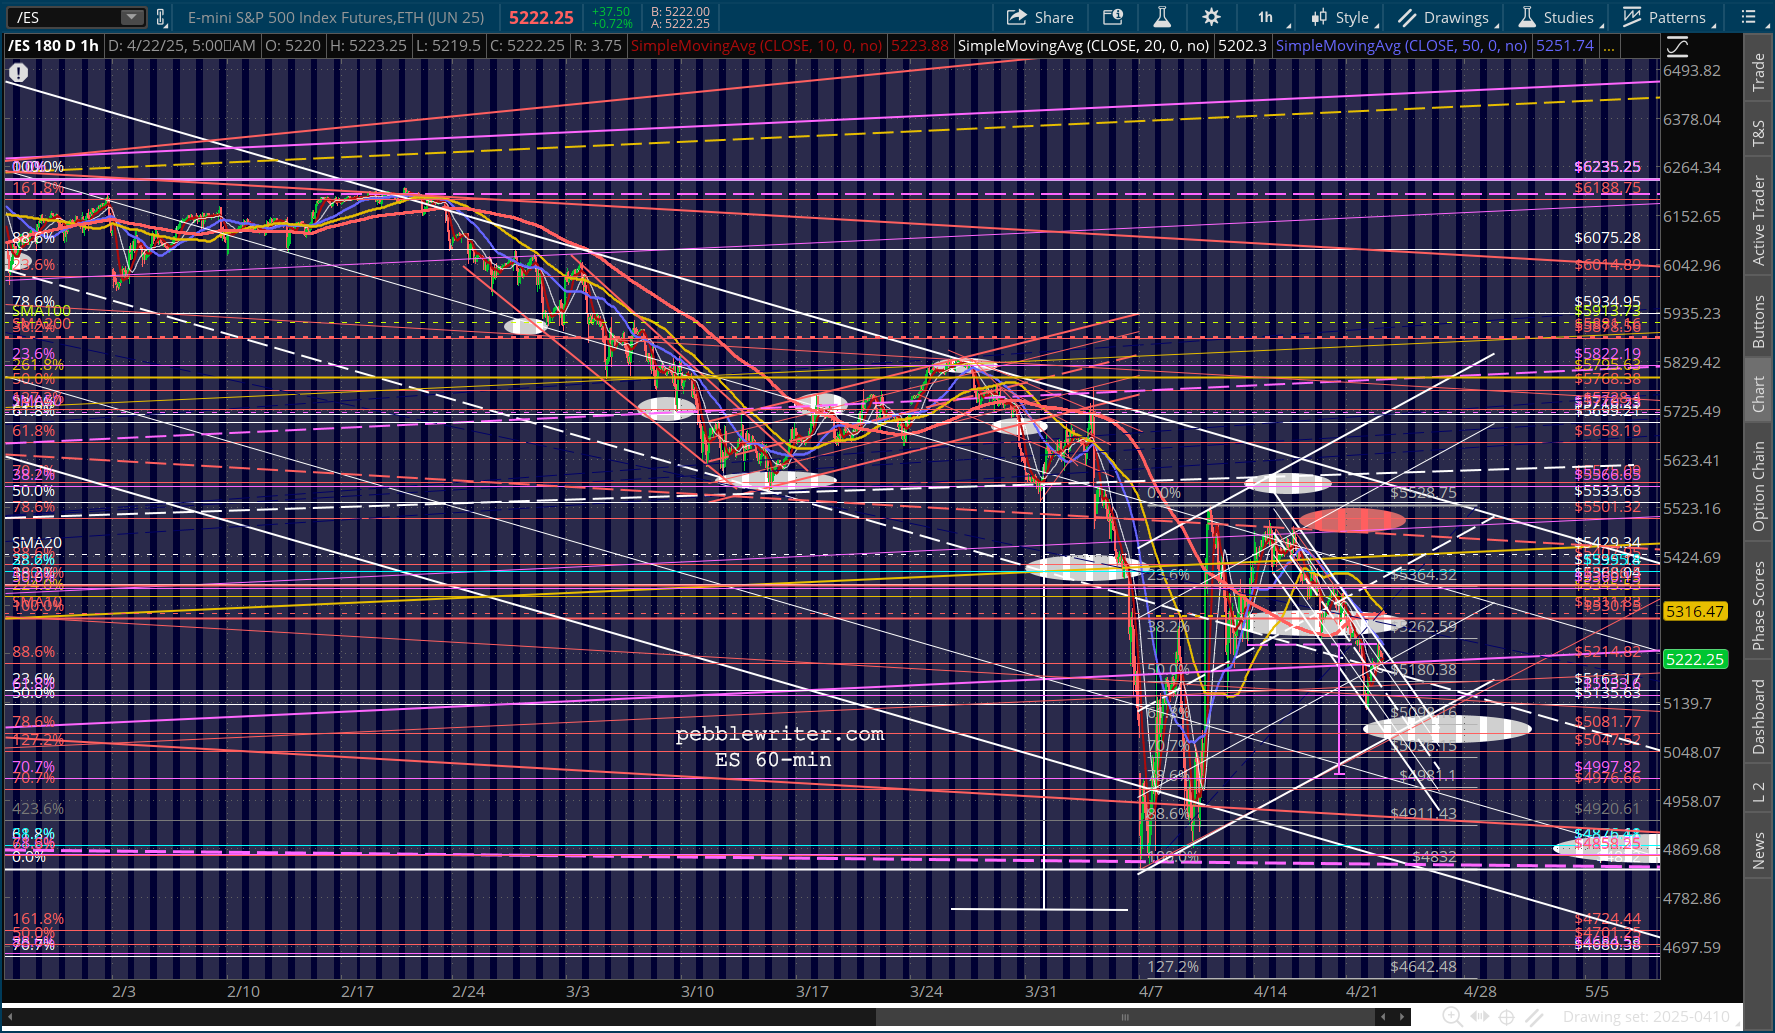
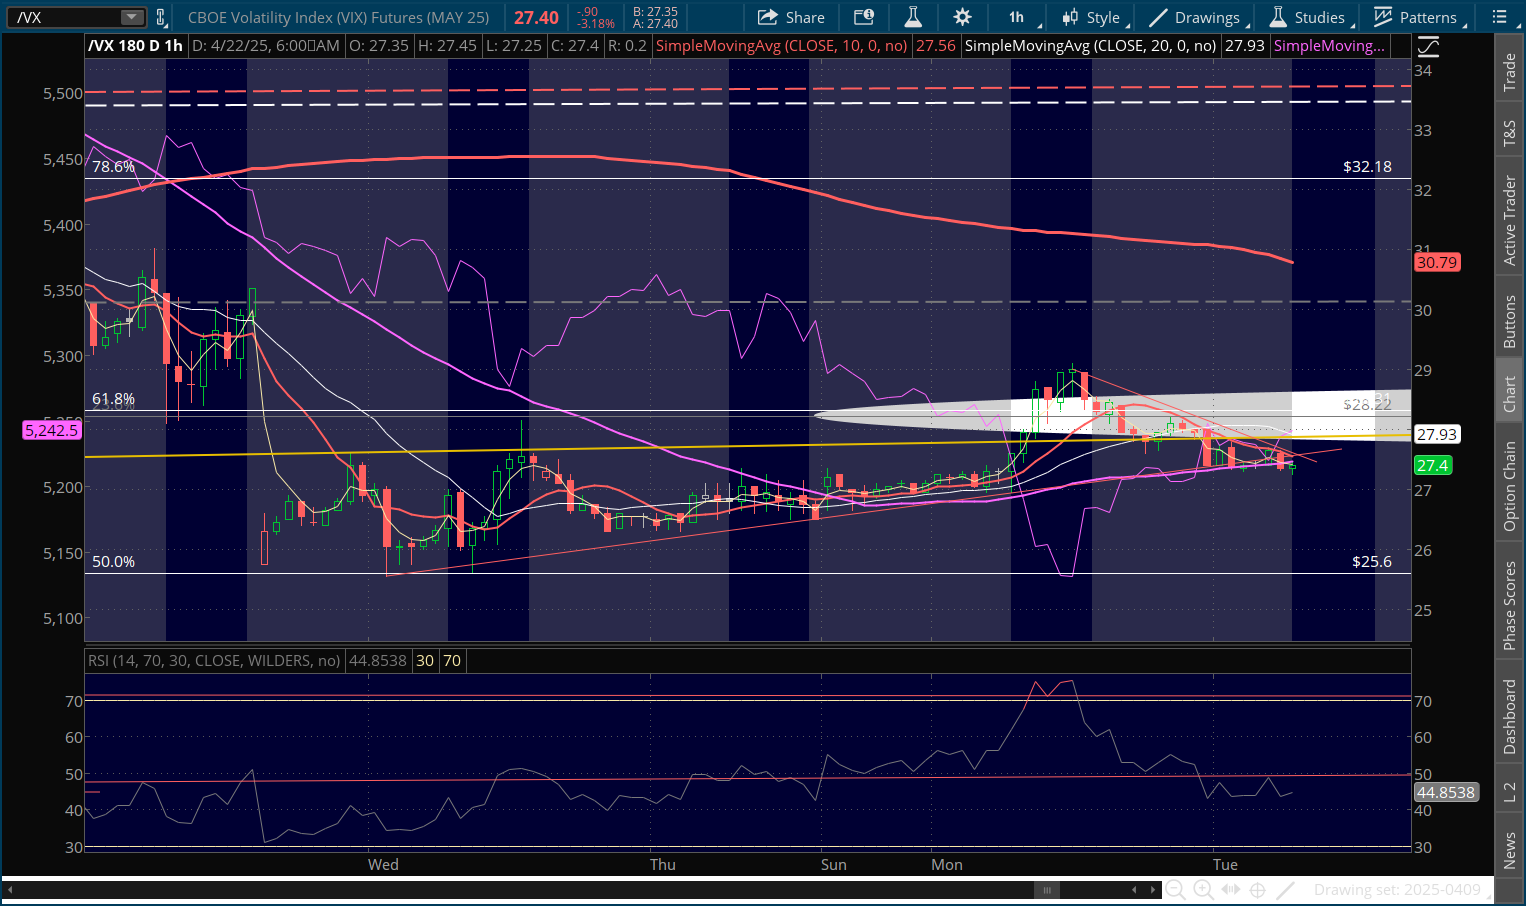
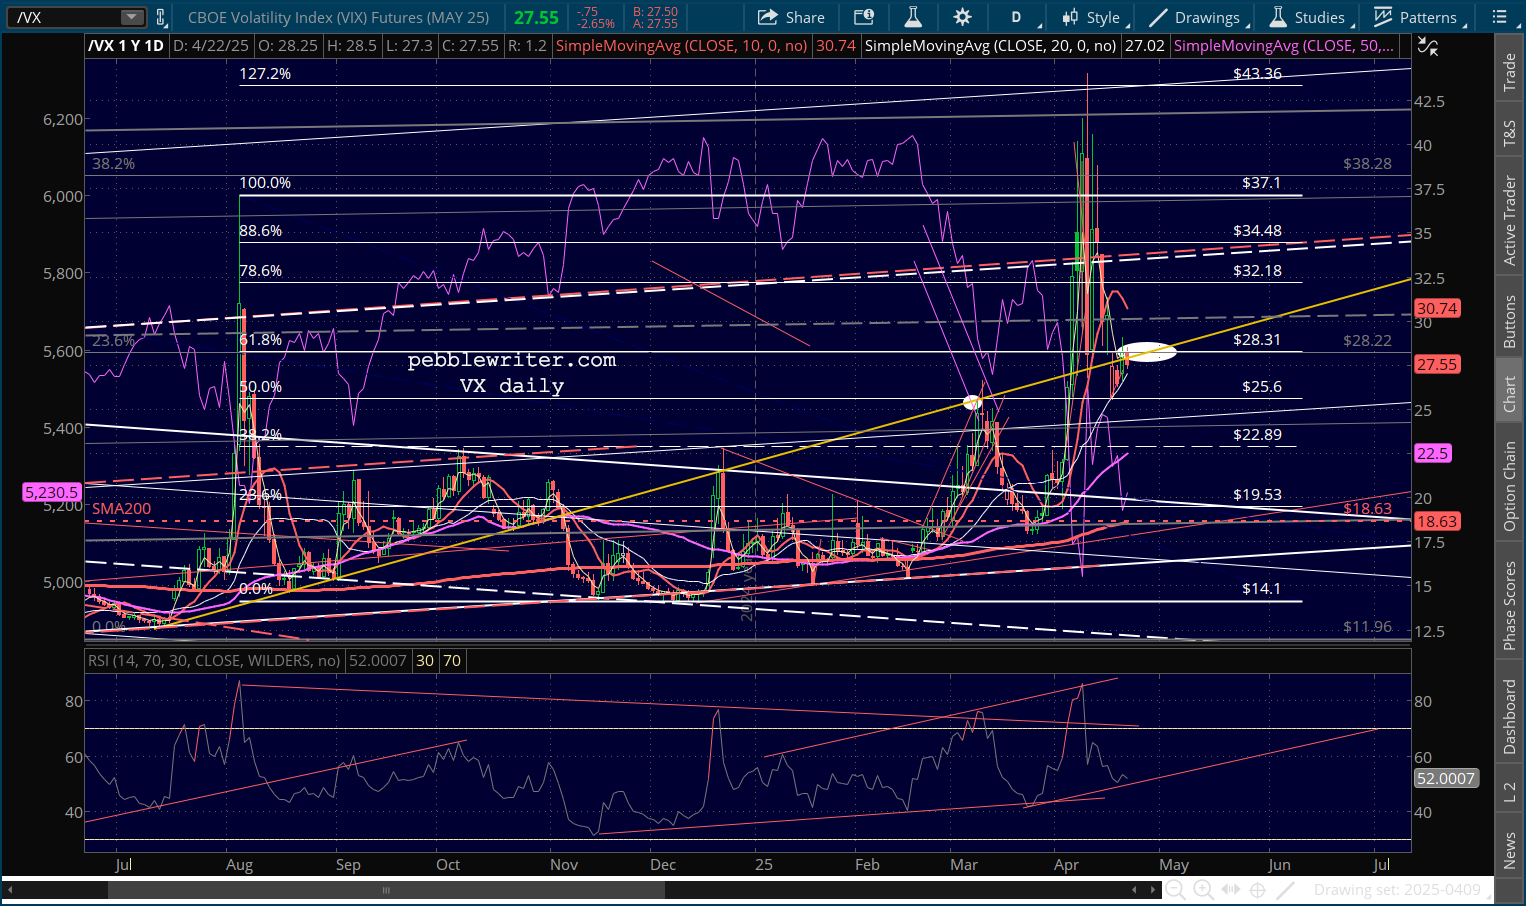
 Like last Friday, VIX and VX are threatening to break down. Note that VIX’s SMA10 has rolled over – usually a sign of an equity upturn.
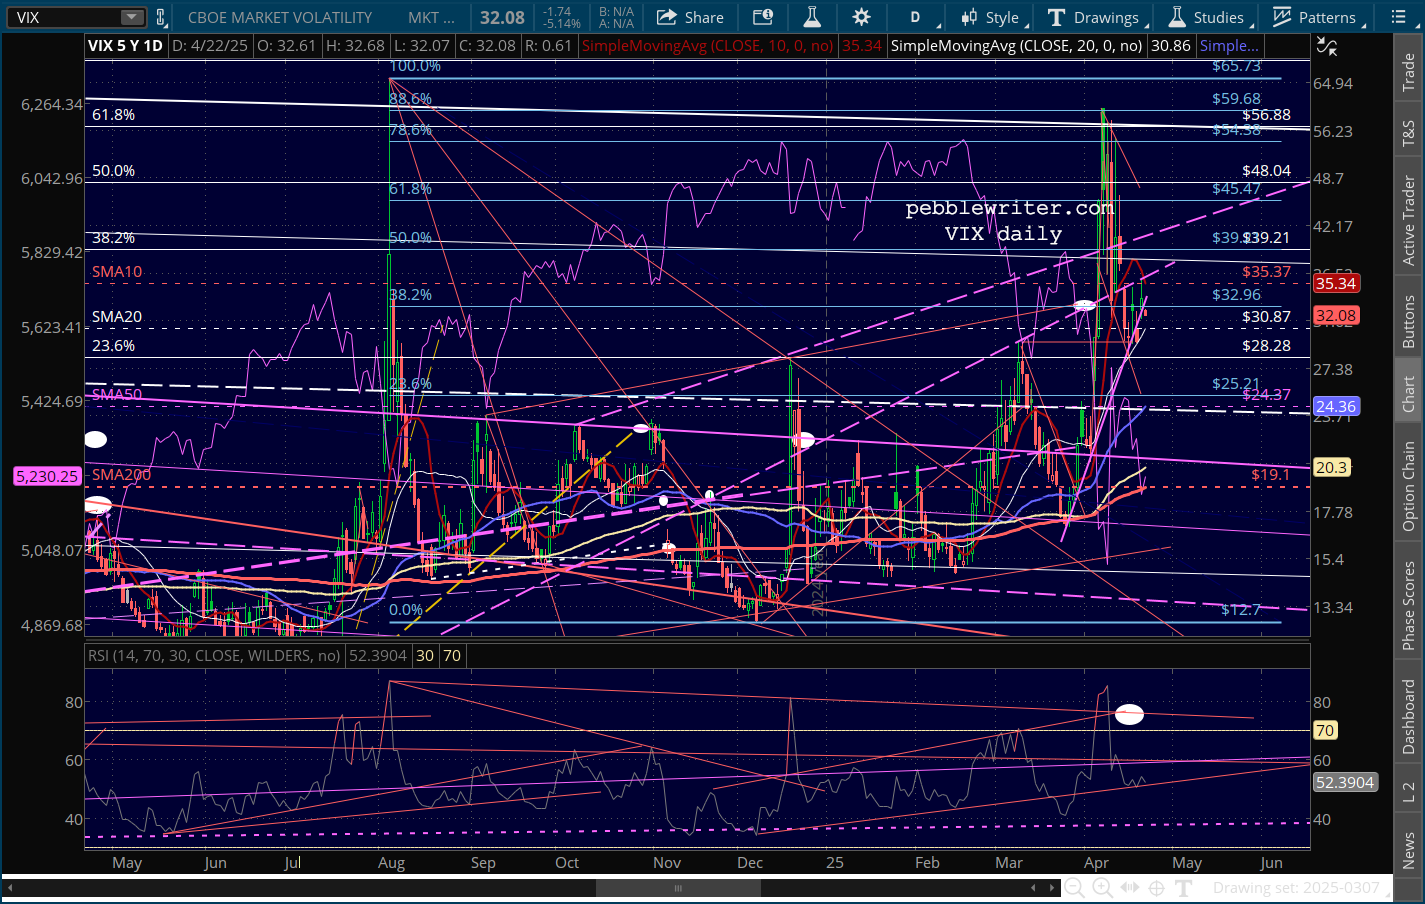
 Note that EURUSD is at least taking a pause at this overhead resistance.
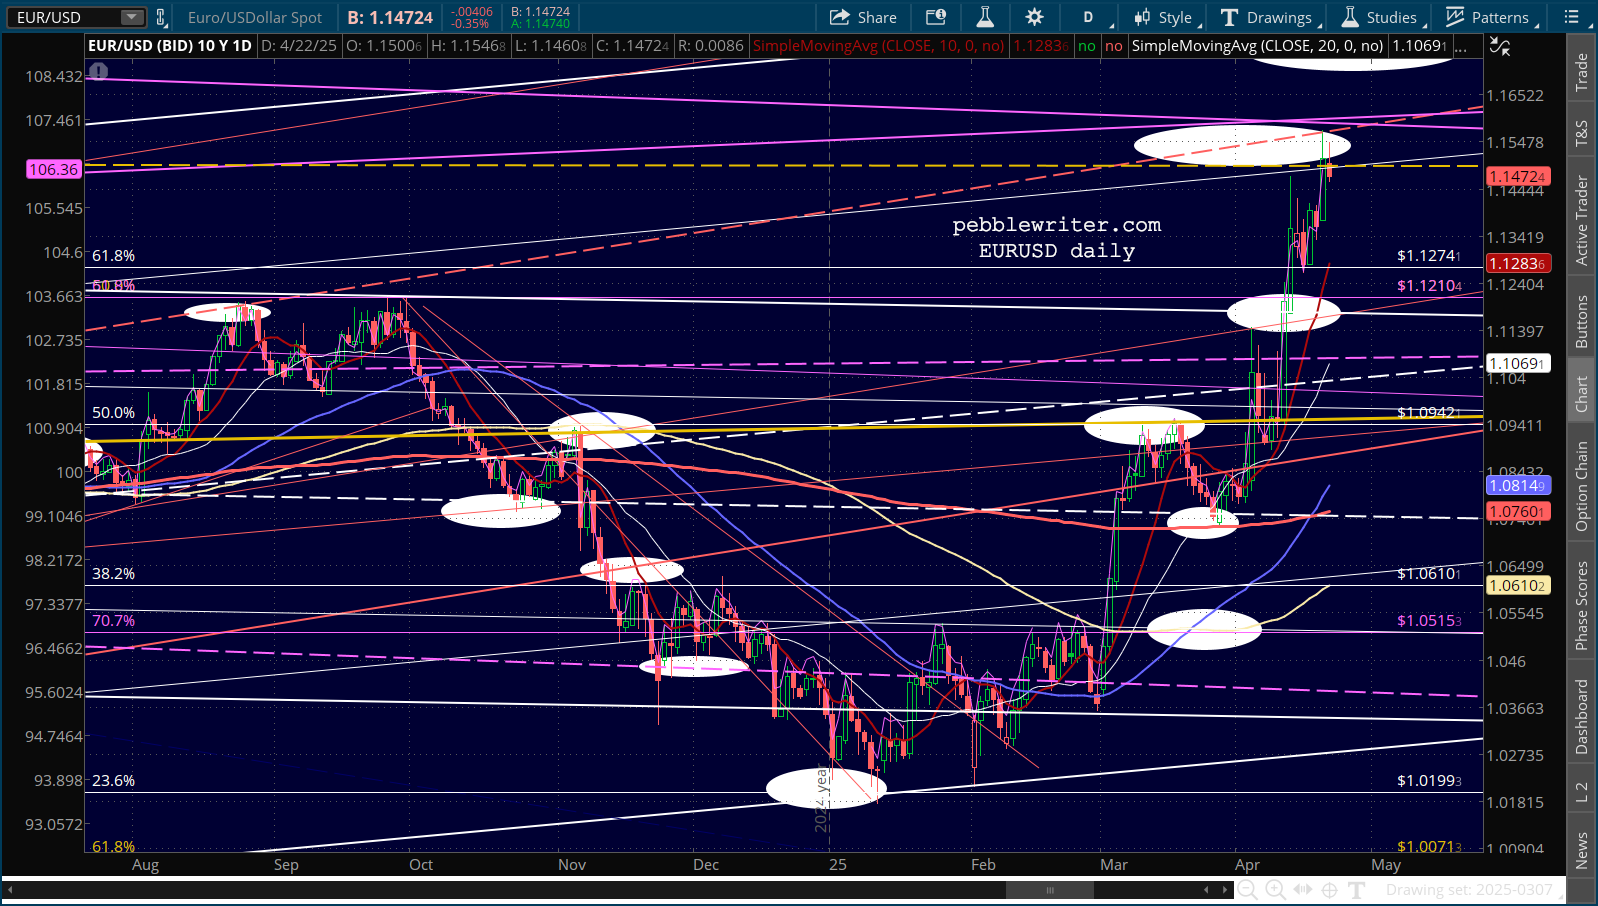 While USDJPY has reached support. A move below 139 would complete a H&S pattern that targets 117 – a huge risk for equities.
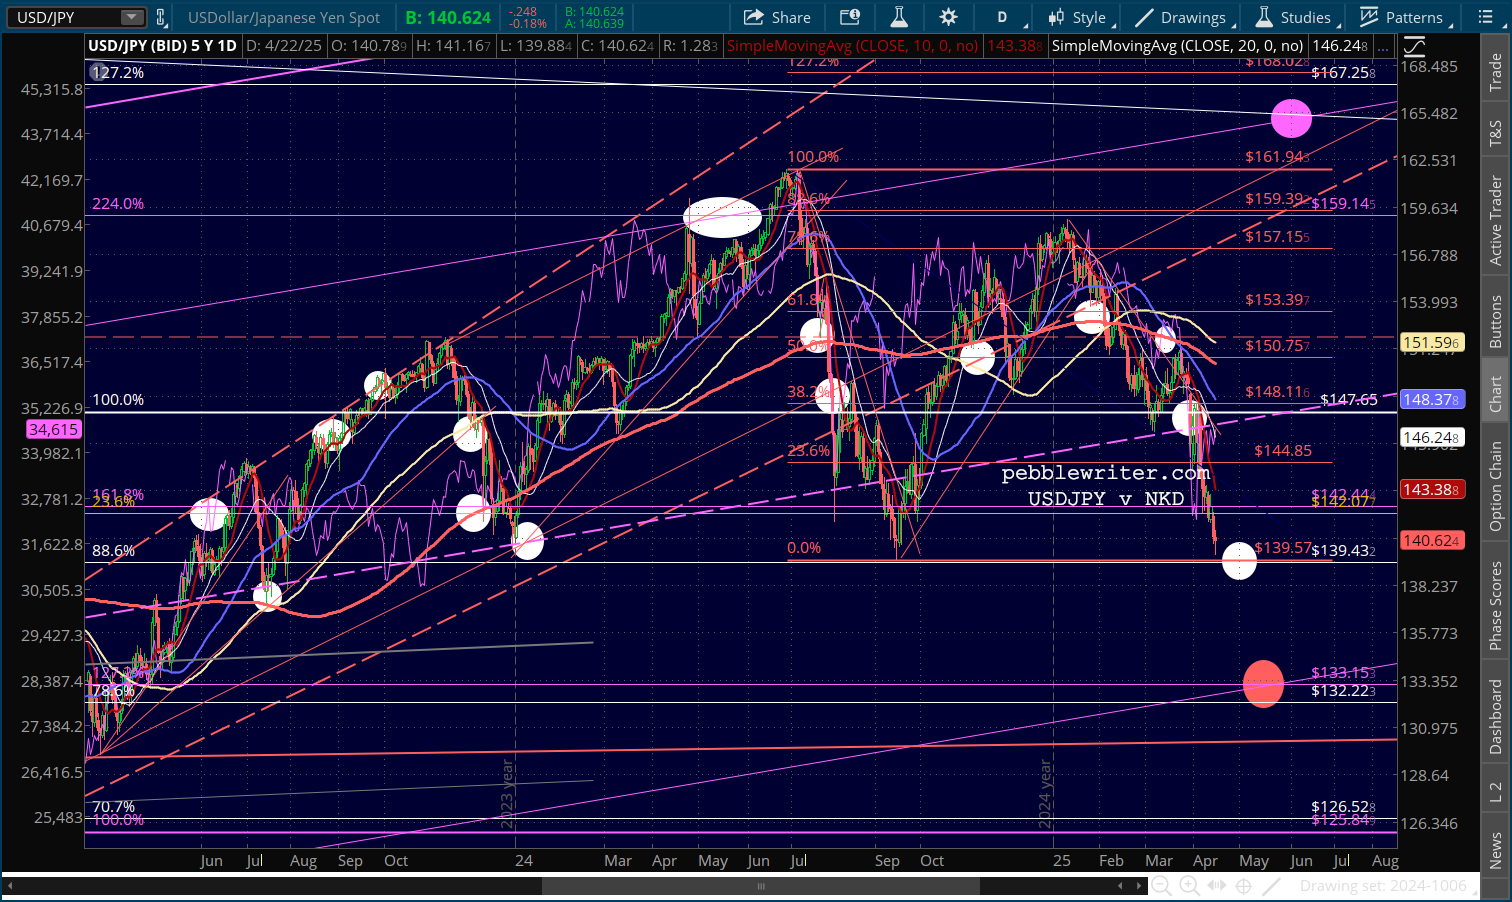
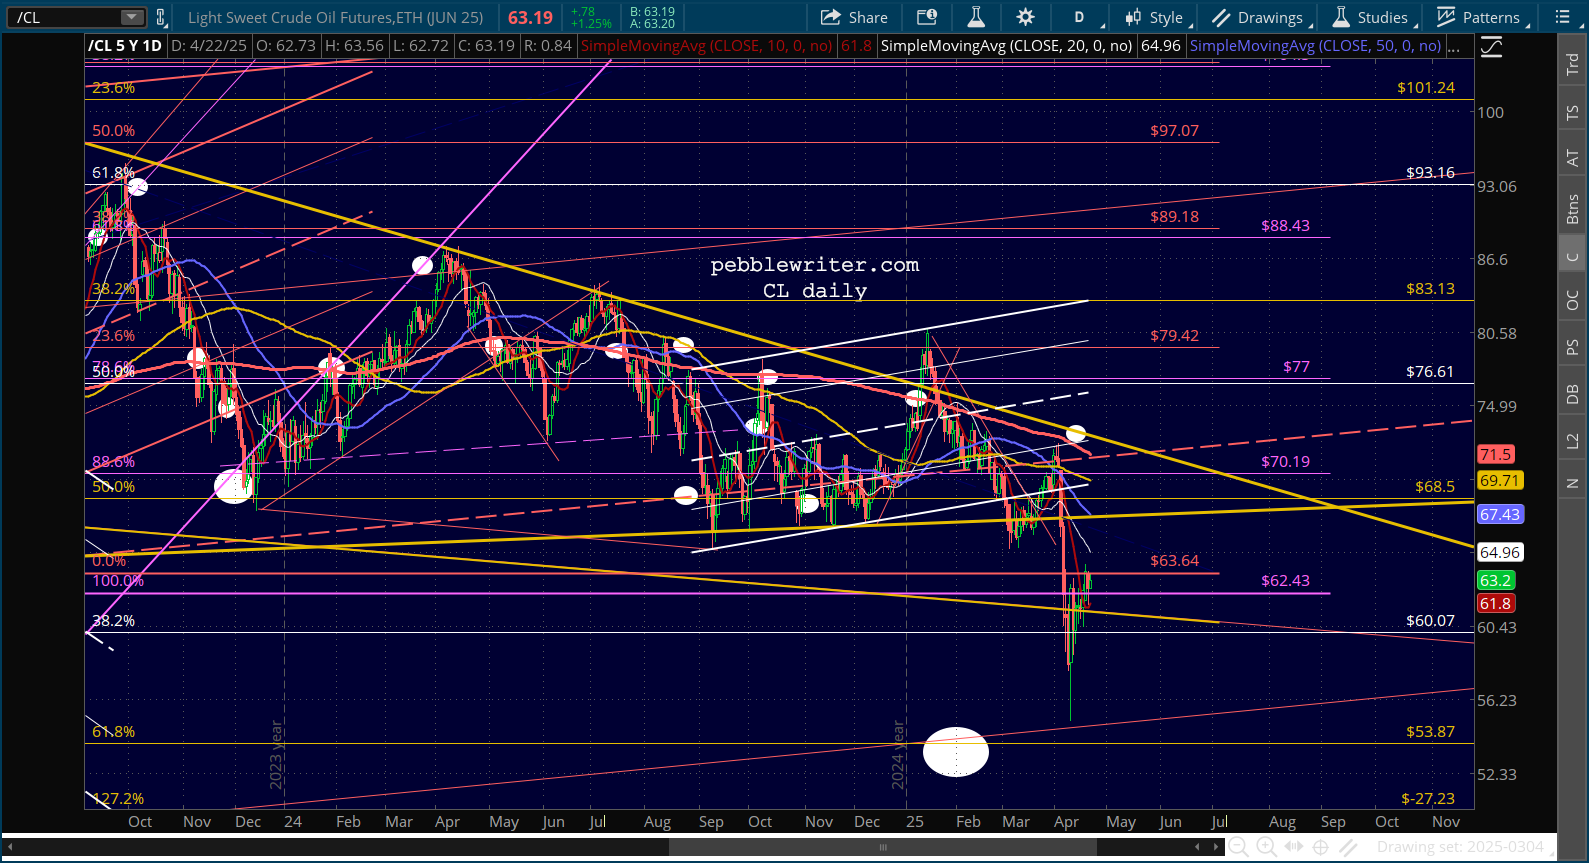
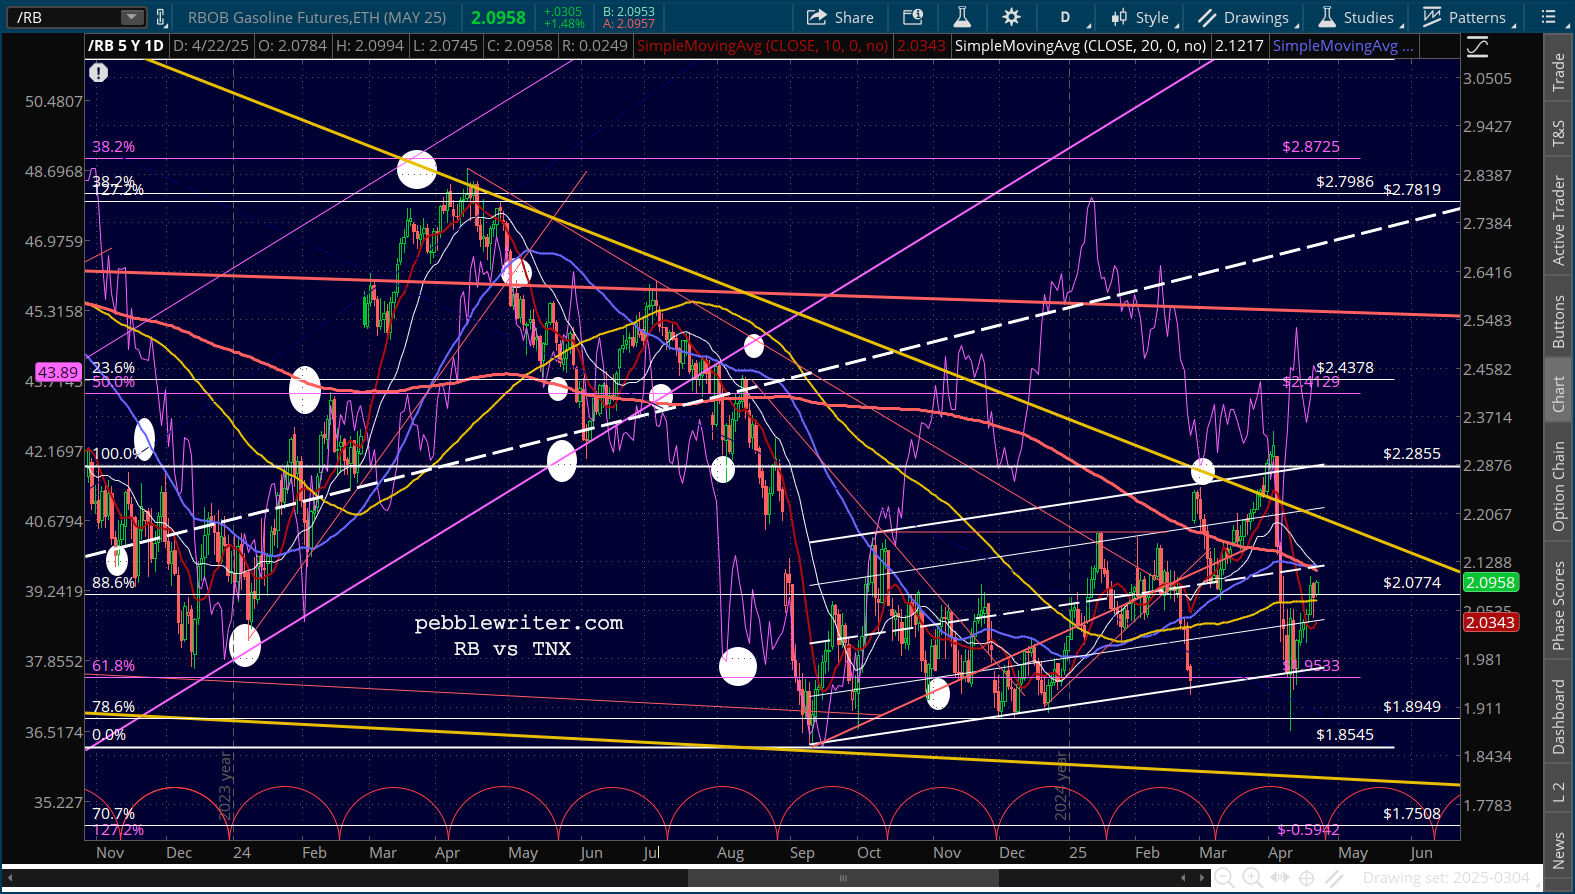
 CL and RB are still inching higher, providing an upward nudge to the 10Y.