

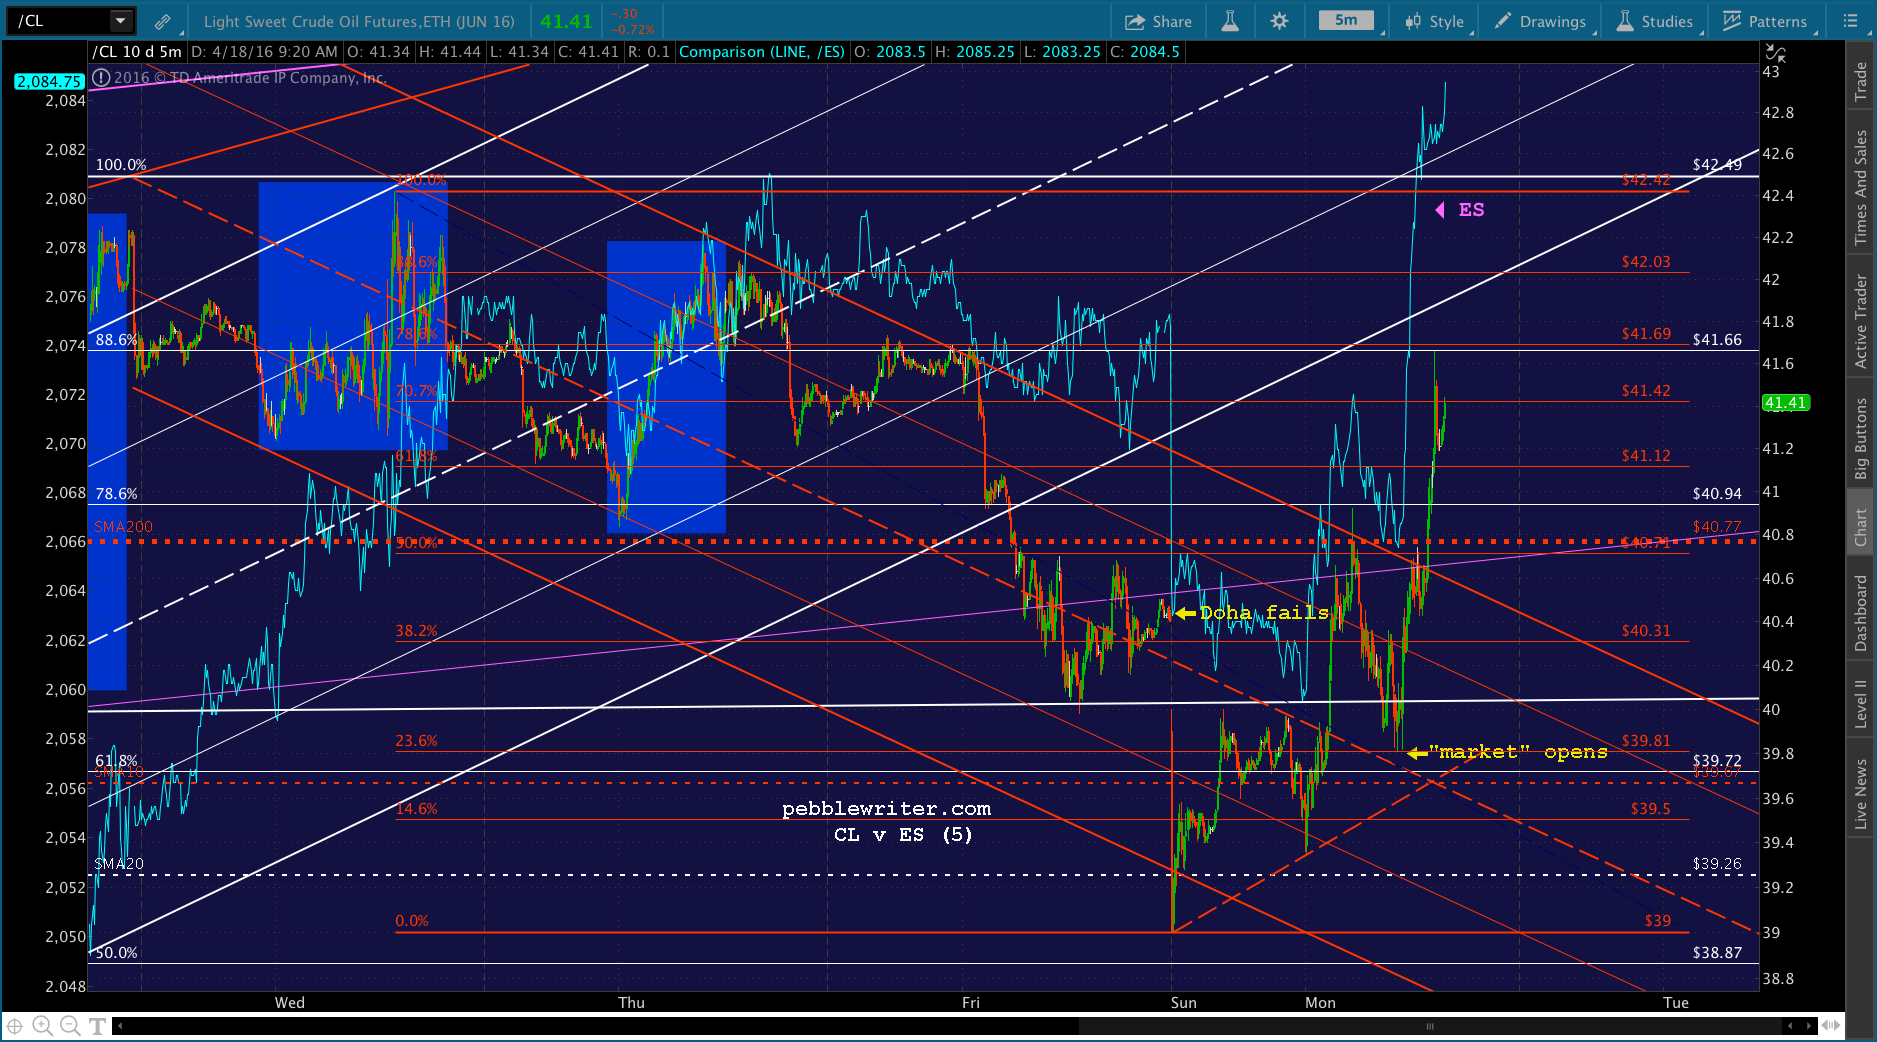
Since SPX gained 270 points on oil’s rally from 26.05 to 42.49, that’ll all be undone now that oil’s rise has been exposed as a sham, right? Don’t believe it.
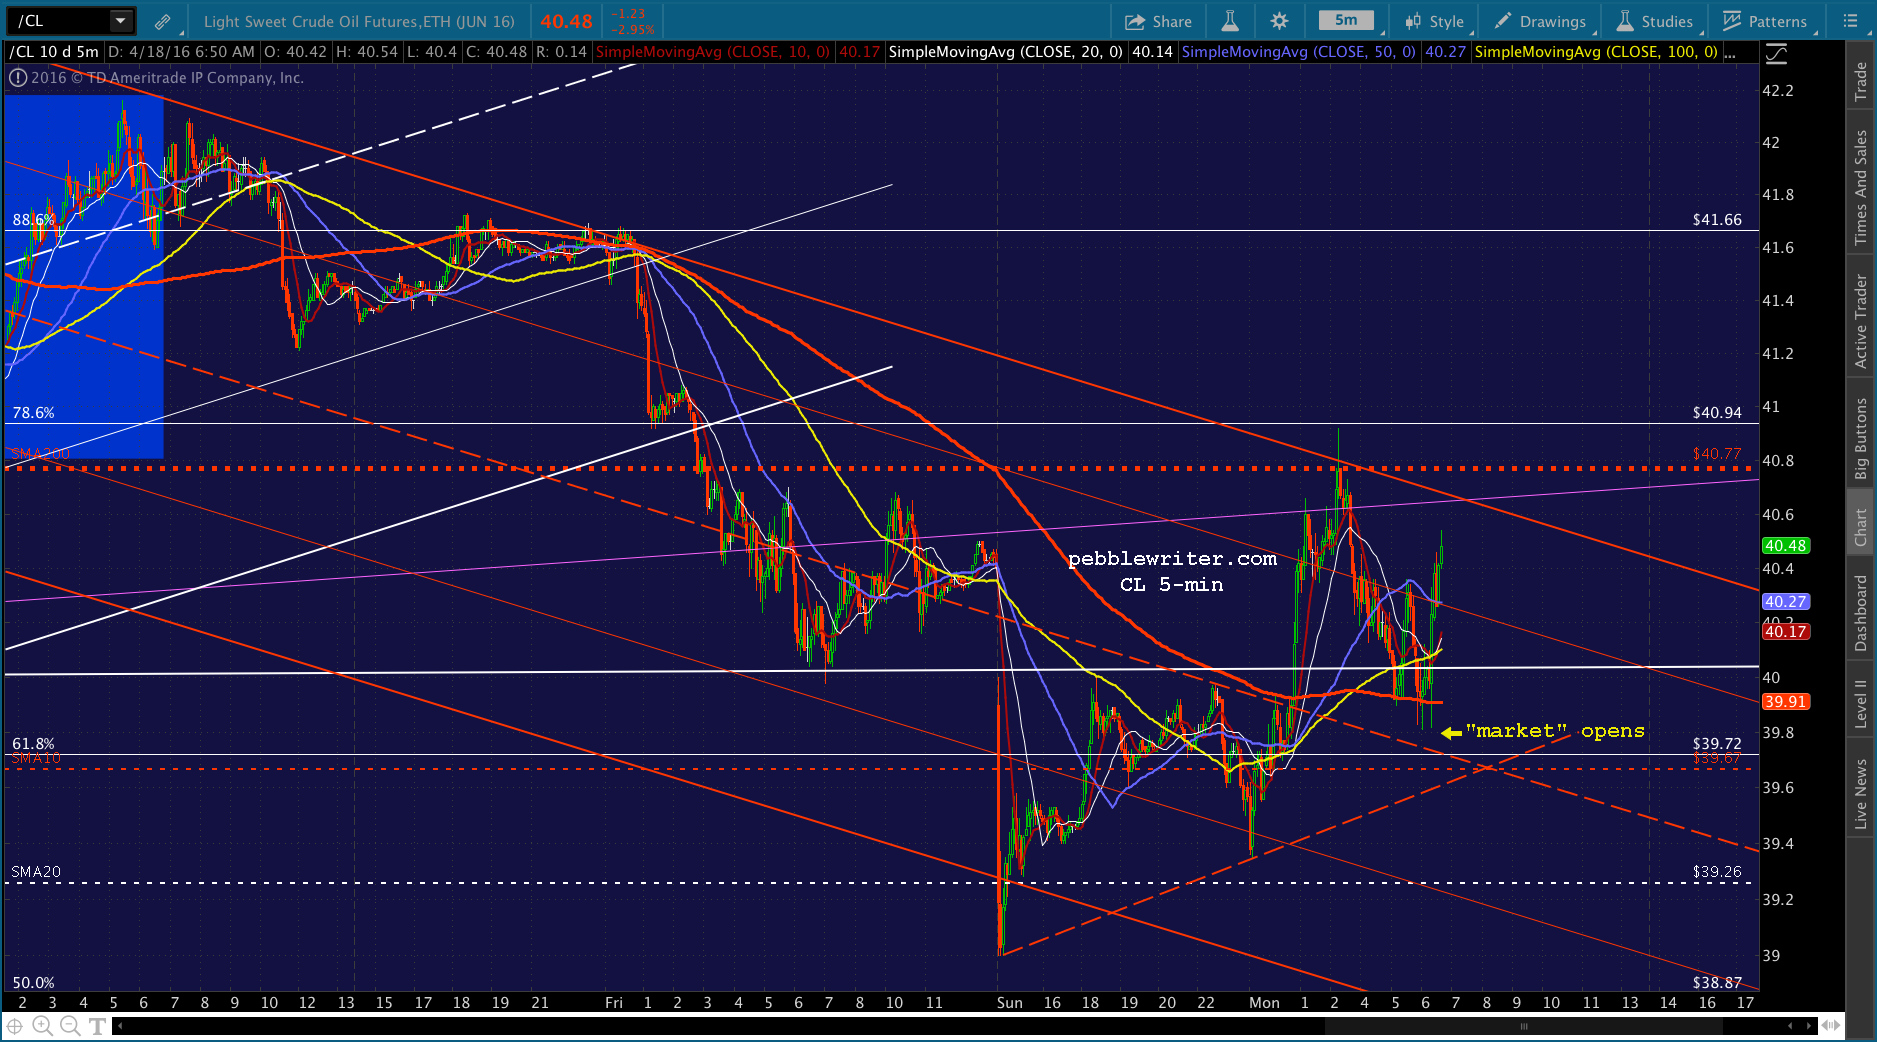
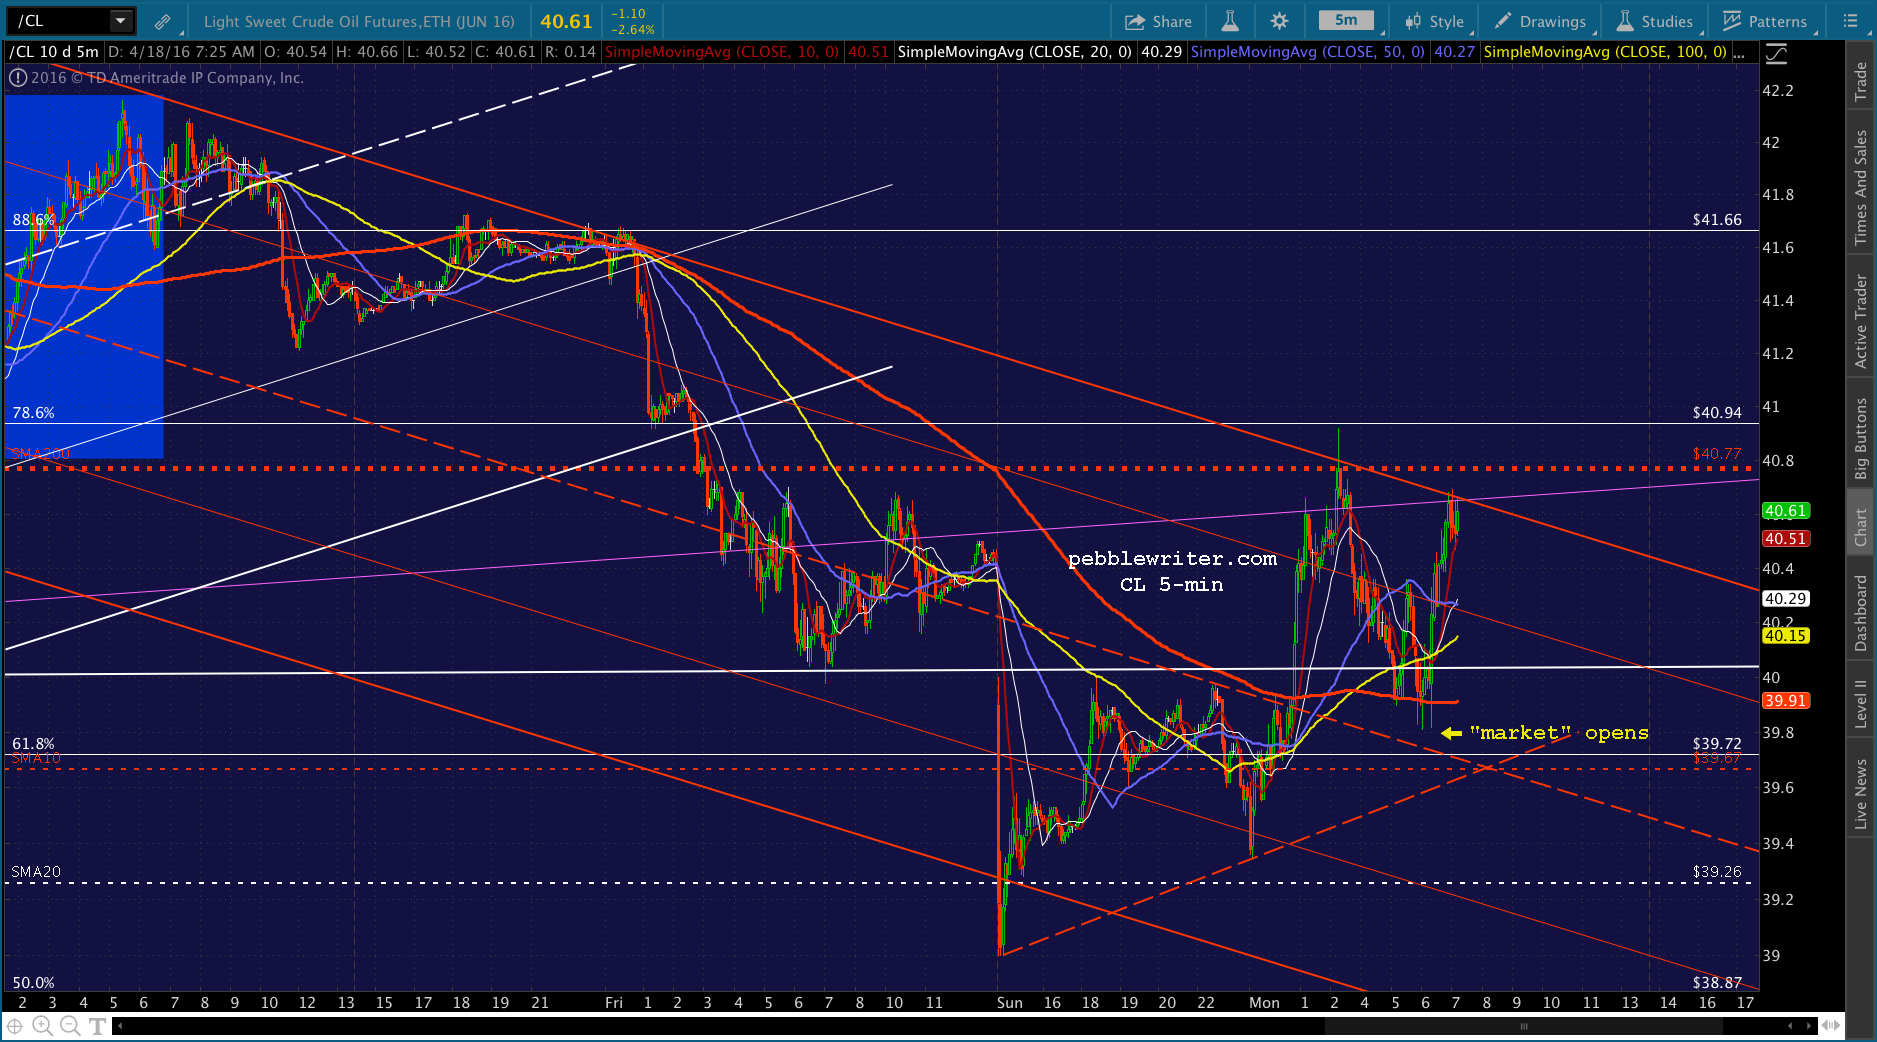
Though Doha failed spectacularly, CL has regained 2.5% of its losses on — what else? — price intervention. And, before you start slinging conspiracy theory accusations, consider the headlines of the last week, where banks have fessed up to manipulating gold prices — after previously copping to interest rate and currency manipulation.
Doubters, just watch CL’s rebounds during today’s session. I promise you that one will occur every time SPX starts plunging just a little too fast.
 Oh look, there’s one now.
 That’s the good news for oil supporters. The bad news is that the bounce from 39 back to 40 backtested the now broken SMA200. Not saying it can’t be regained, but it’s a little tougher (more expensive) when the price manipulation is laid bare for all to see.
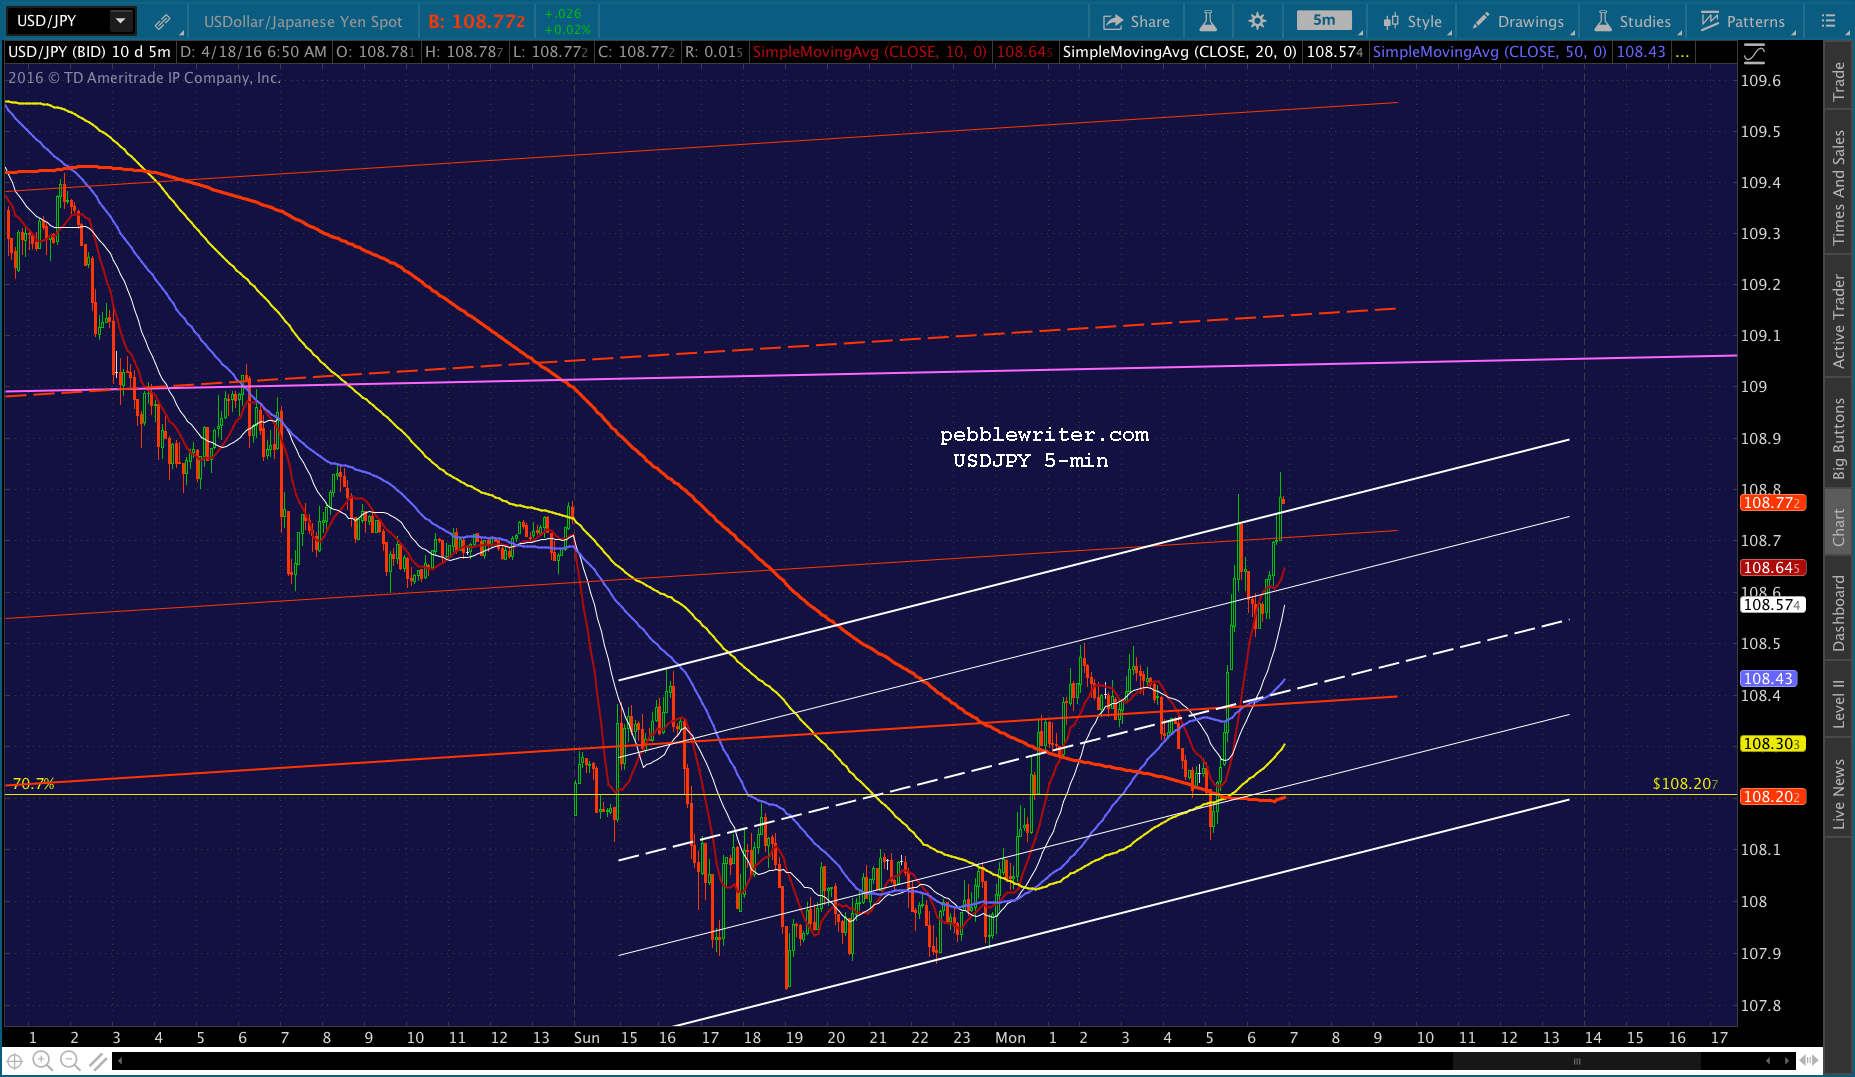
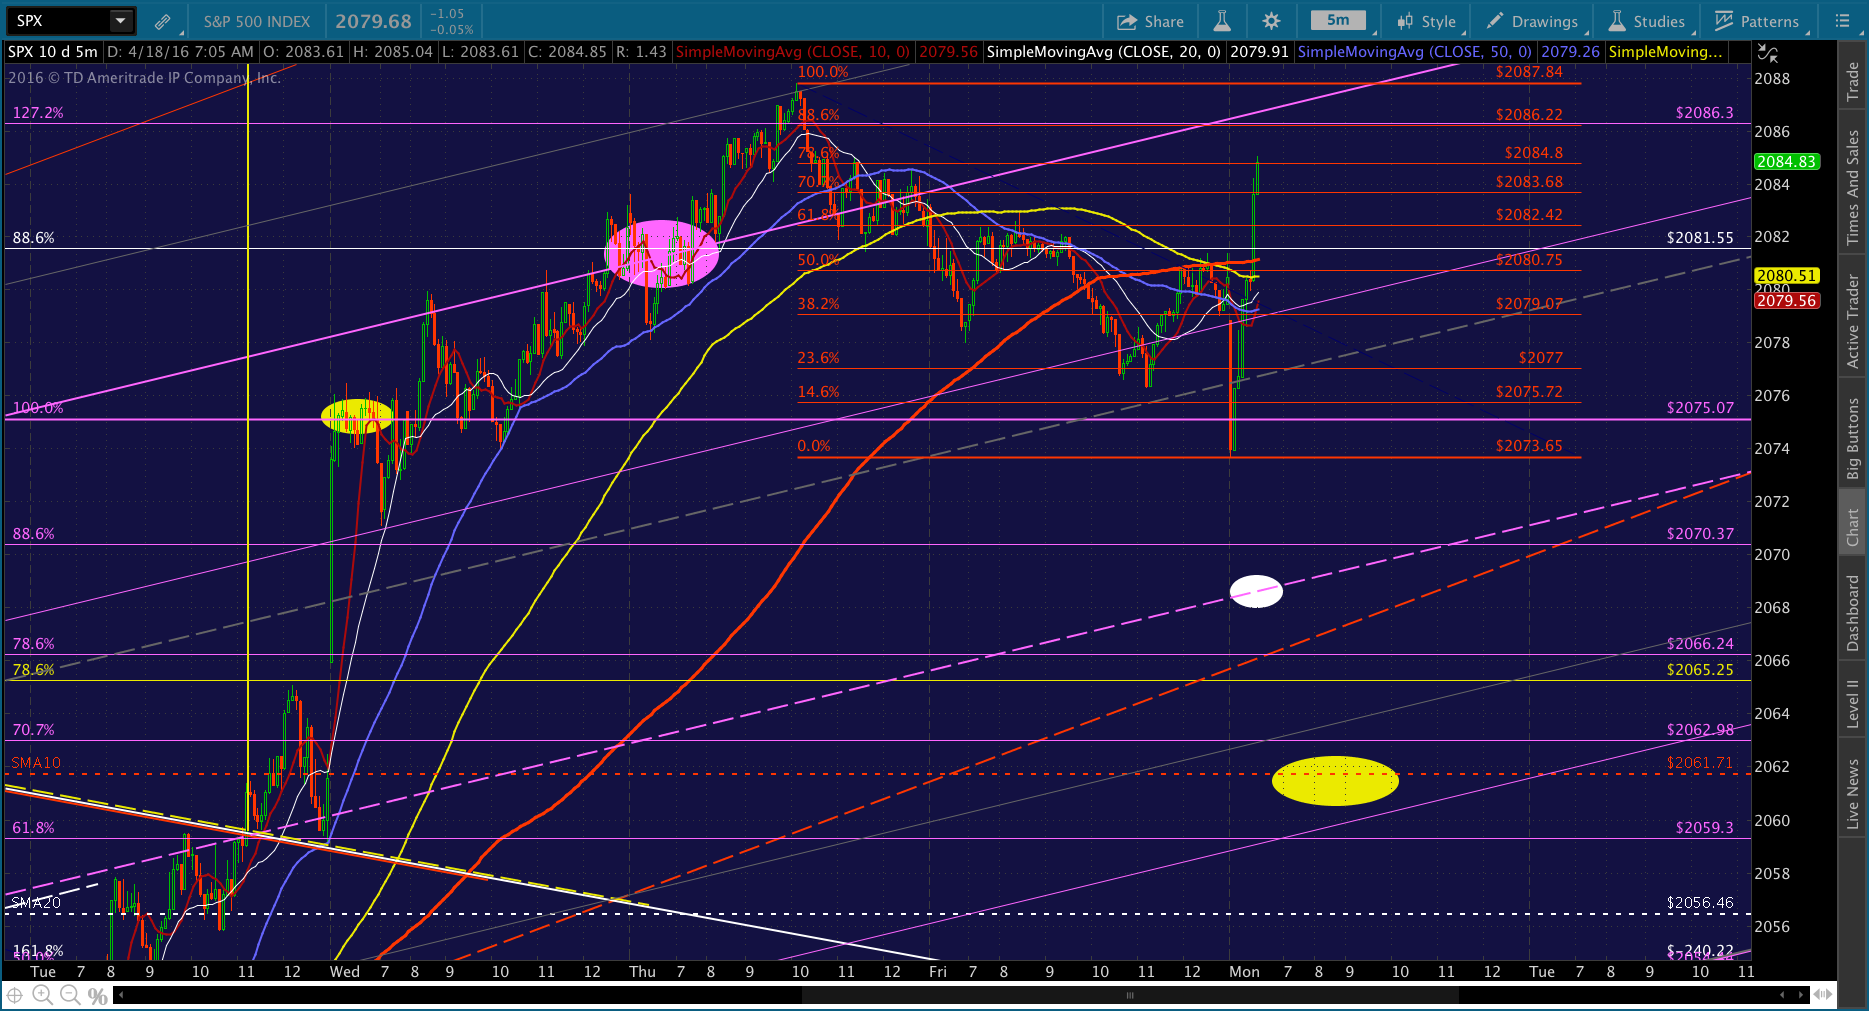
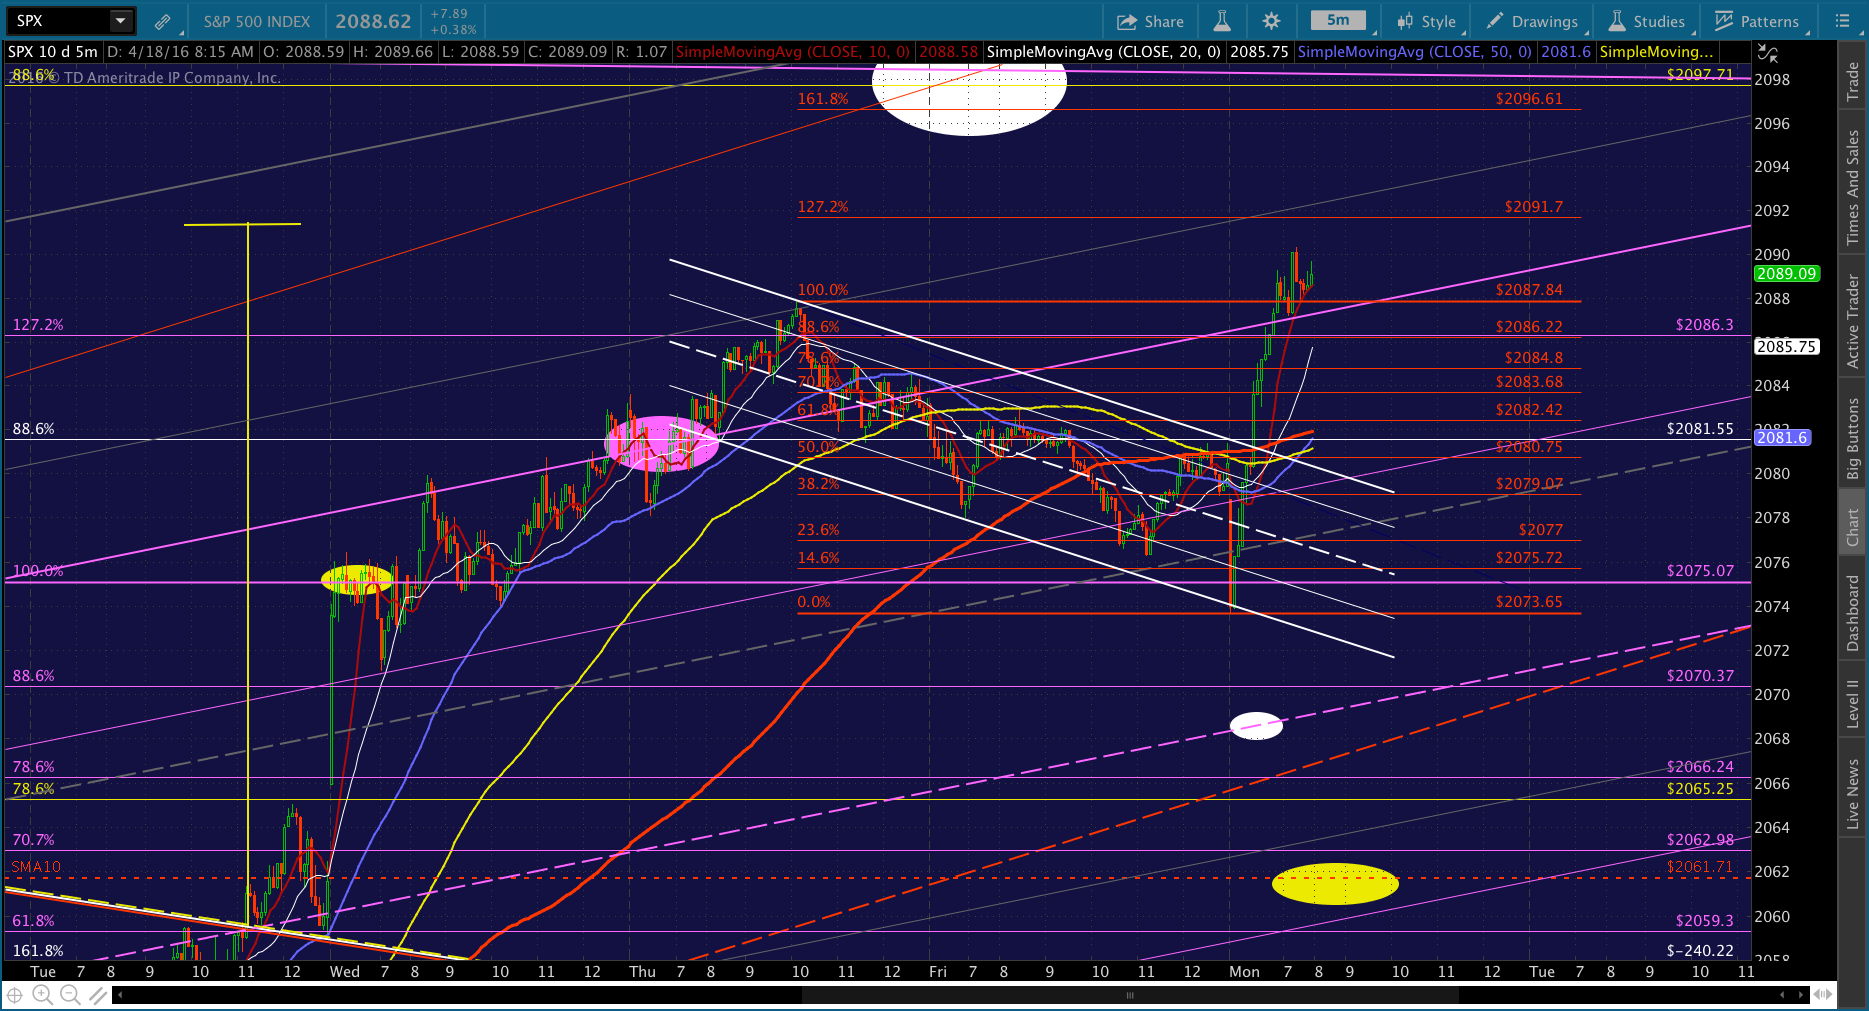
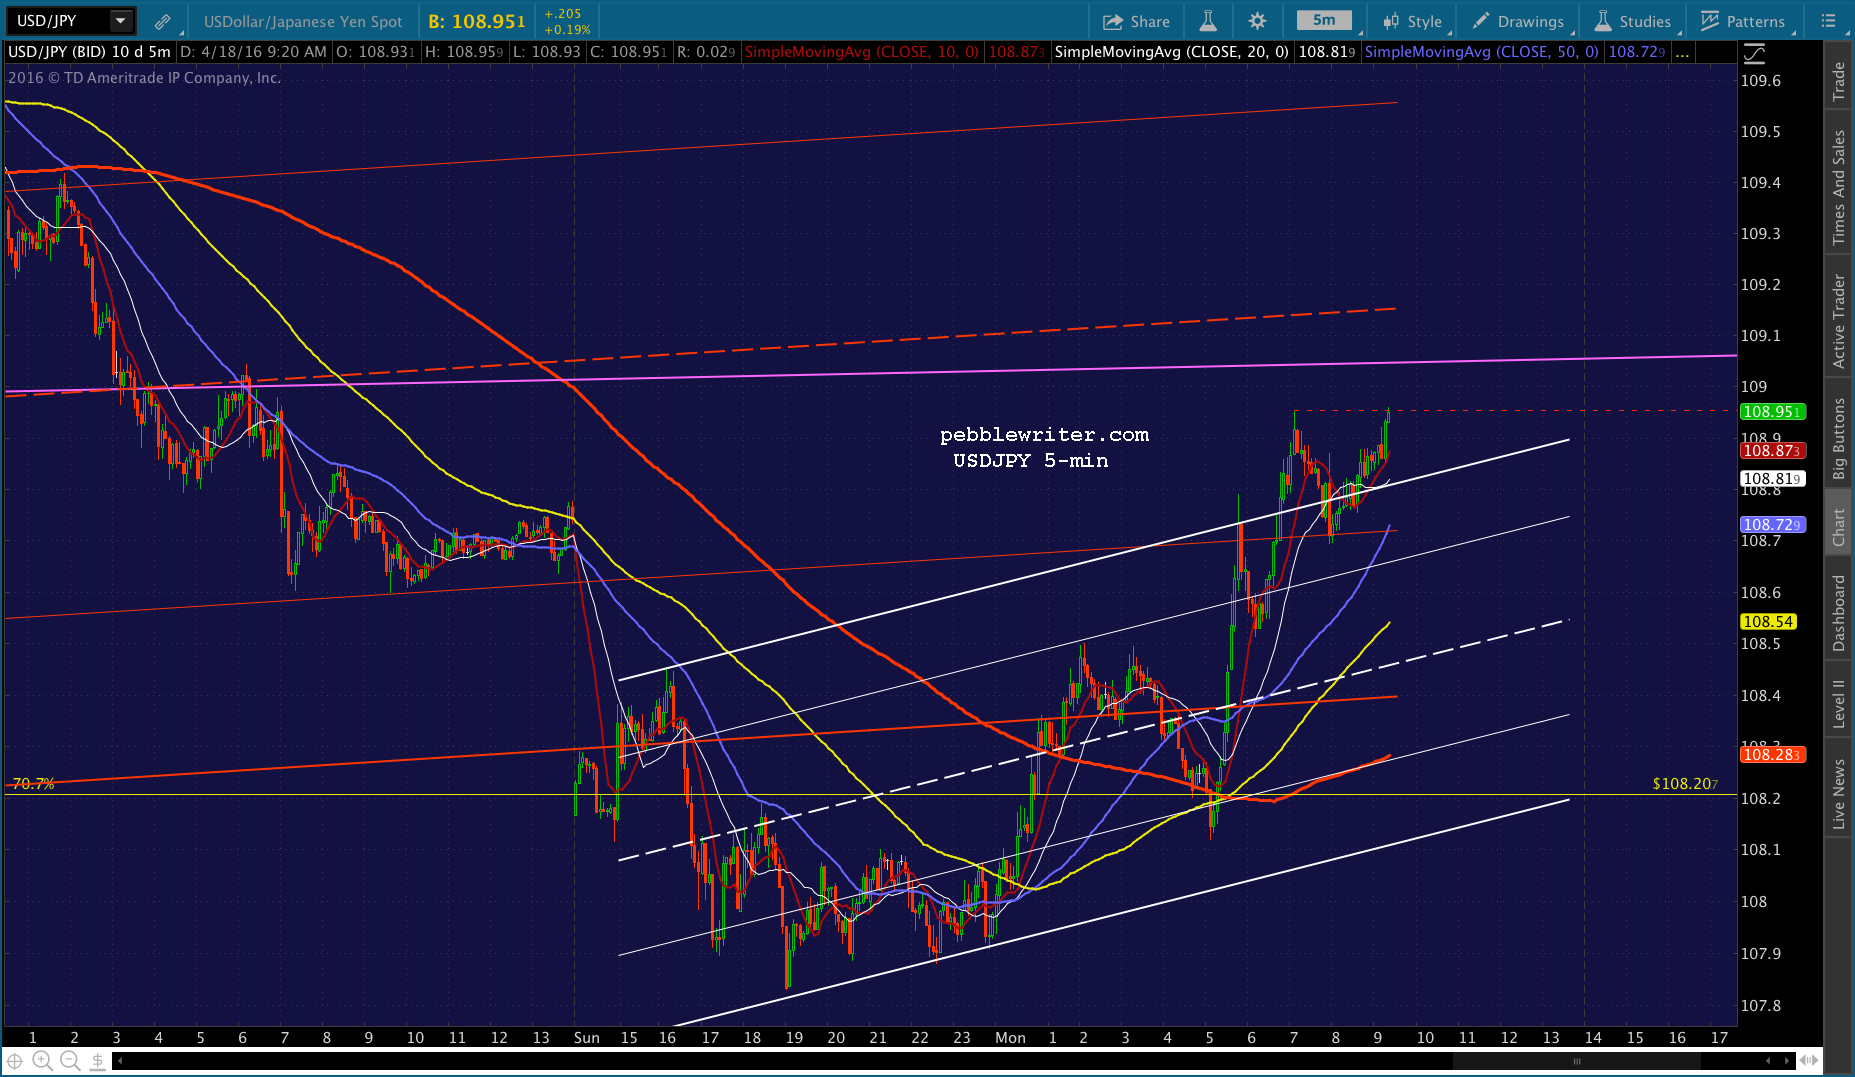
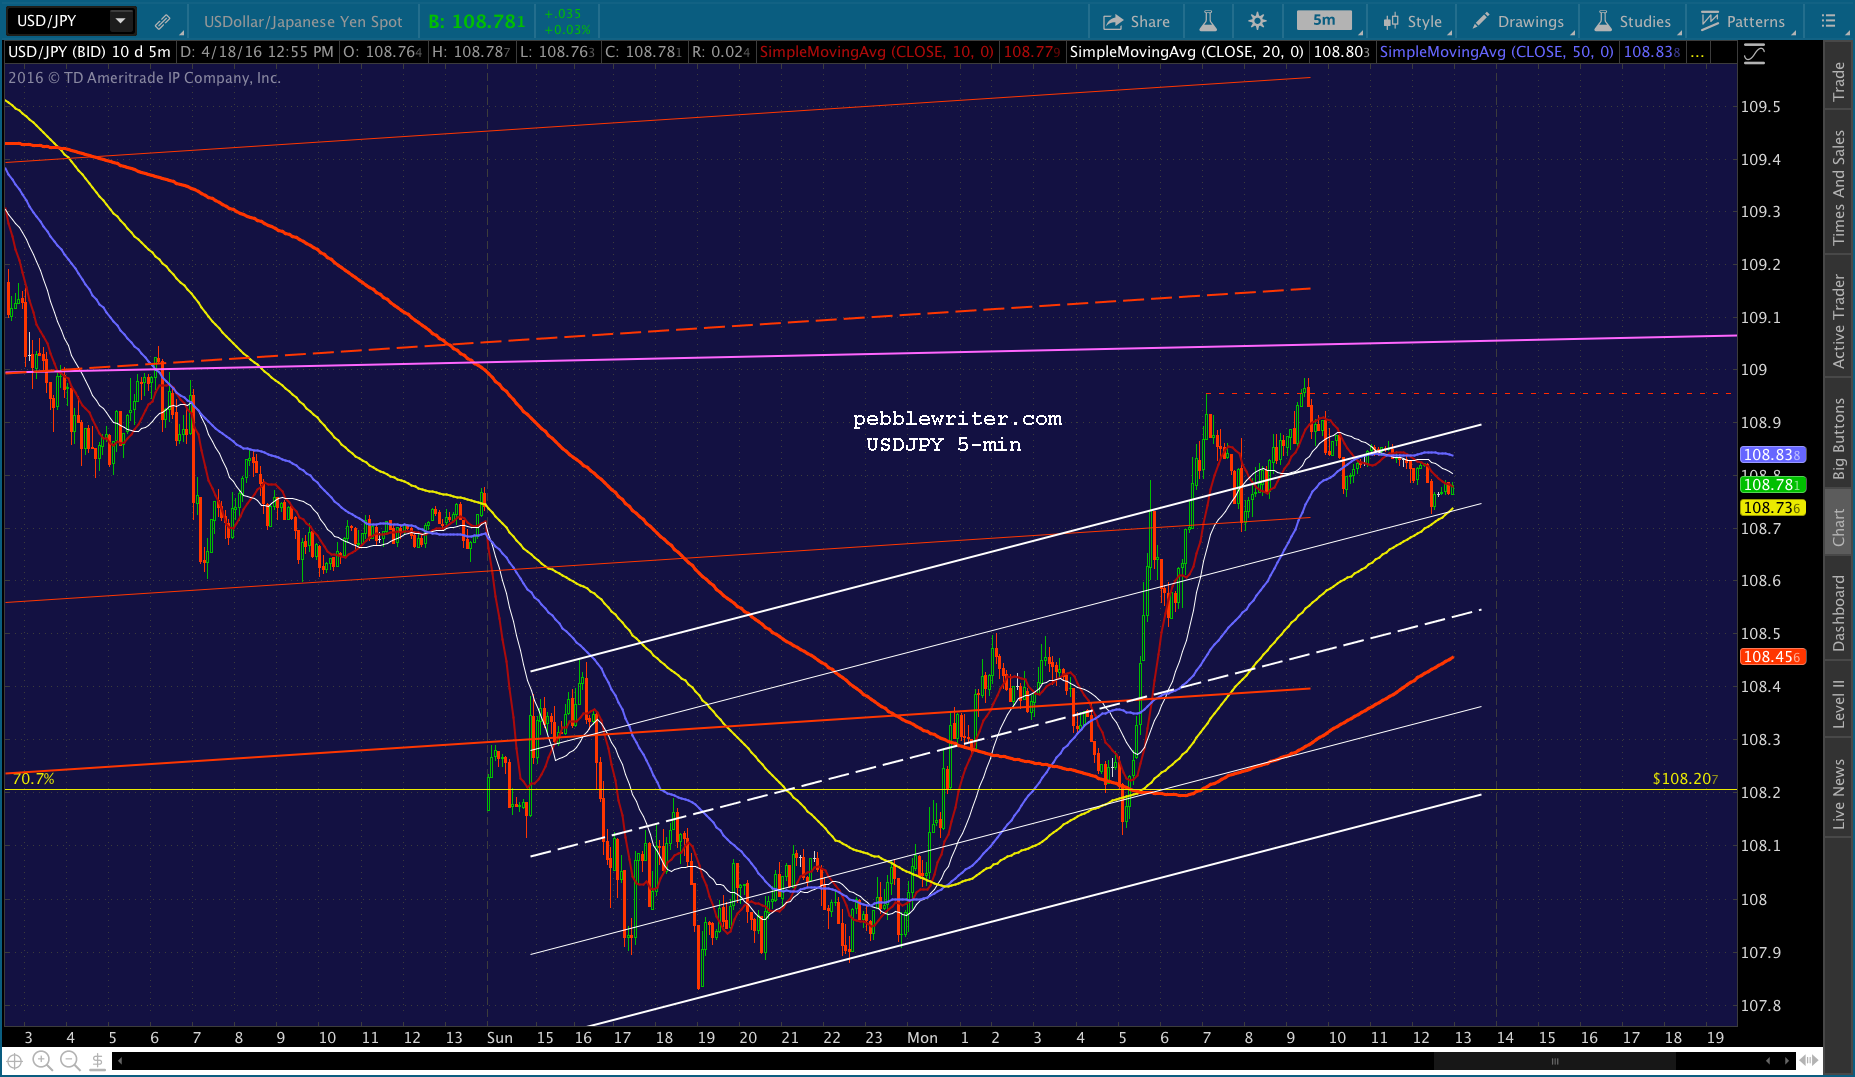
continued for members…USDJPY broke trend — even the most generous positive spin I can put on it doesn’t really accomplish that.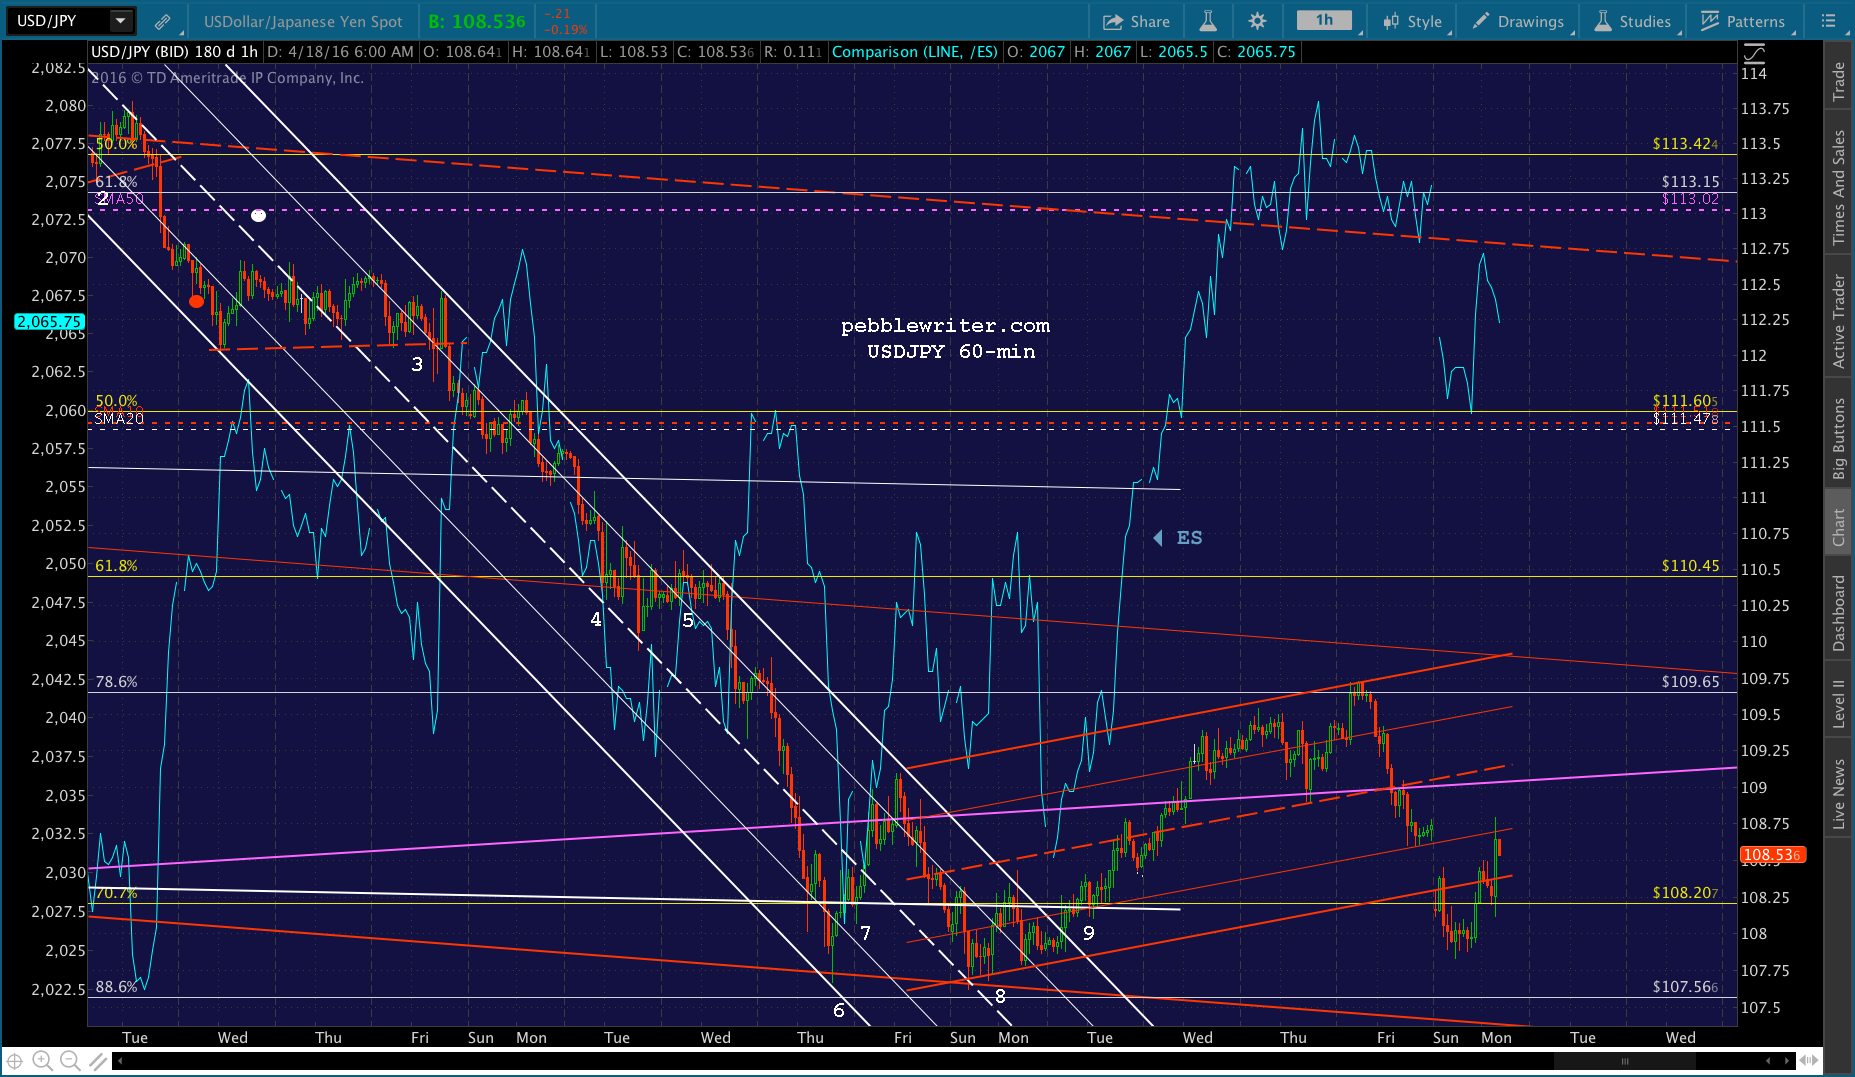 SPX’s decline will depend on whether ES’s earlier losses were foreshadowing or were merely blowing off steam. It certainly appears as though 2056.10 is in the cards — a total drop of 18 from Friday’s close, roughly equivalent to 2062 for SPX.
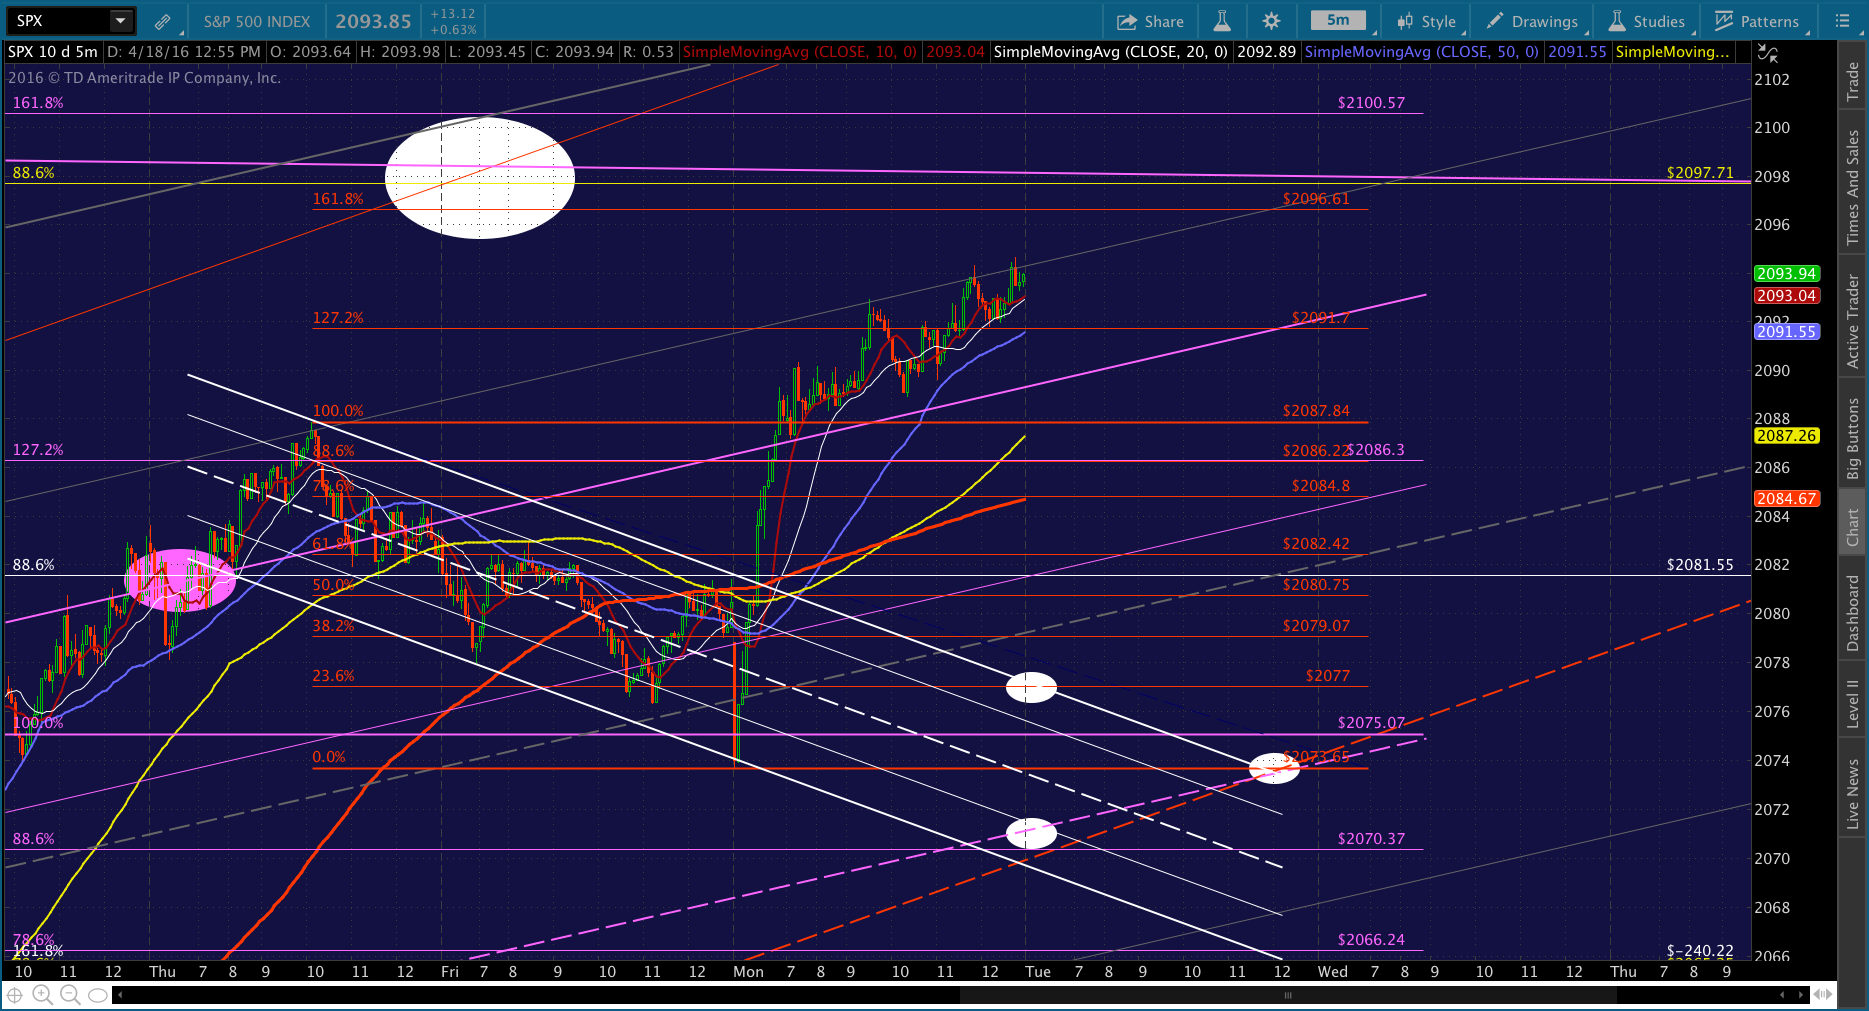
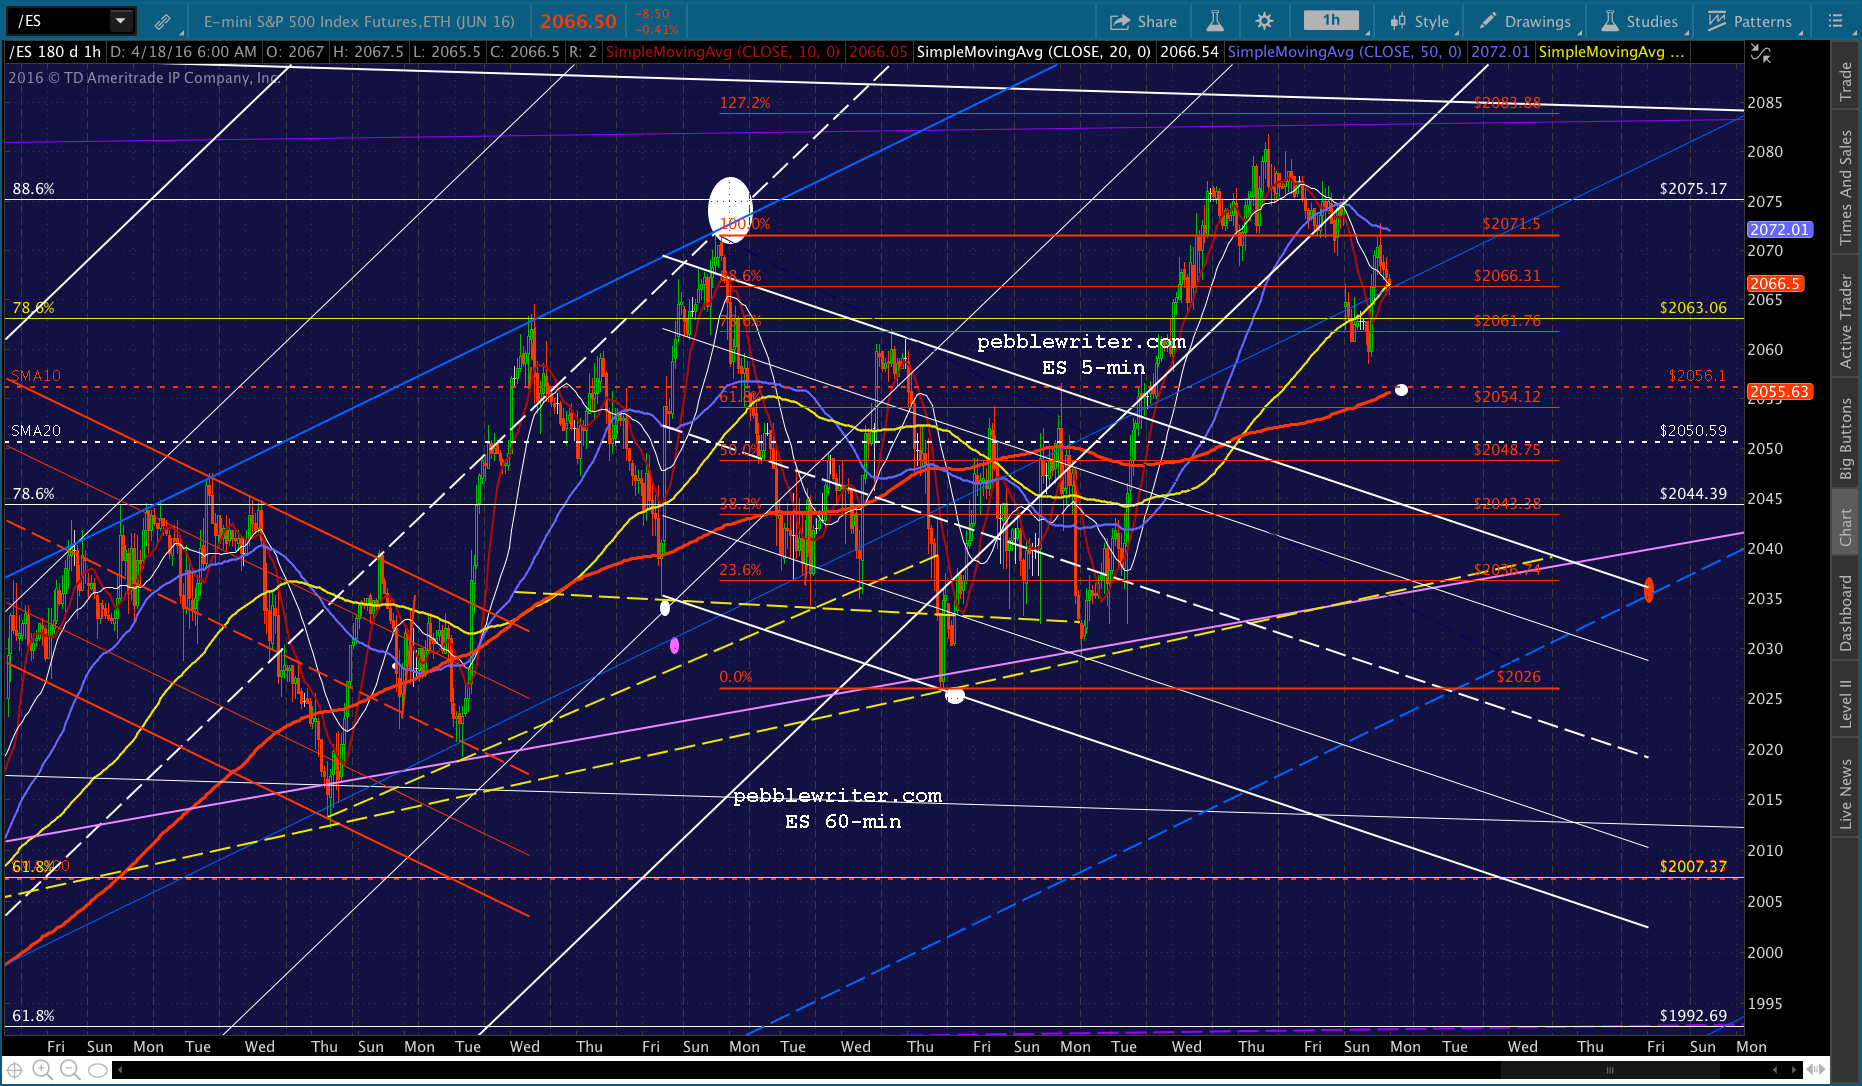 Ultimately, the charts call for a backtest of the SMA200 — but, that’s way down at 2007 and dropping. Would they allow that large a drop off? I’m not so sure. The more moderate sell off to purple channel midline — and a backtest of the broken white channel — would be 2036ish.
My best guess at this point is that SPX will settle back to backtest the SMA10 at 2061.71 — a 19 point loss from Friday’s close. It might find support on the way there at the purple midline around 2068. But, I doubt it will hold.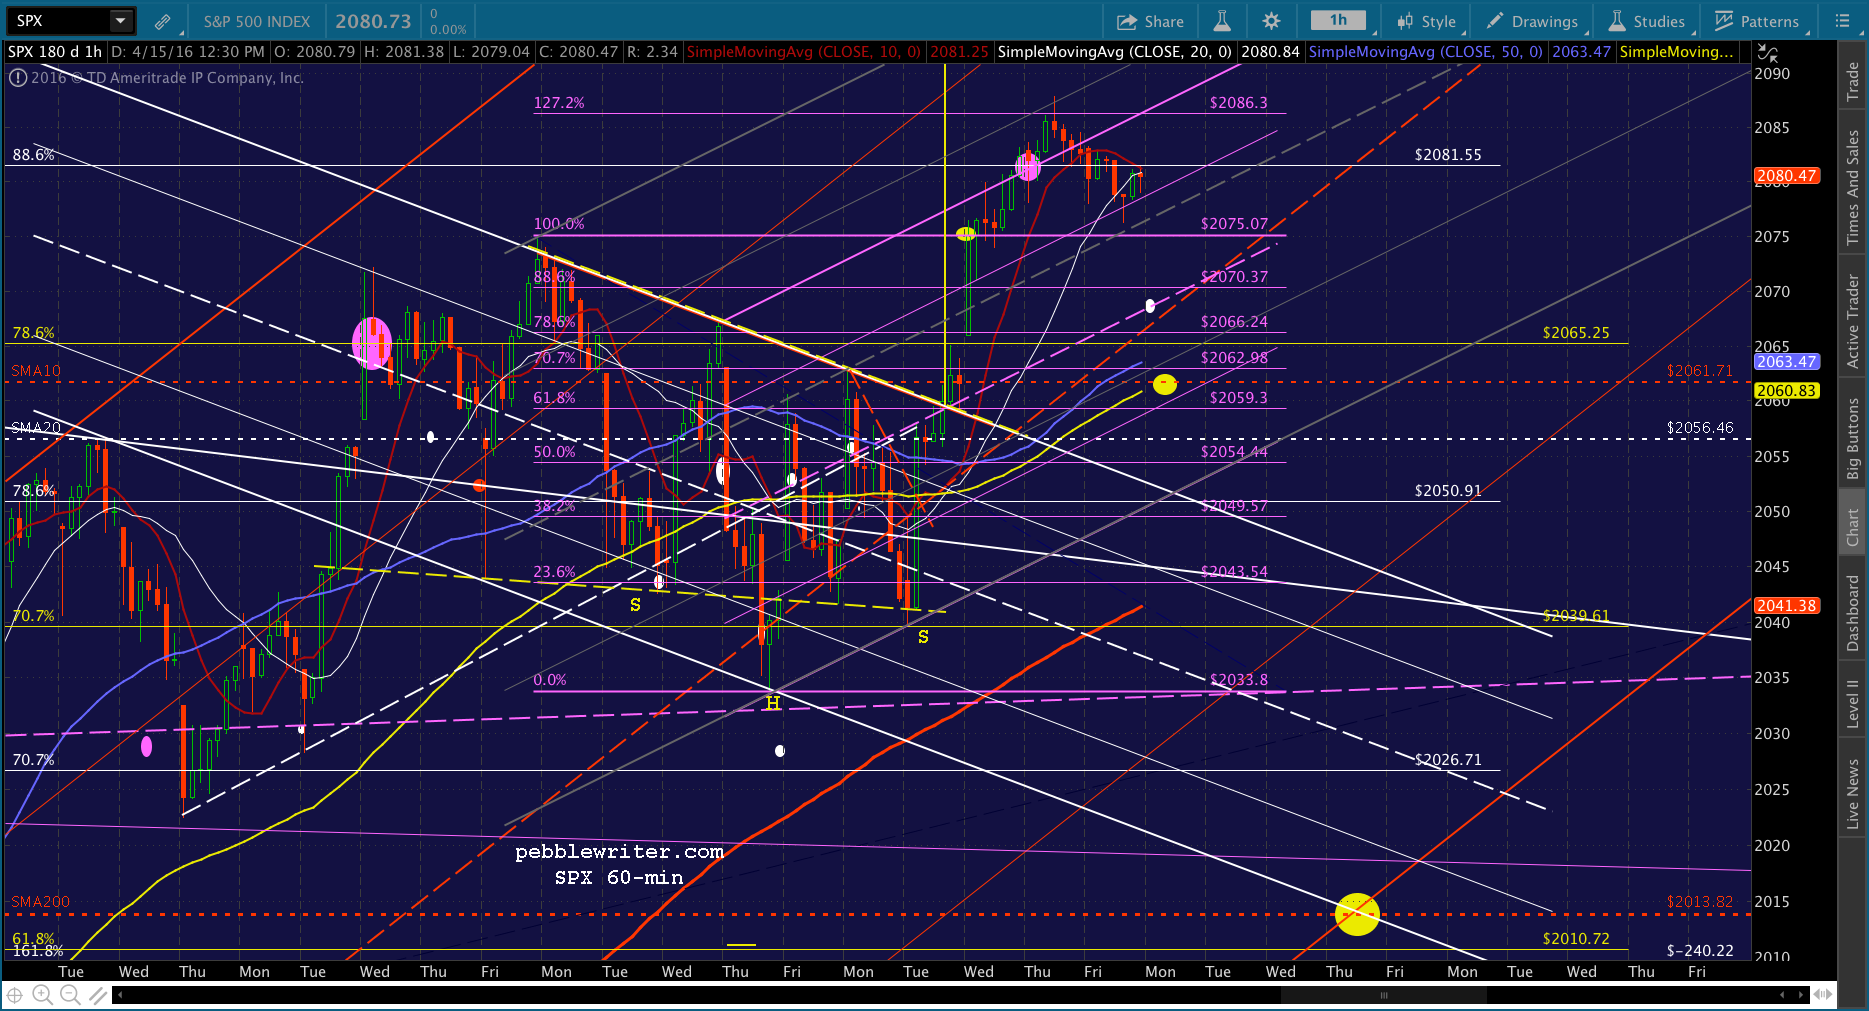 UPDATE: 9:57 AM
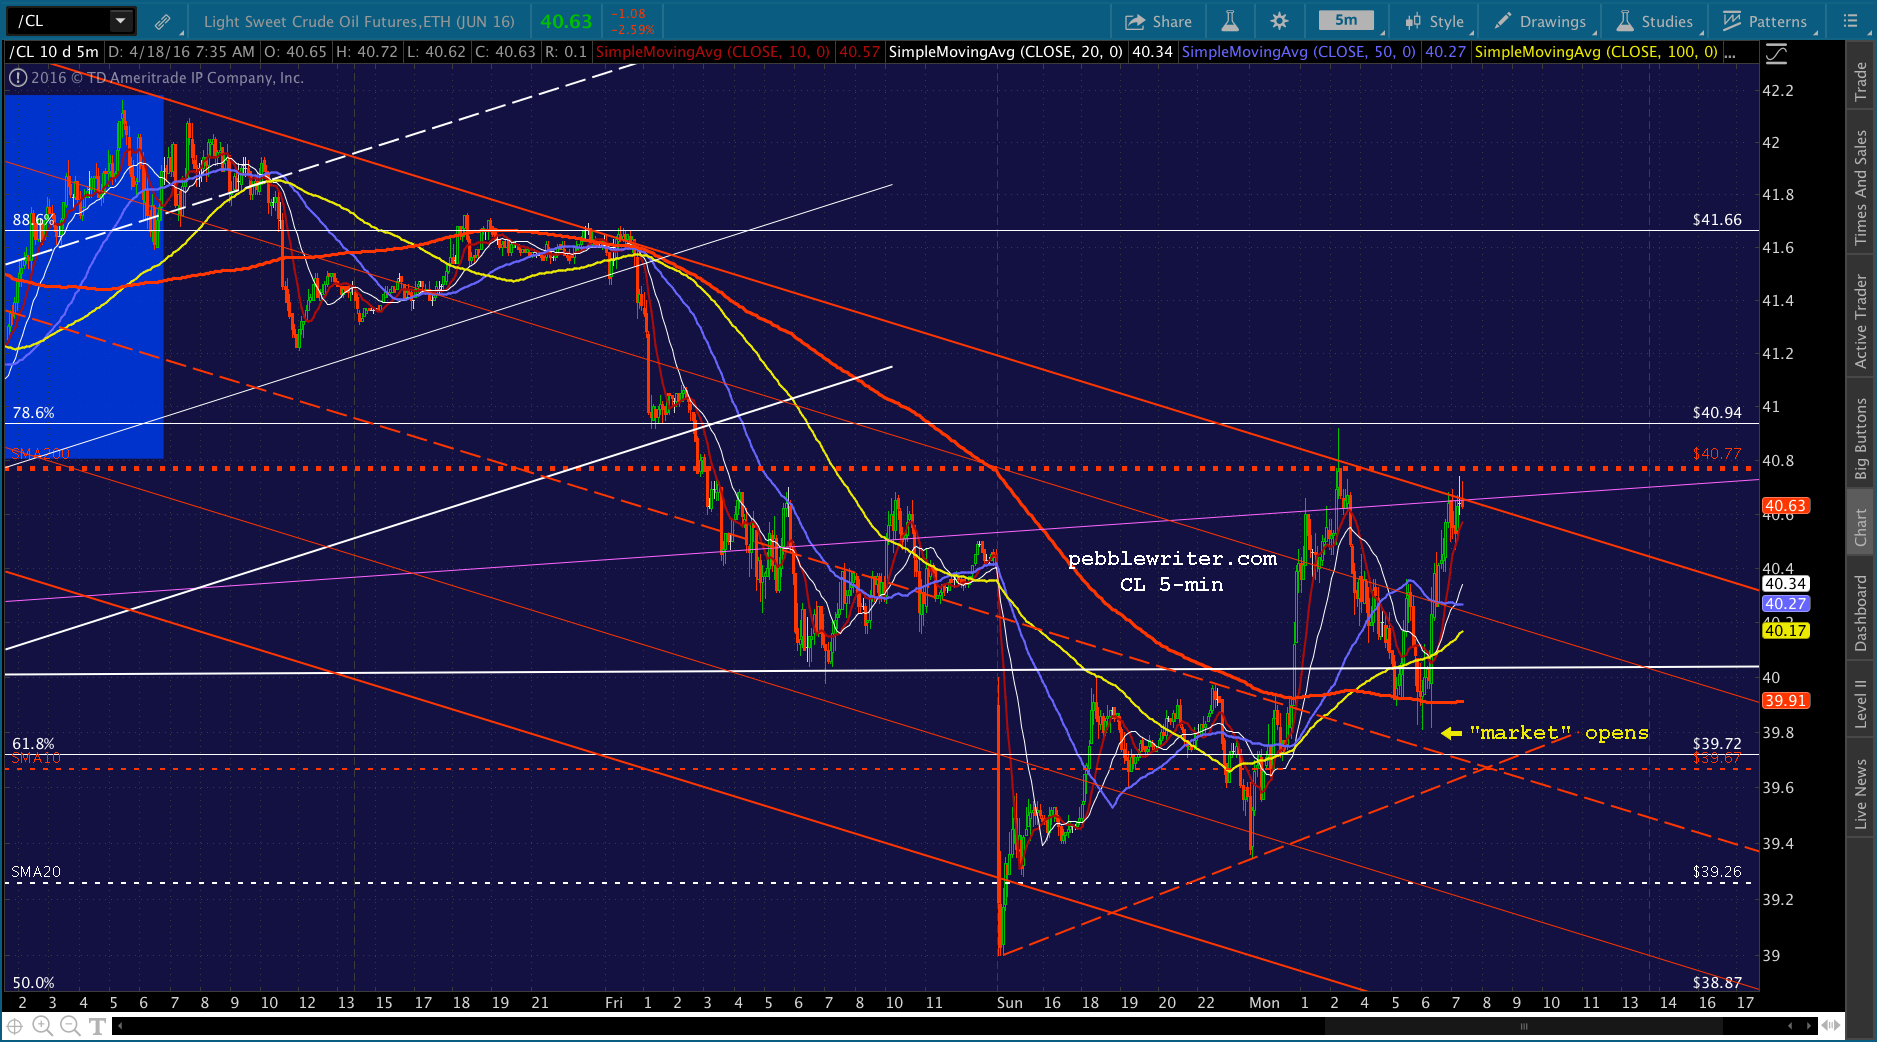
SPX has already closed this morning’s gap. But, CL seems to be running out of momentum. This should mark the reversal point if it’s going to drop any lower. I’d open a short position here at 2080.64 with stops around the SMA200 just above at 2081.10.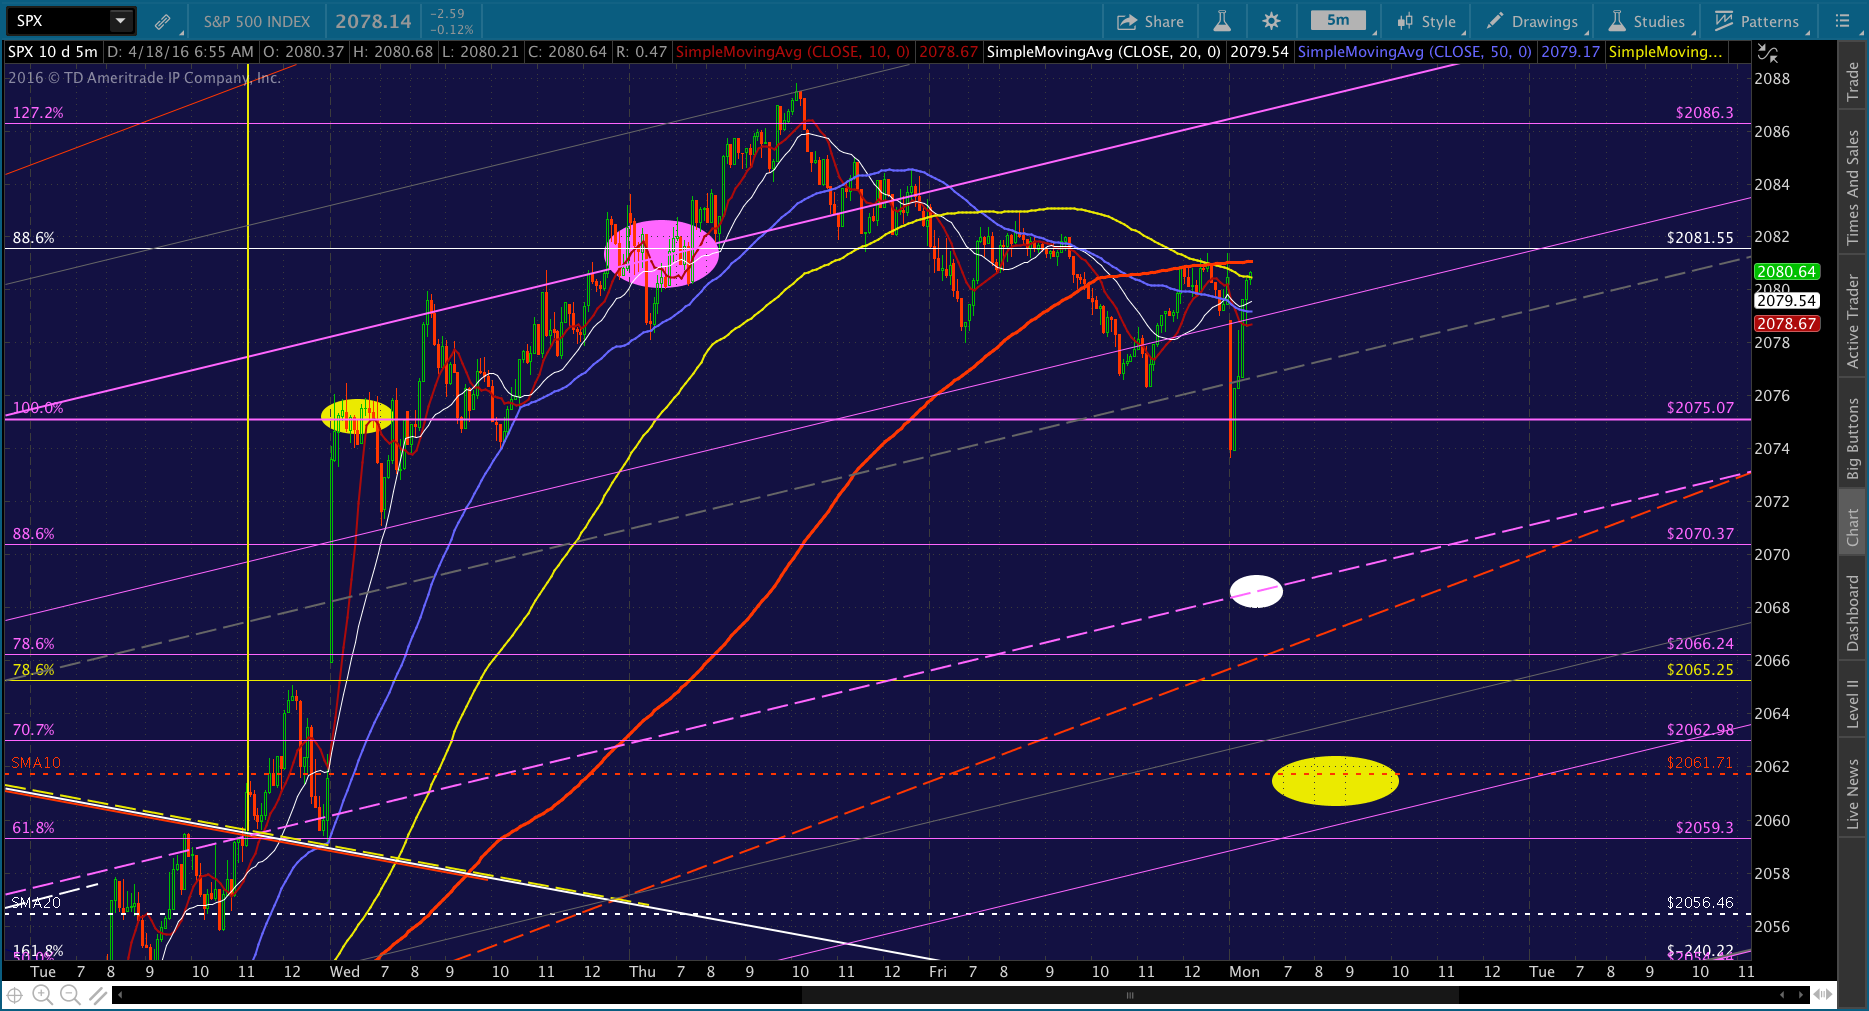 Be careful, though, as they could push CL up past the SMA200 at 40.77 and USDJPY on up out of the rising white channel. Note that ES has broken through the white TL from Thursday’s highs.
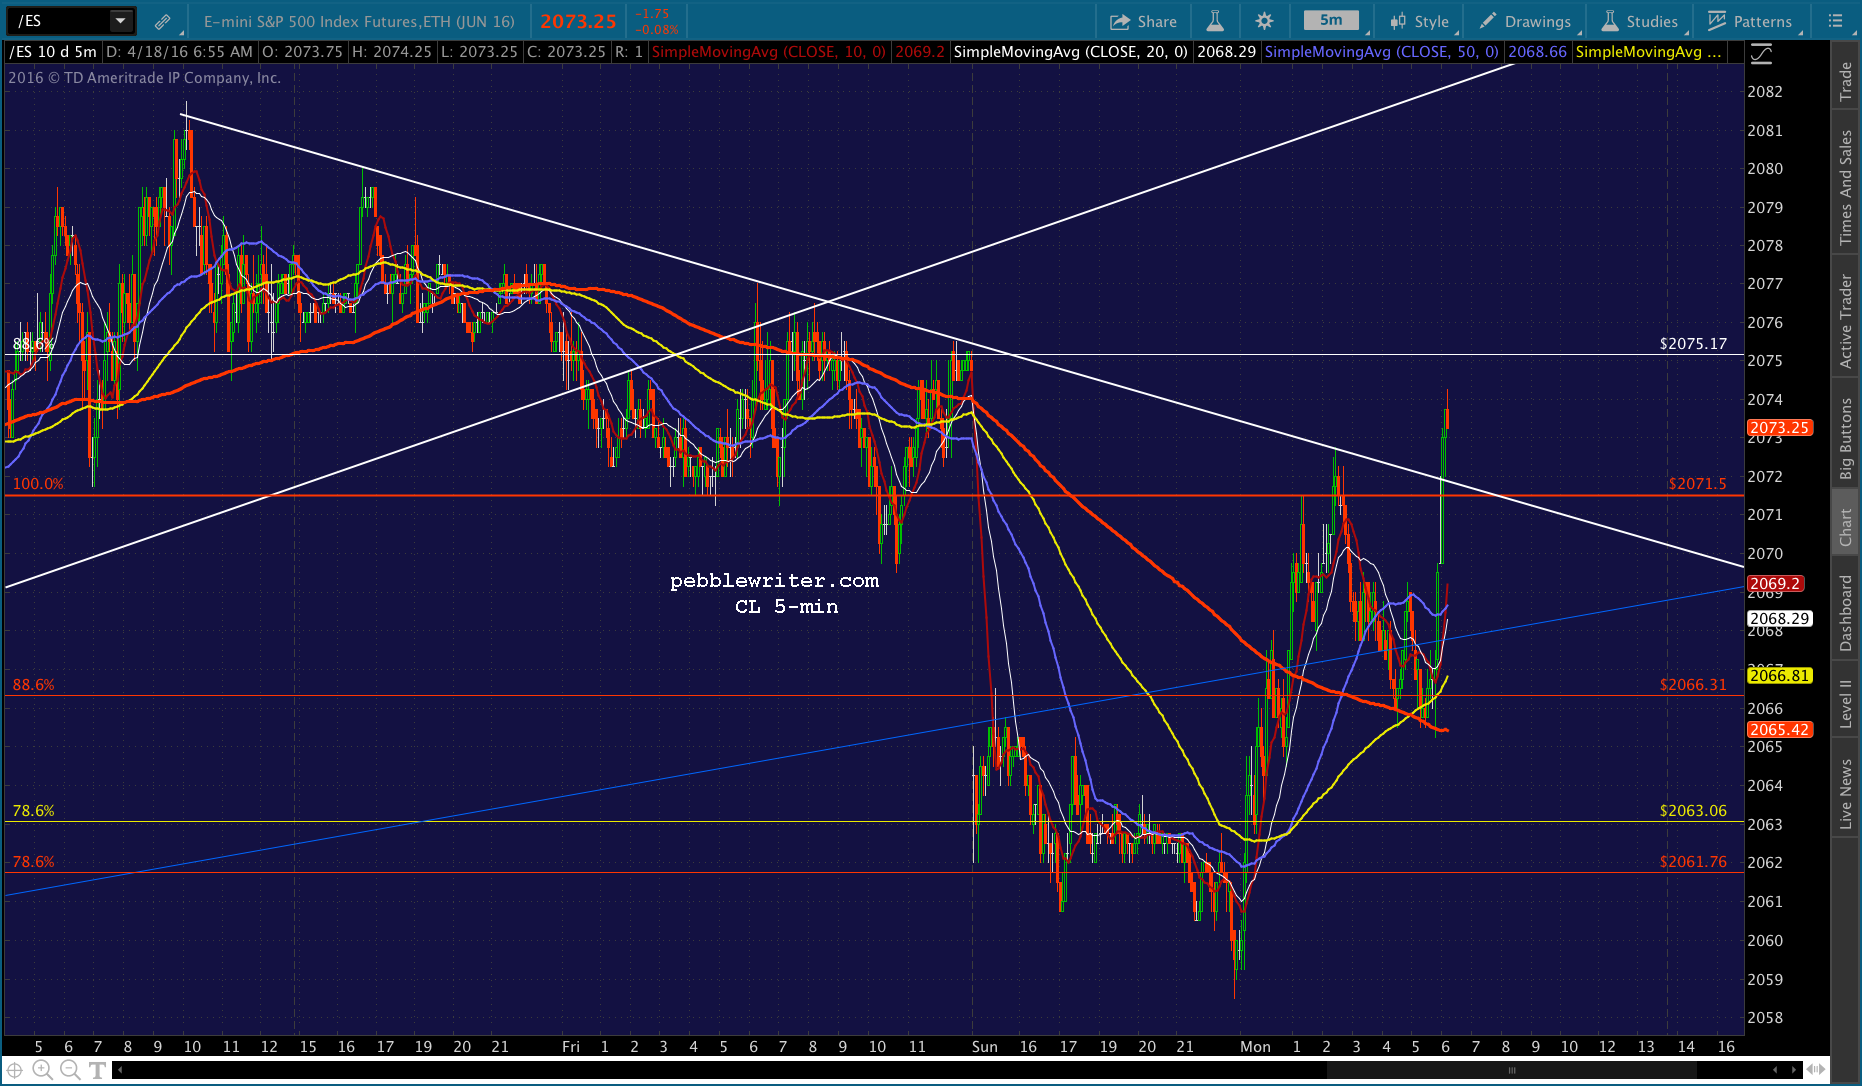
 UPDATE: 10:01 AM
Stopped out on the short. Sitting on the sidelines again.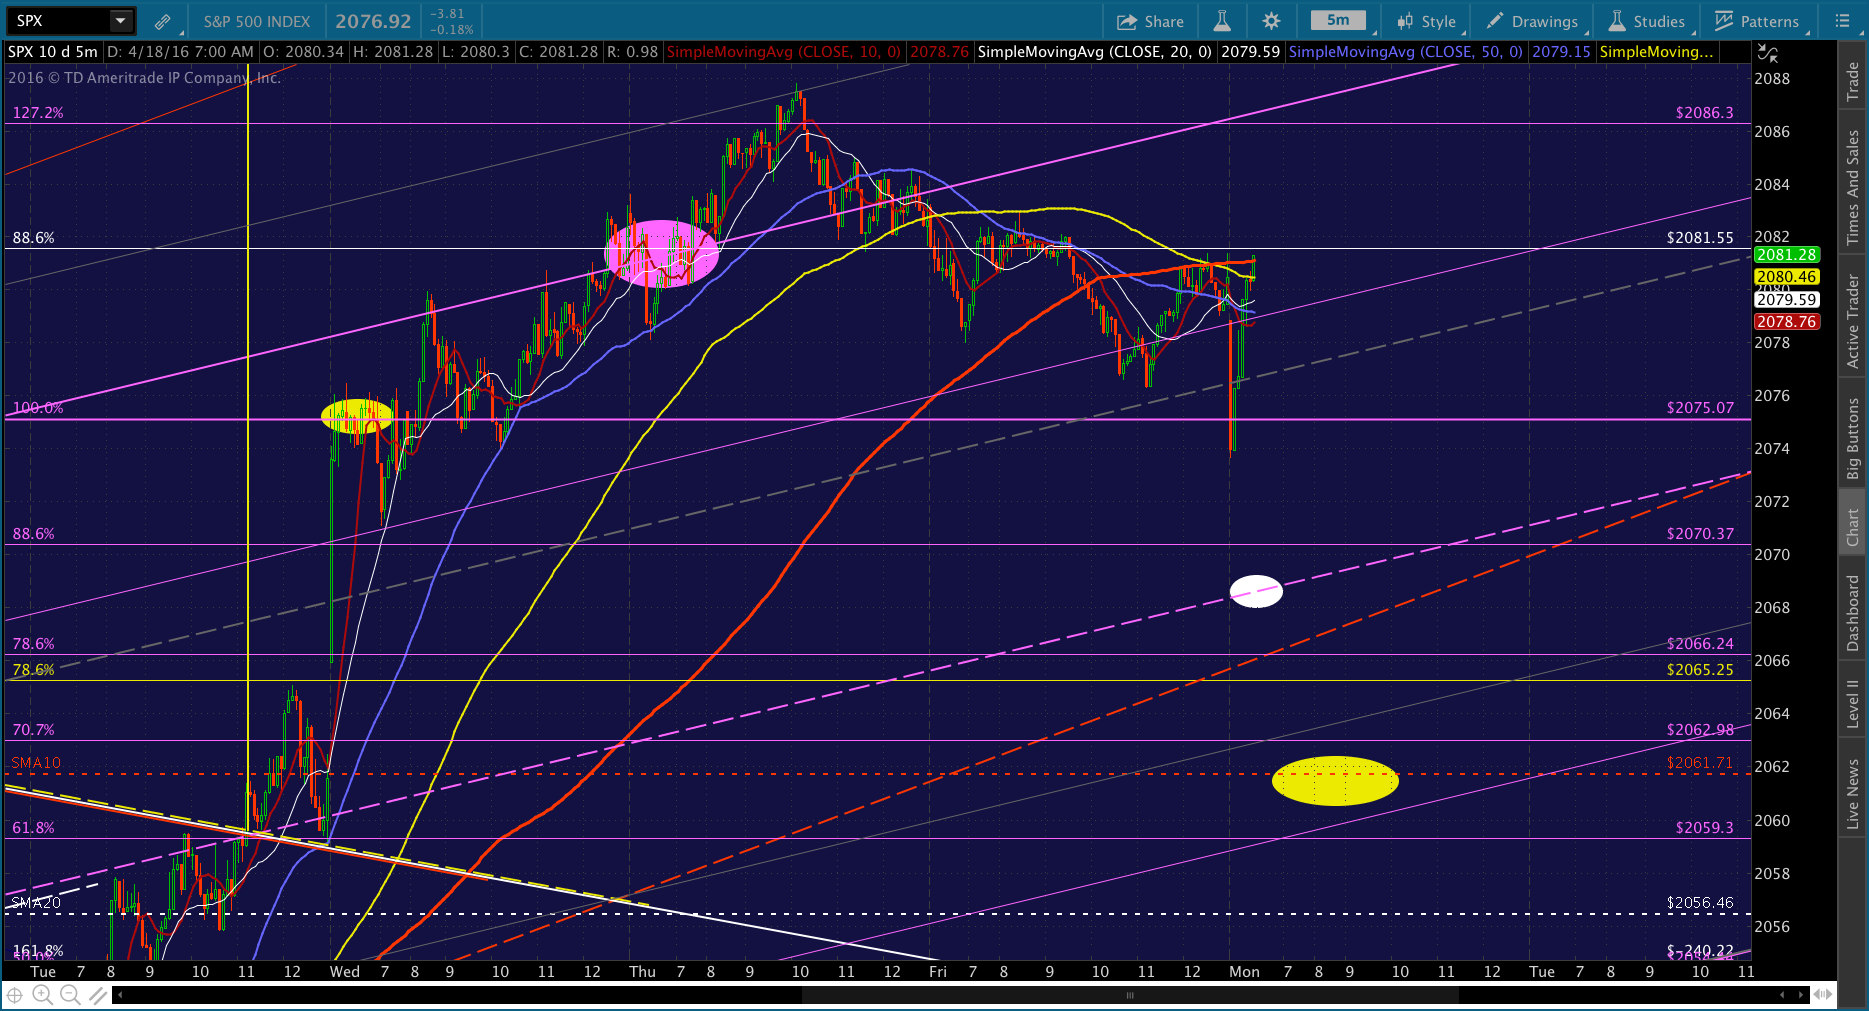 UPDATE: 10:08 AM
Taking another stab here at the .786. Back to short as CL is testing its channel top and another rising channel line. If it pushes through, dump it.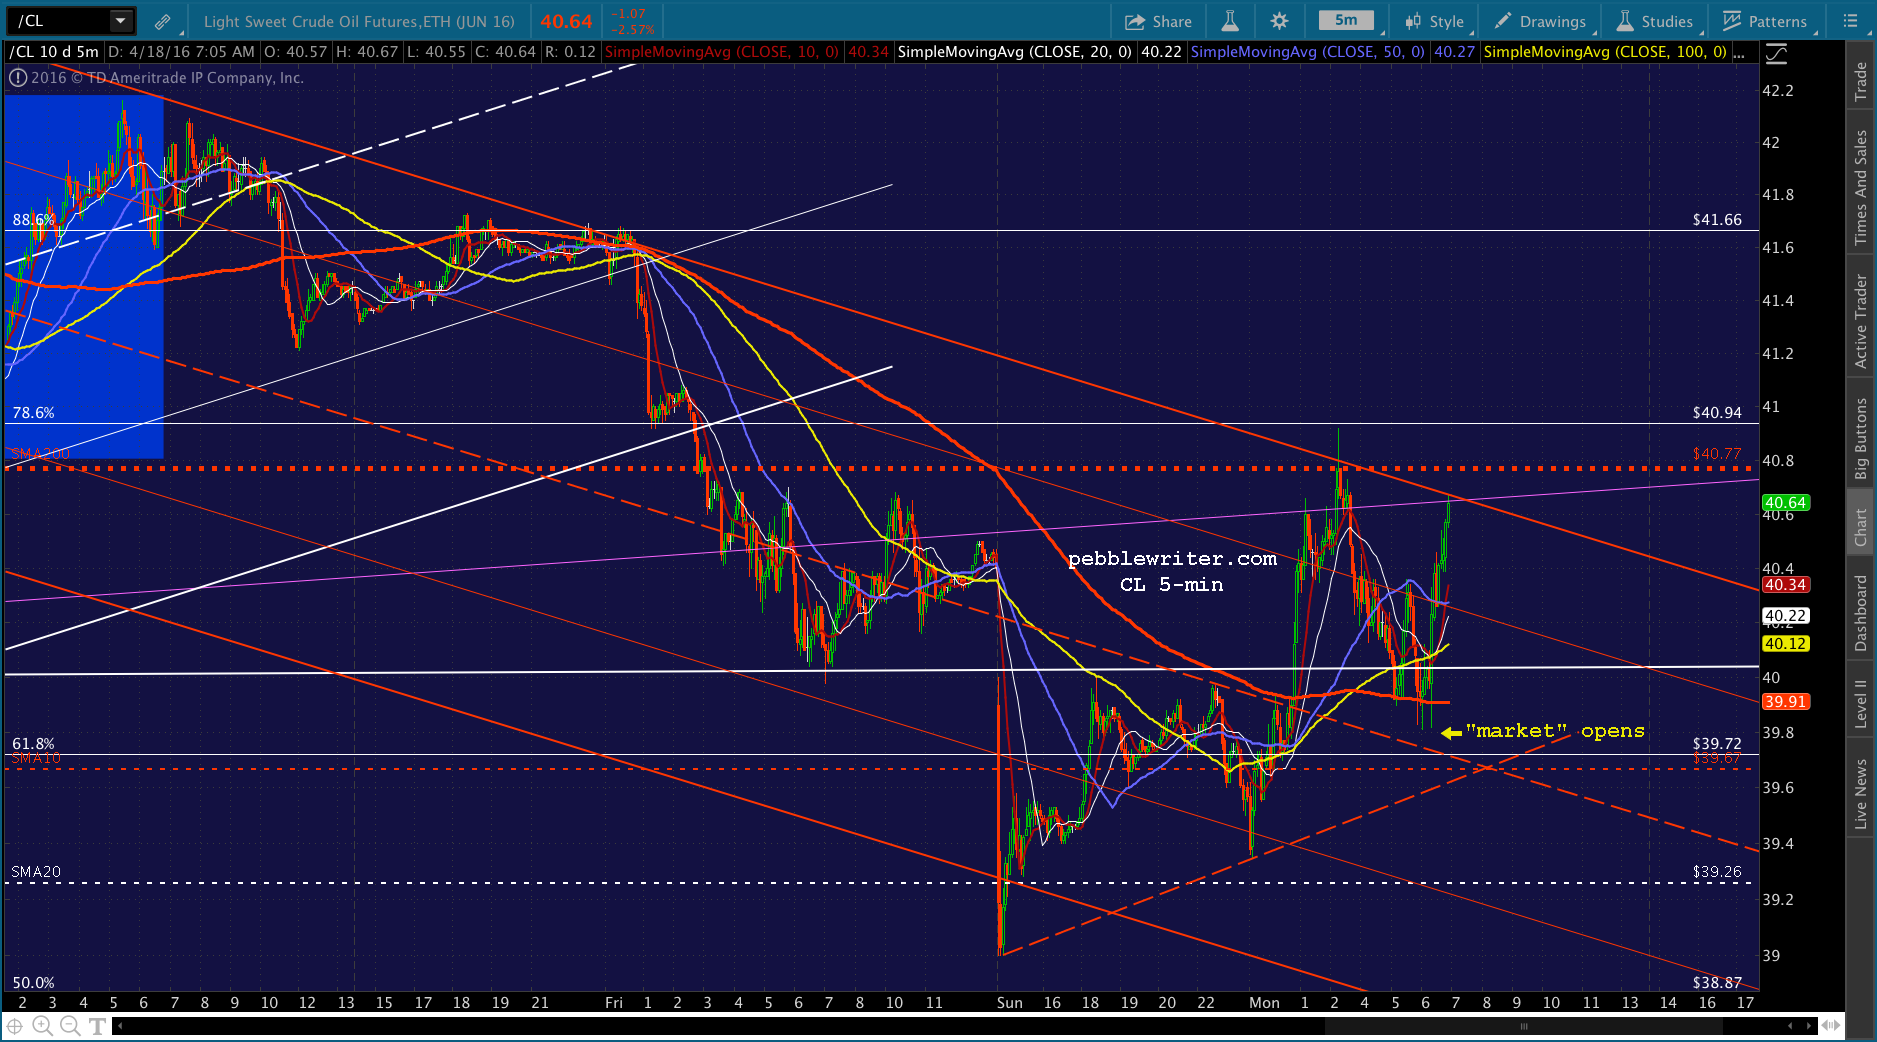
 Note that ES has reached its .886.
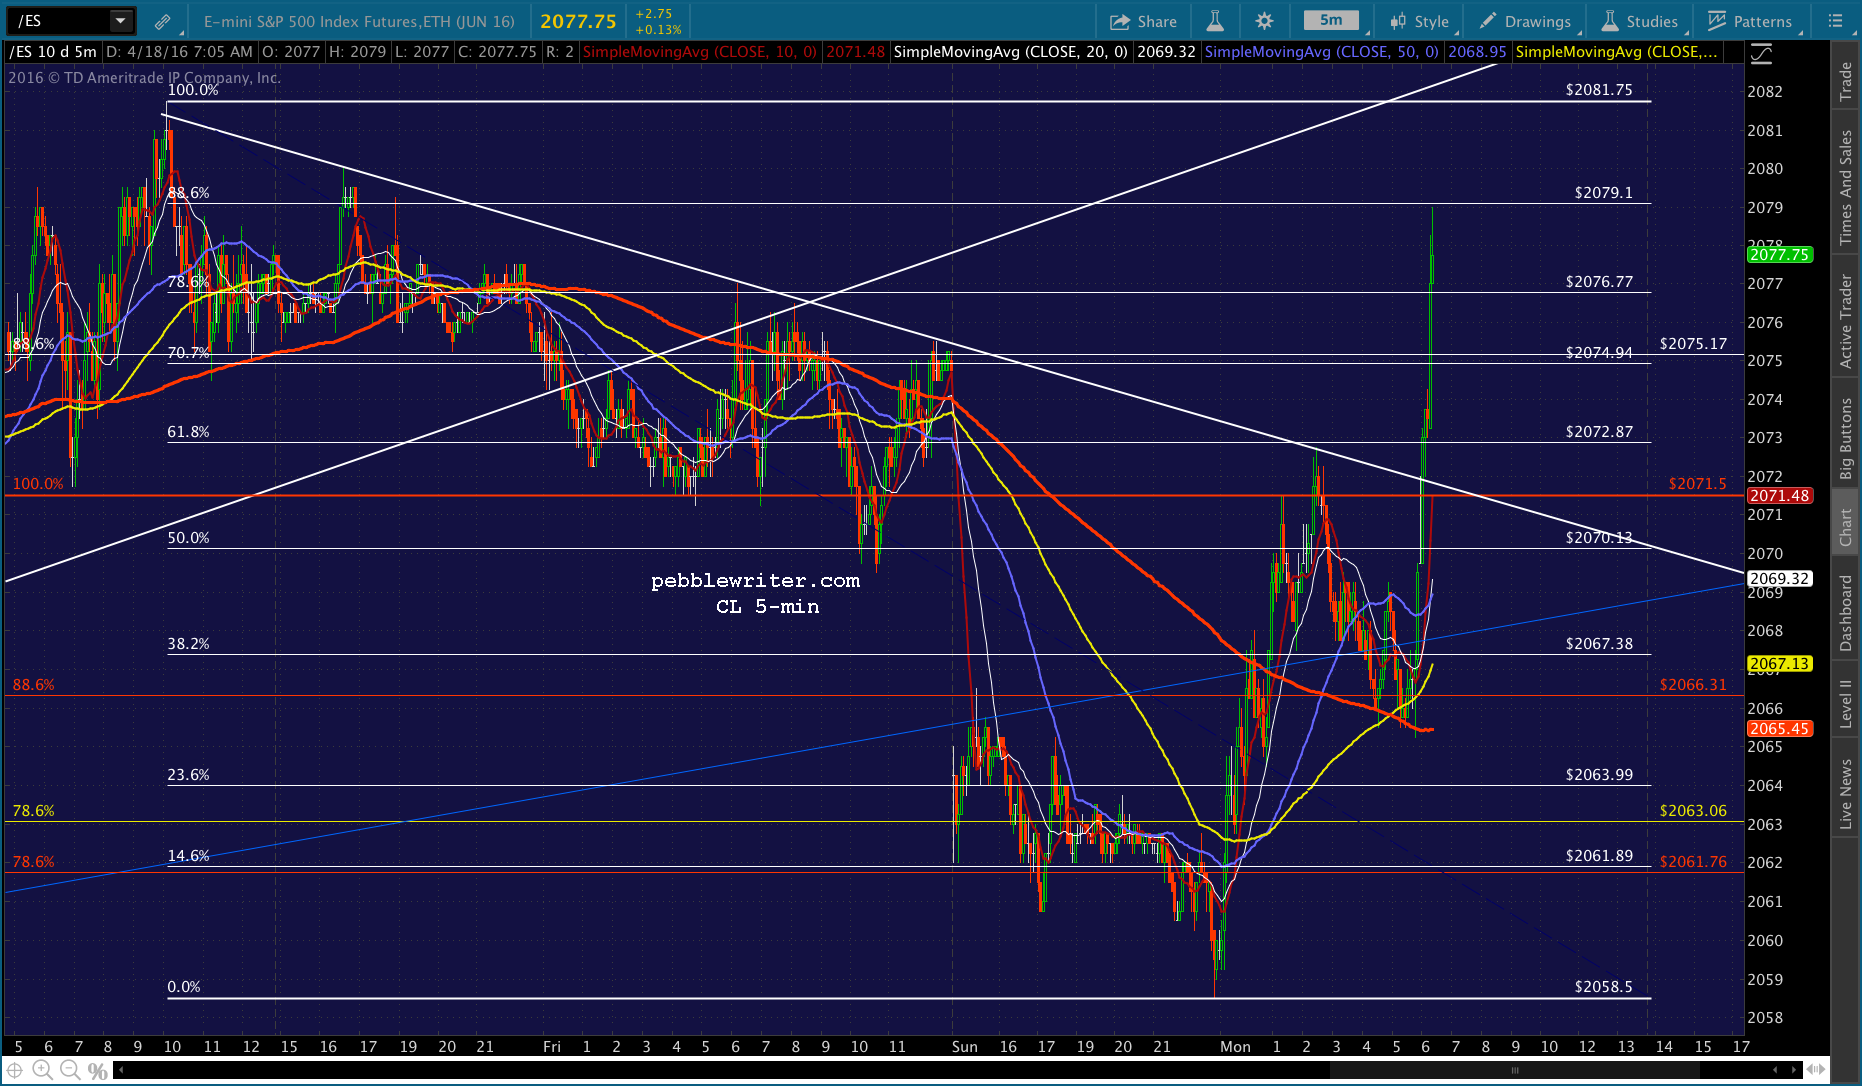 UPDATE: 10:25 AM
CL is merely acting like it’s going to break out, and SPX is slipping higher. Back to cash here until CL actually reverses. I don’t think it’ll break out, but it’s already defying all reason. And, its rebound alone was enough for SPX to get back to green.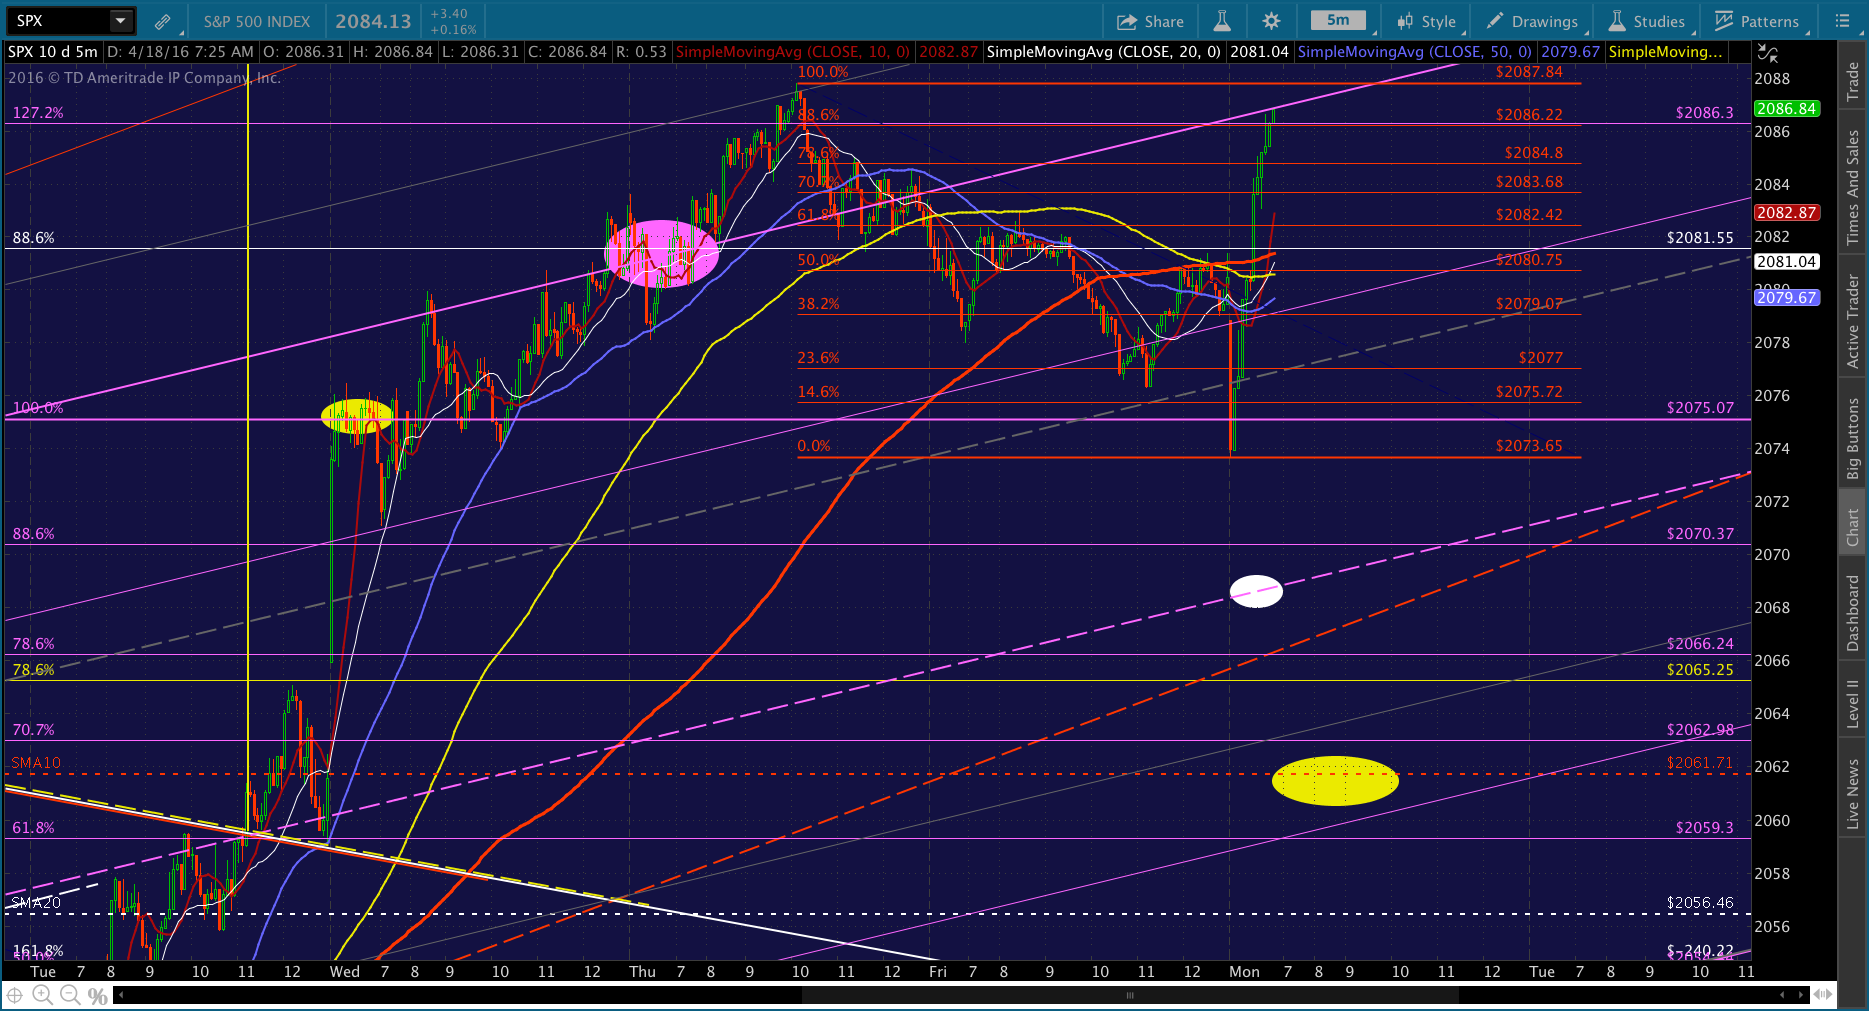
 UPDATE: 10:35 AM
Wish a new high established, this would be an opportune time to allow a backtest of the broken white channel. Back to short for 2081-2082. Again, if CL actually does break out, dump the short.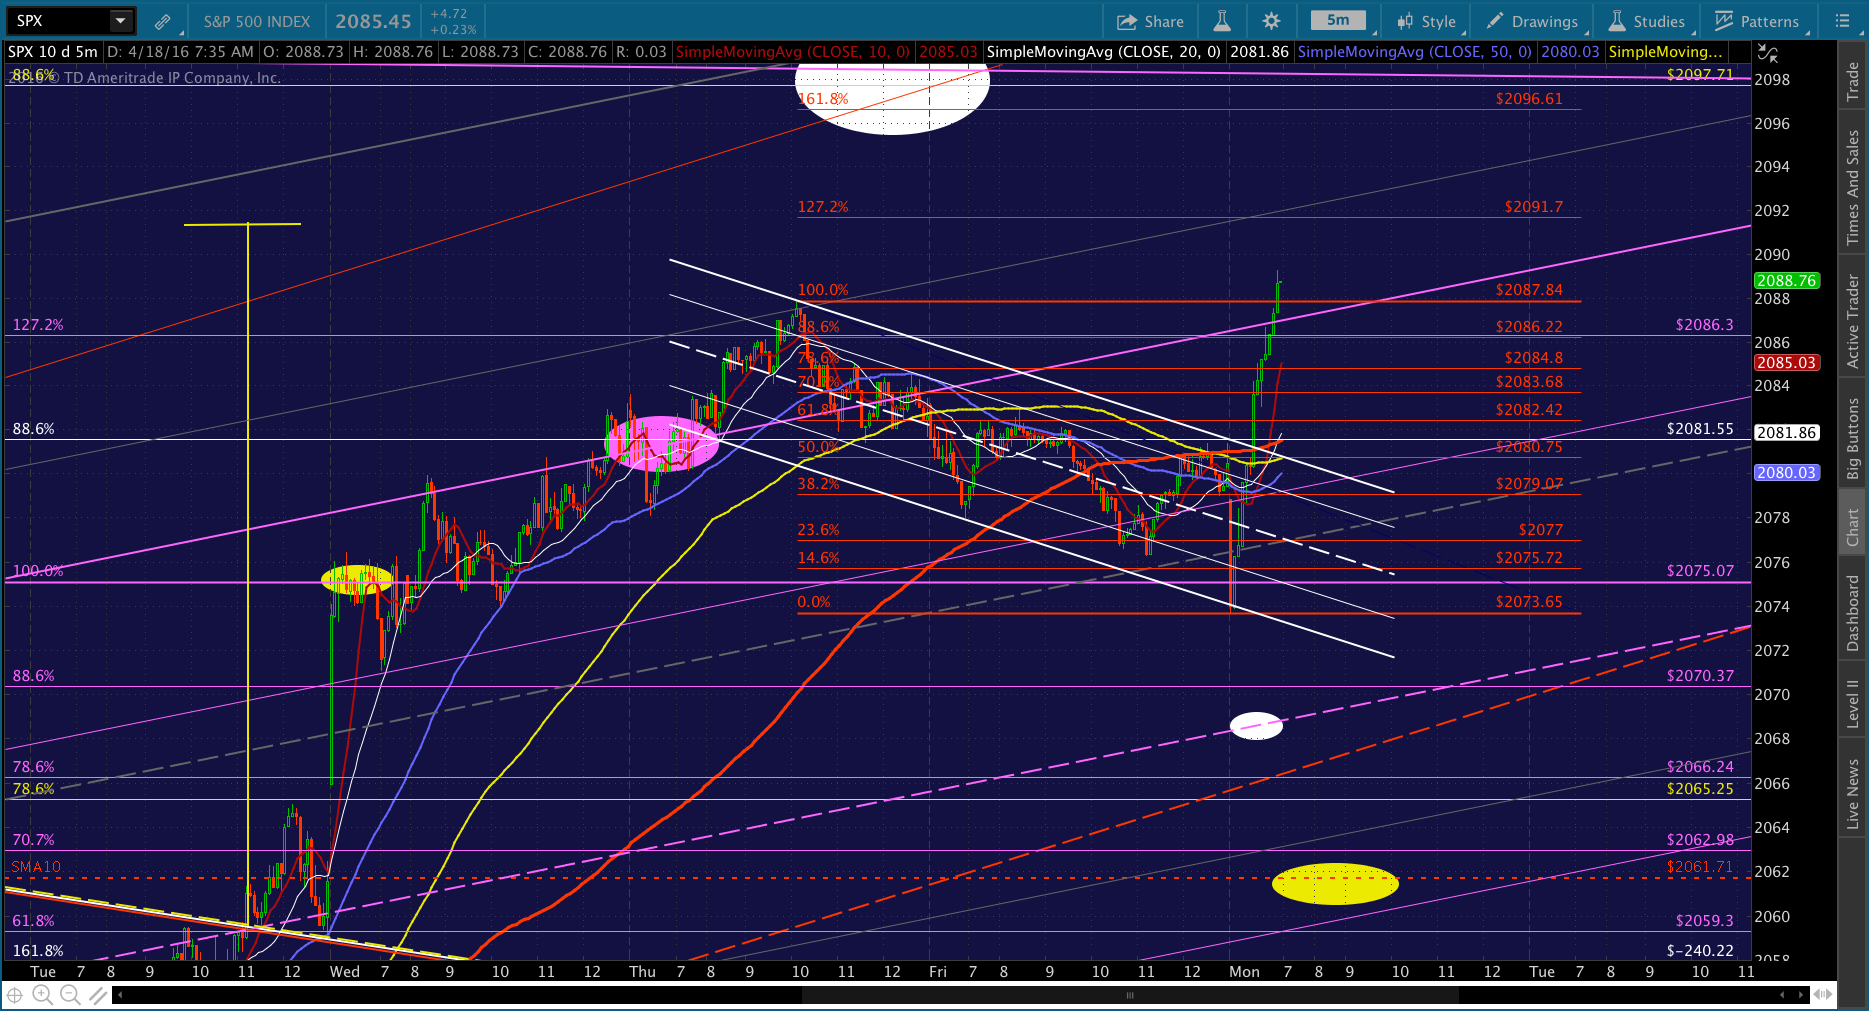
 Naturally, if CL should reverse strongly, our original downside targets are still entirely legitimate. Just doesn’t appear TPTB will allow it just yet (if at all.)
Note that ES has backtested its broken white channel. However, it backtested it back on Apr 7 and actually pushed back into the channel for the next week or so. In other words, take the backtest with a big pinch of salt.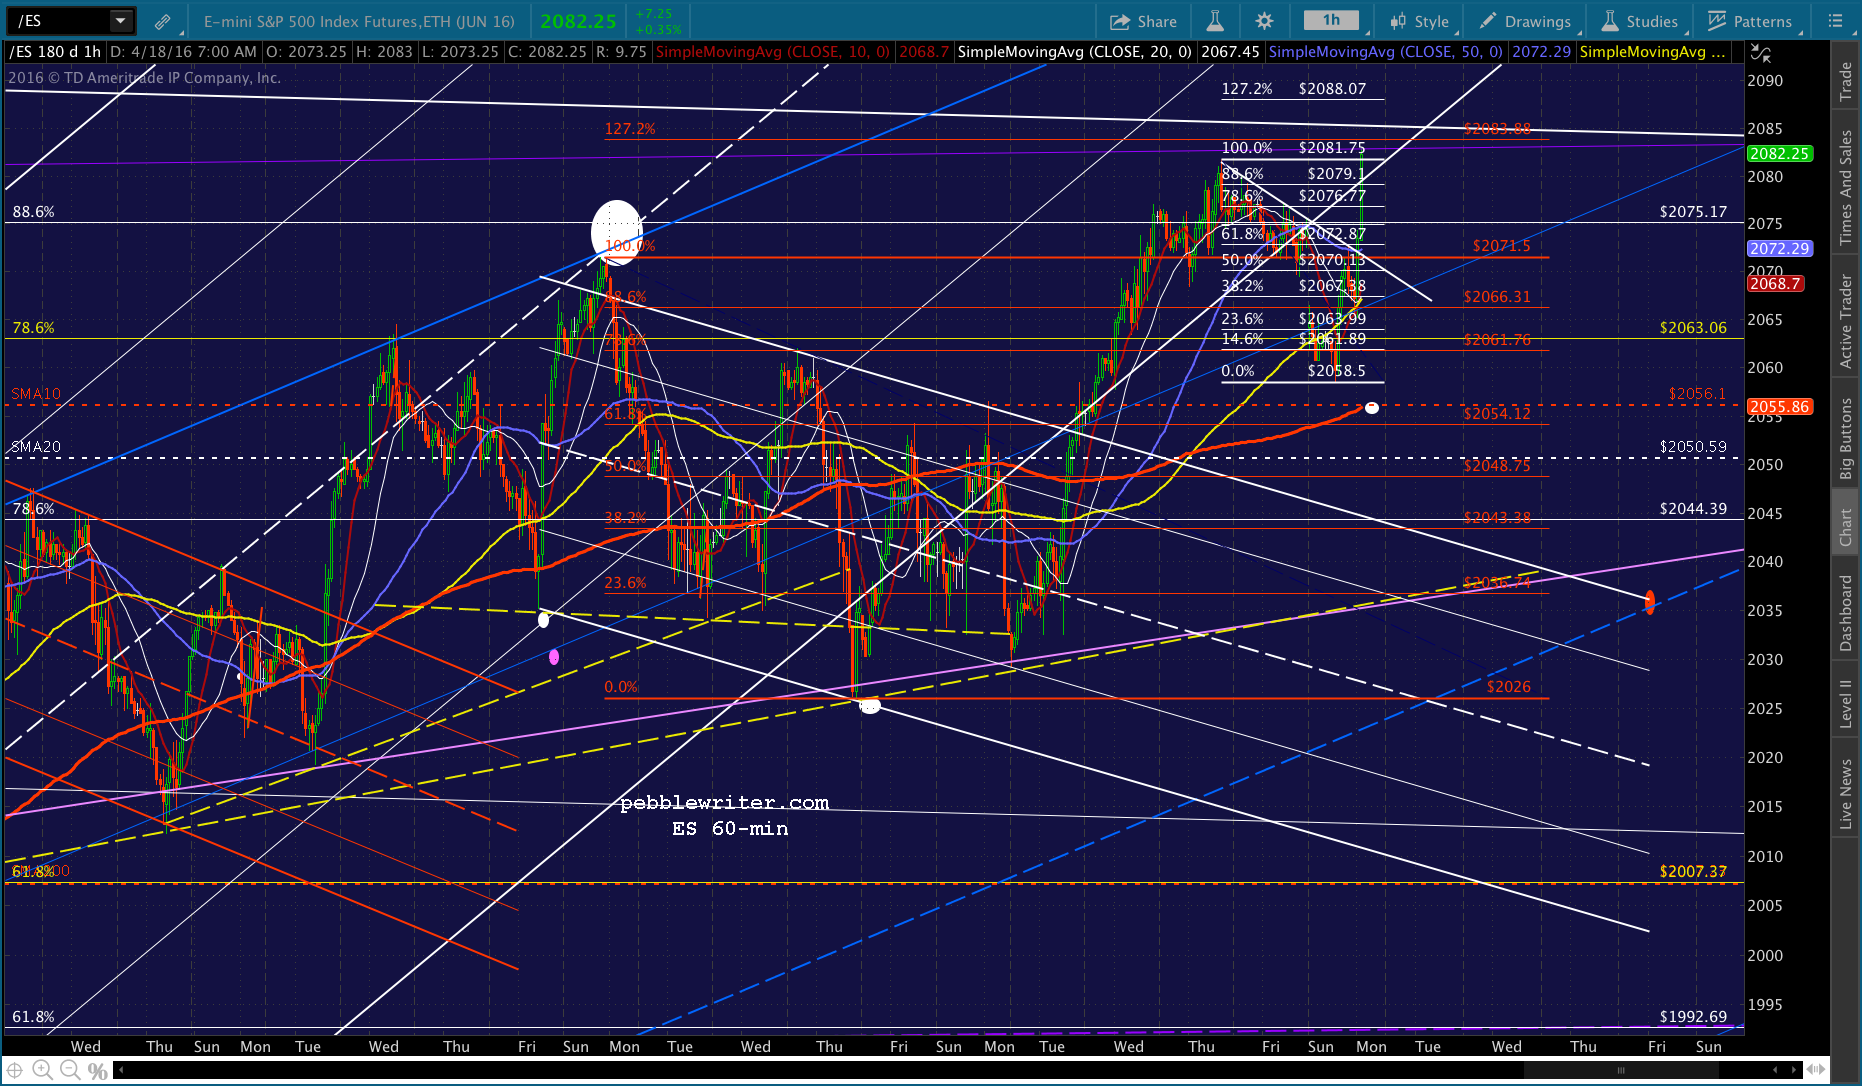 UPDATE: 11:19 AM
CL broke out, and SPX seems likely to tag its red 1.272 or even sip up to the yellow .886 at 2097.71 — if CL supports it. This could run its course with the euro close, but who knows? At the very least, I’d tighten up stops.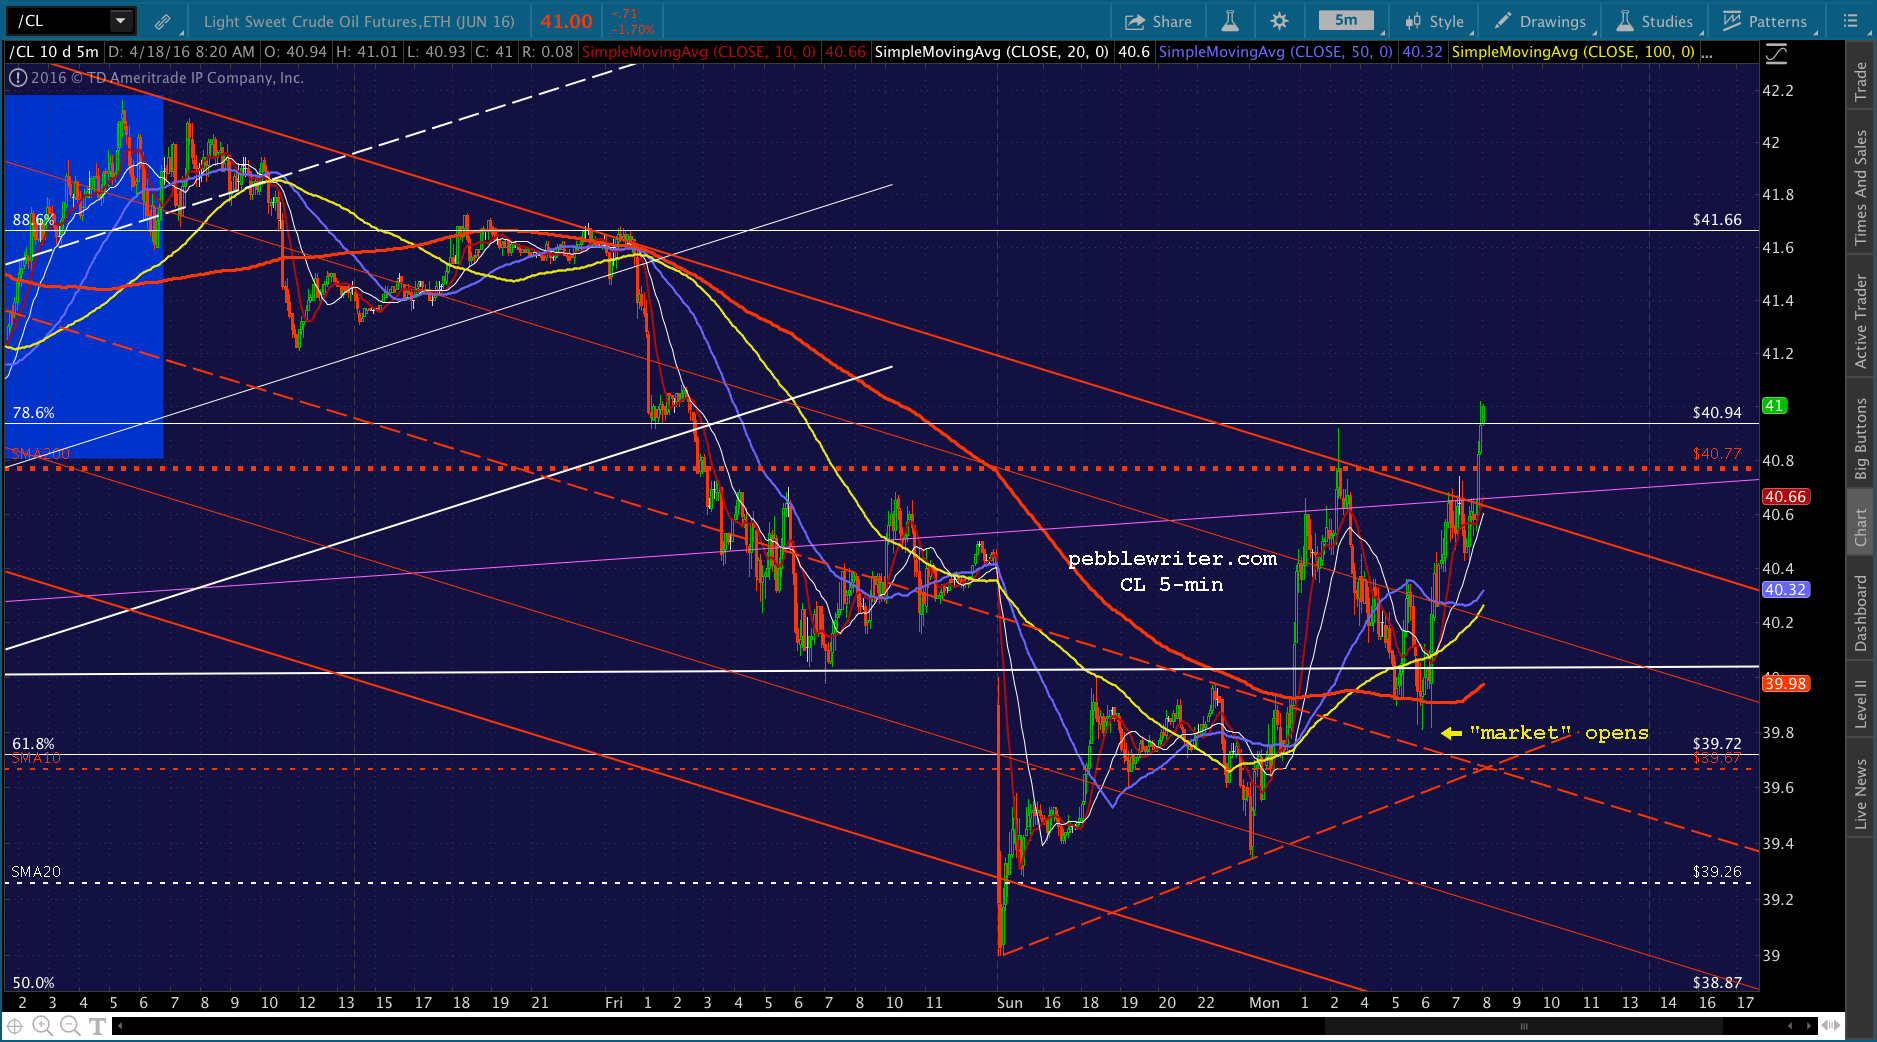
 UPDATE: 12:21 PM
They’re not going to let it back down, at least not yet. Back to cash as USDJPY is hitting new highs.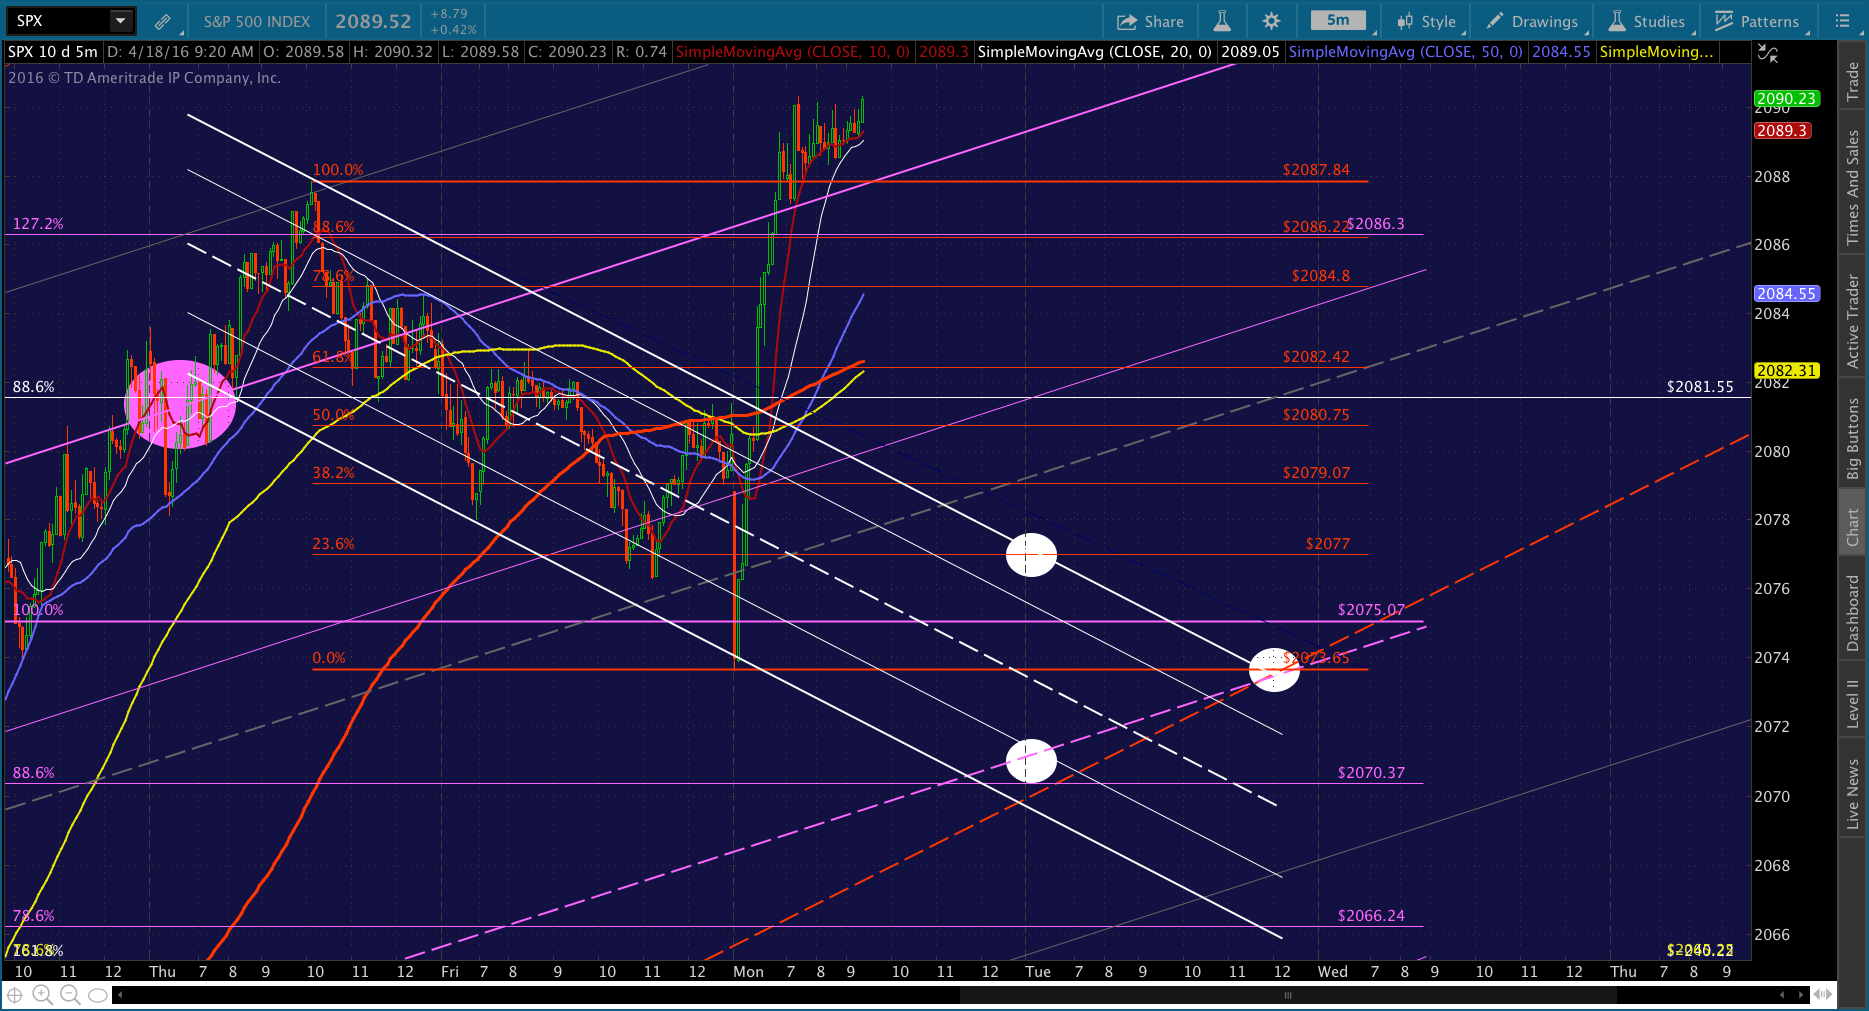
 UPDATE: 12:36 PM
Put up or shut up time for SPX, and in particular, ES. I’d short here and see whether it’s really to push through in the midst of all the negative news.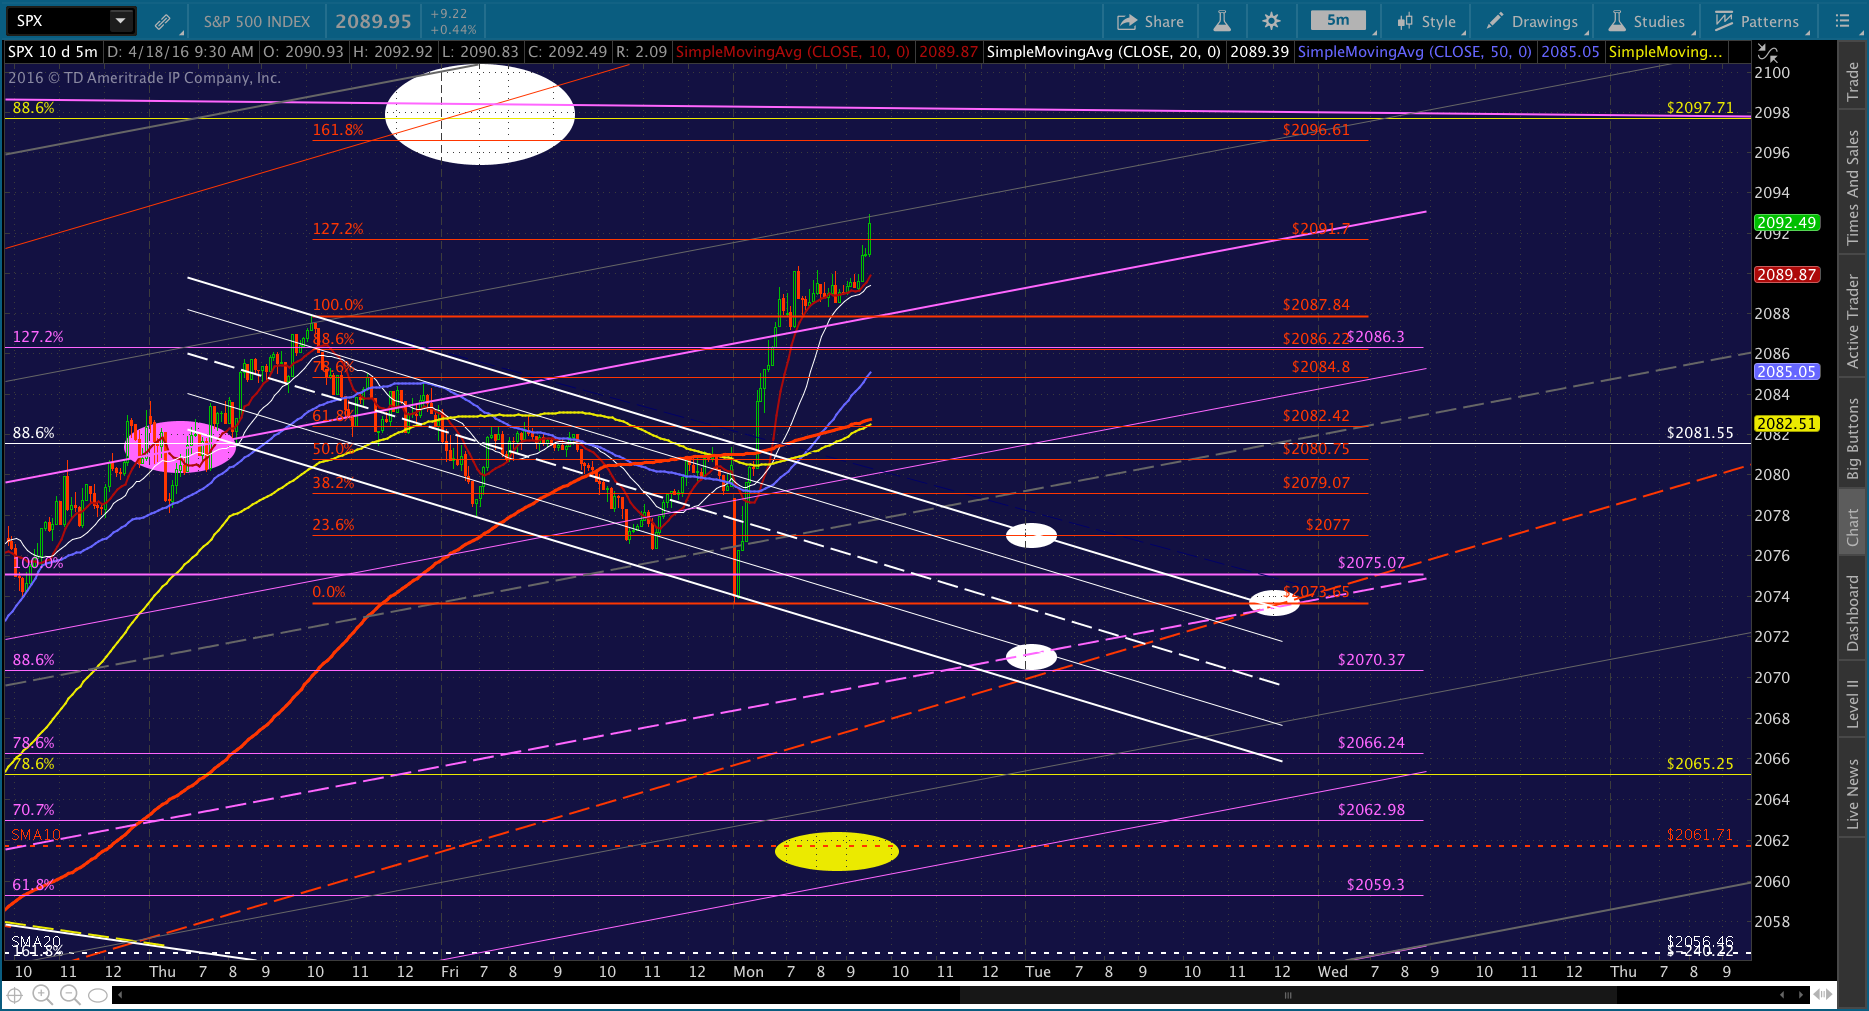 Note the top of the falling white channel, and a .886 retrace of the drop following the initial .886 retrace last November.
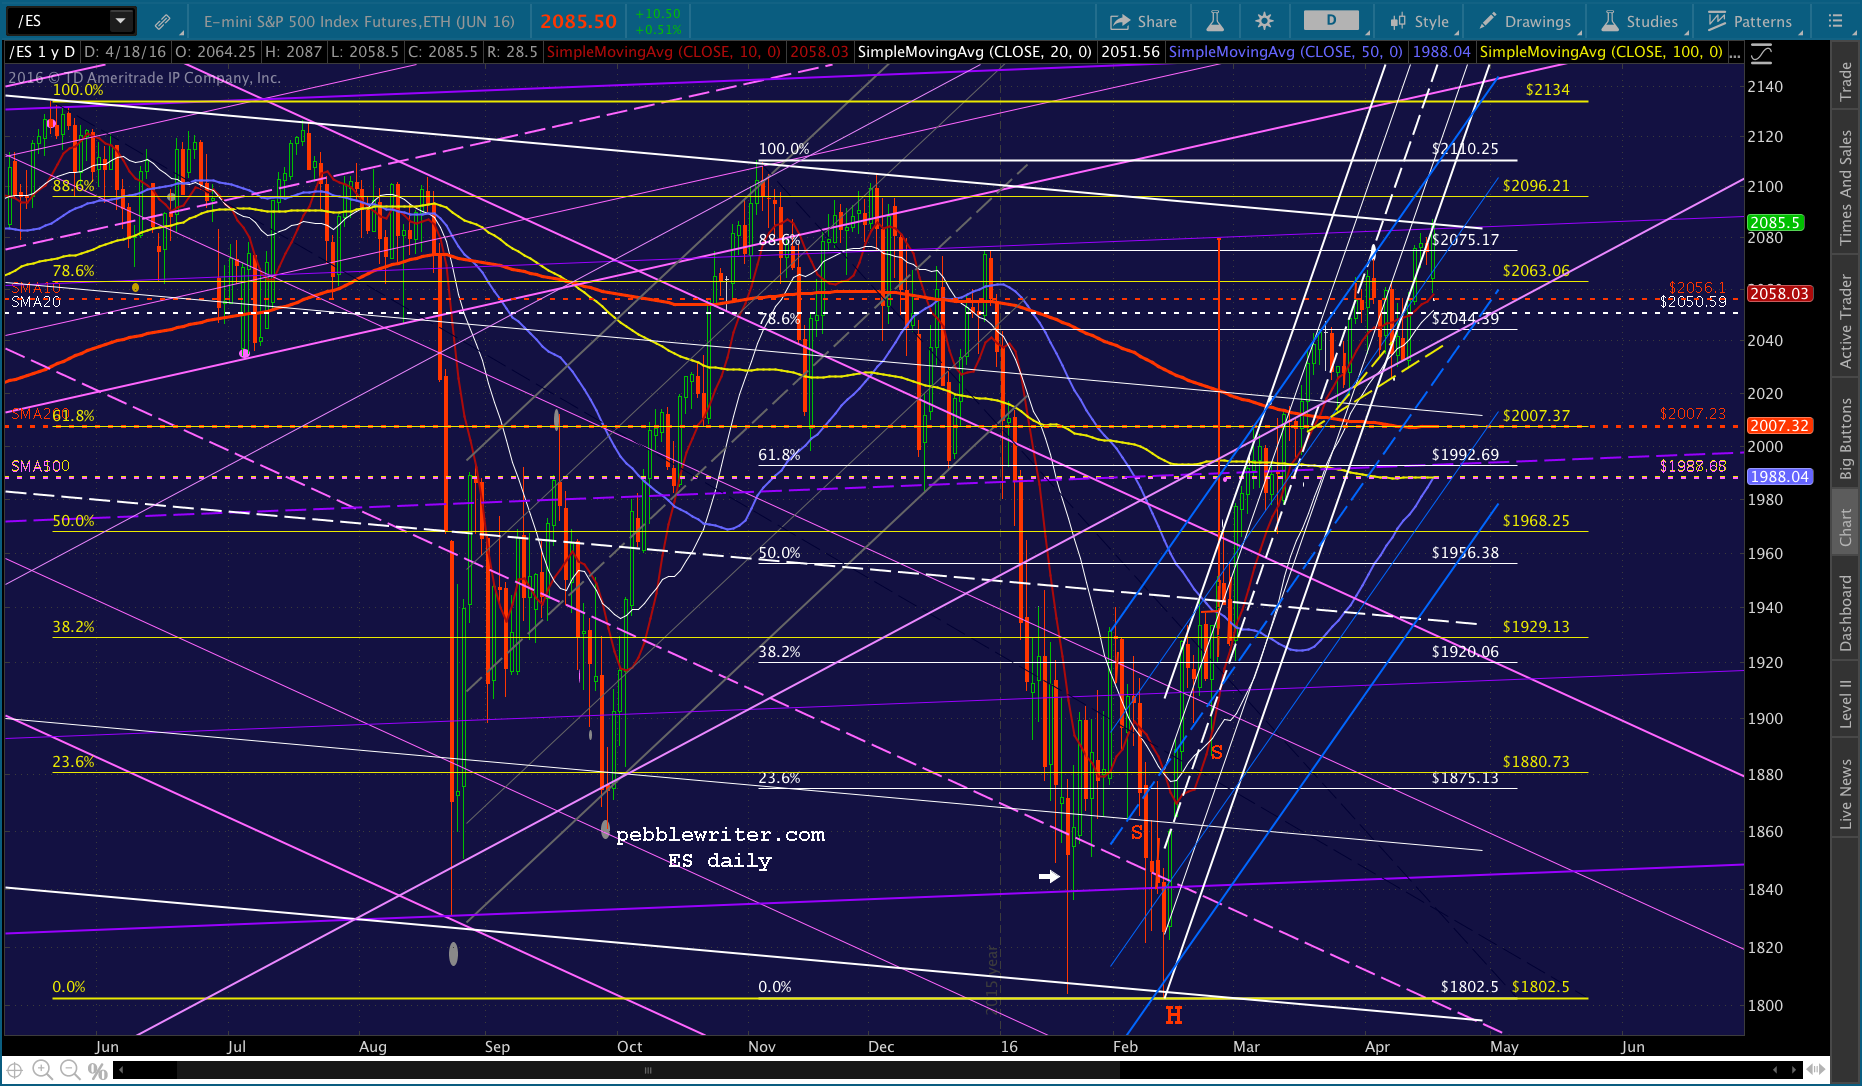 UPDATE: 3:56 PM
Could break either way, but if rational thought returns then you’d want to be short for it. I rarely recommend short positions overnight, but this might be one to make an exception for as long as you can watch and/or hedge.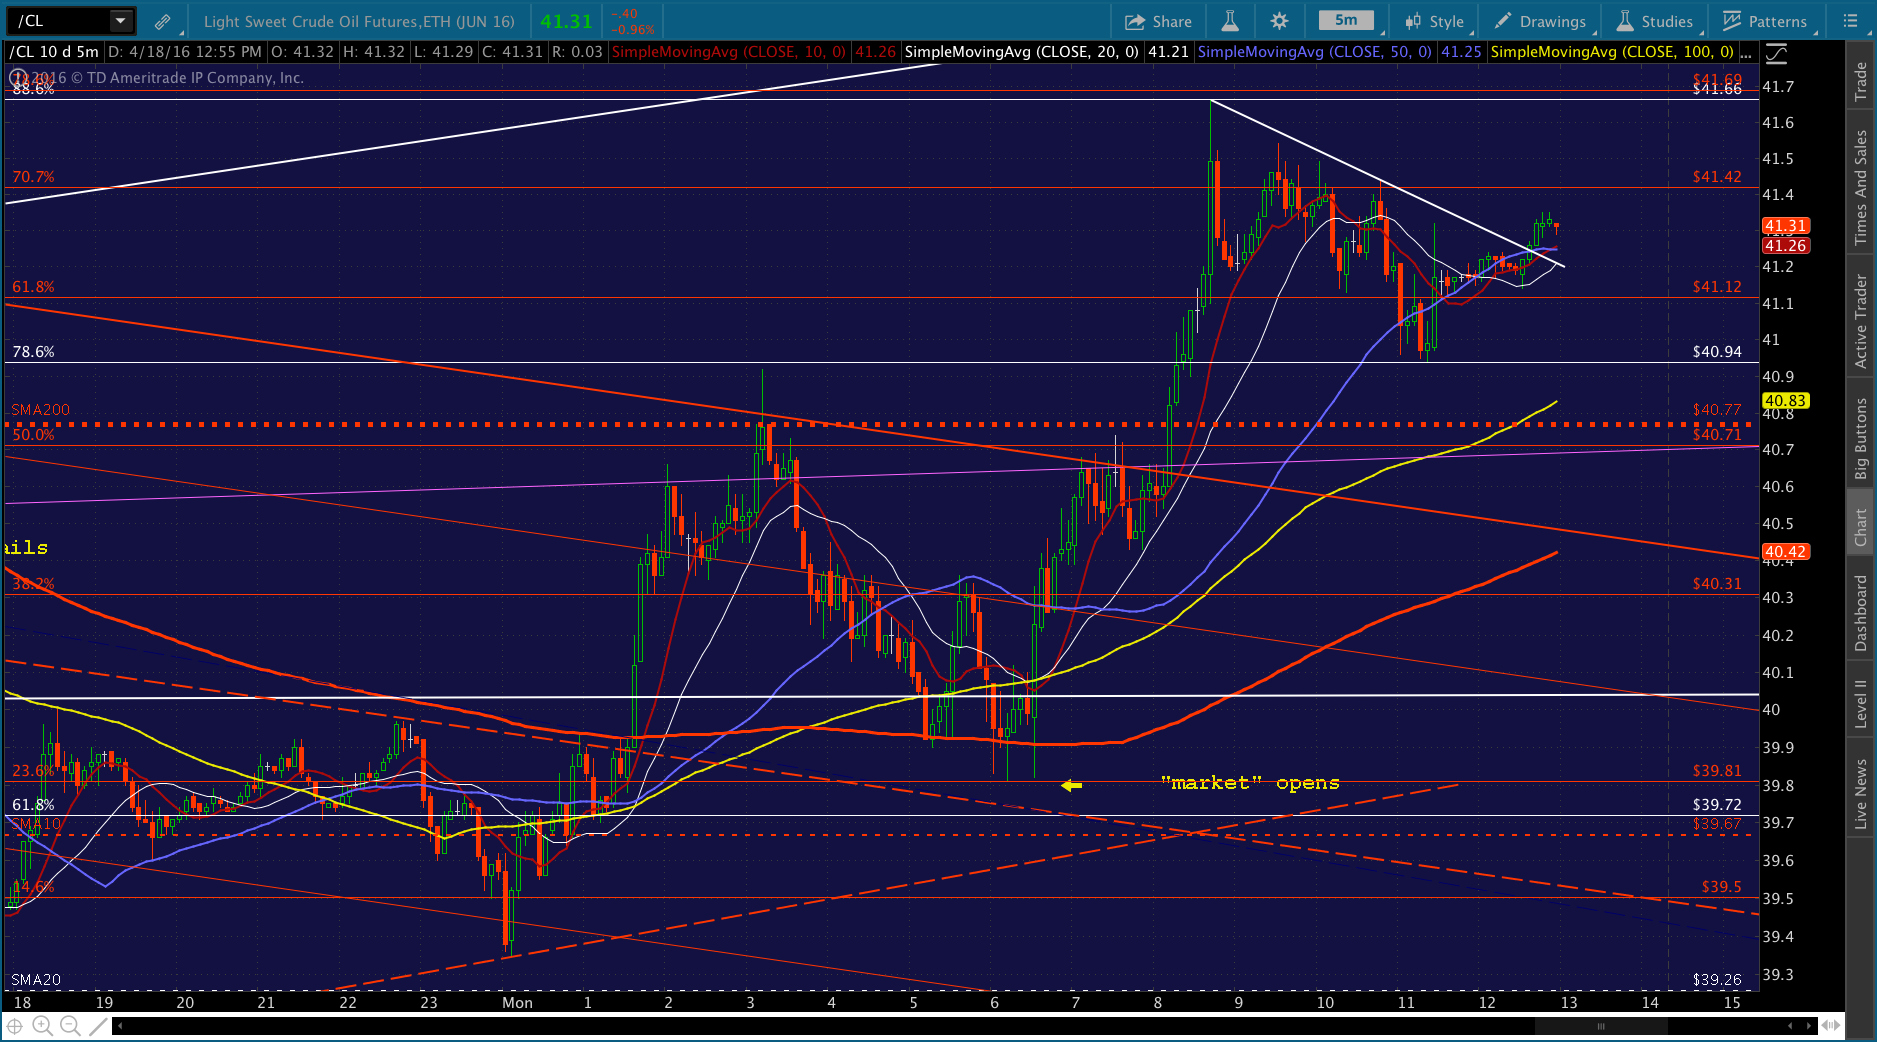
Comments
One response to “Charts I’m Watching: Apr 18, 2016”
So one of the things I’ve been kind of pondering is ‘If I were in charge of manipulating the markets, how would I do it’ and one of the things that makes sense to me is to always blow the channel lines by a bit. Then you run the stops and hopefully force a short squeeze melt up.