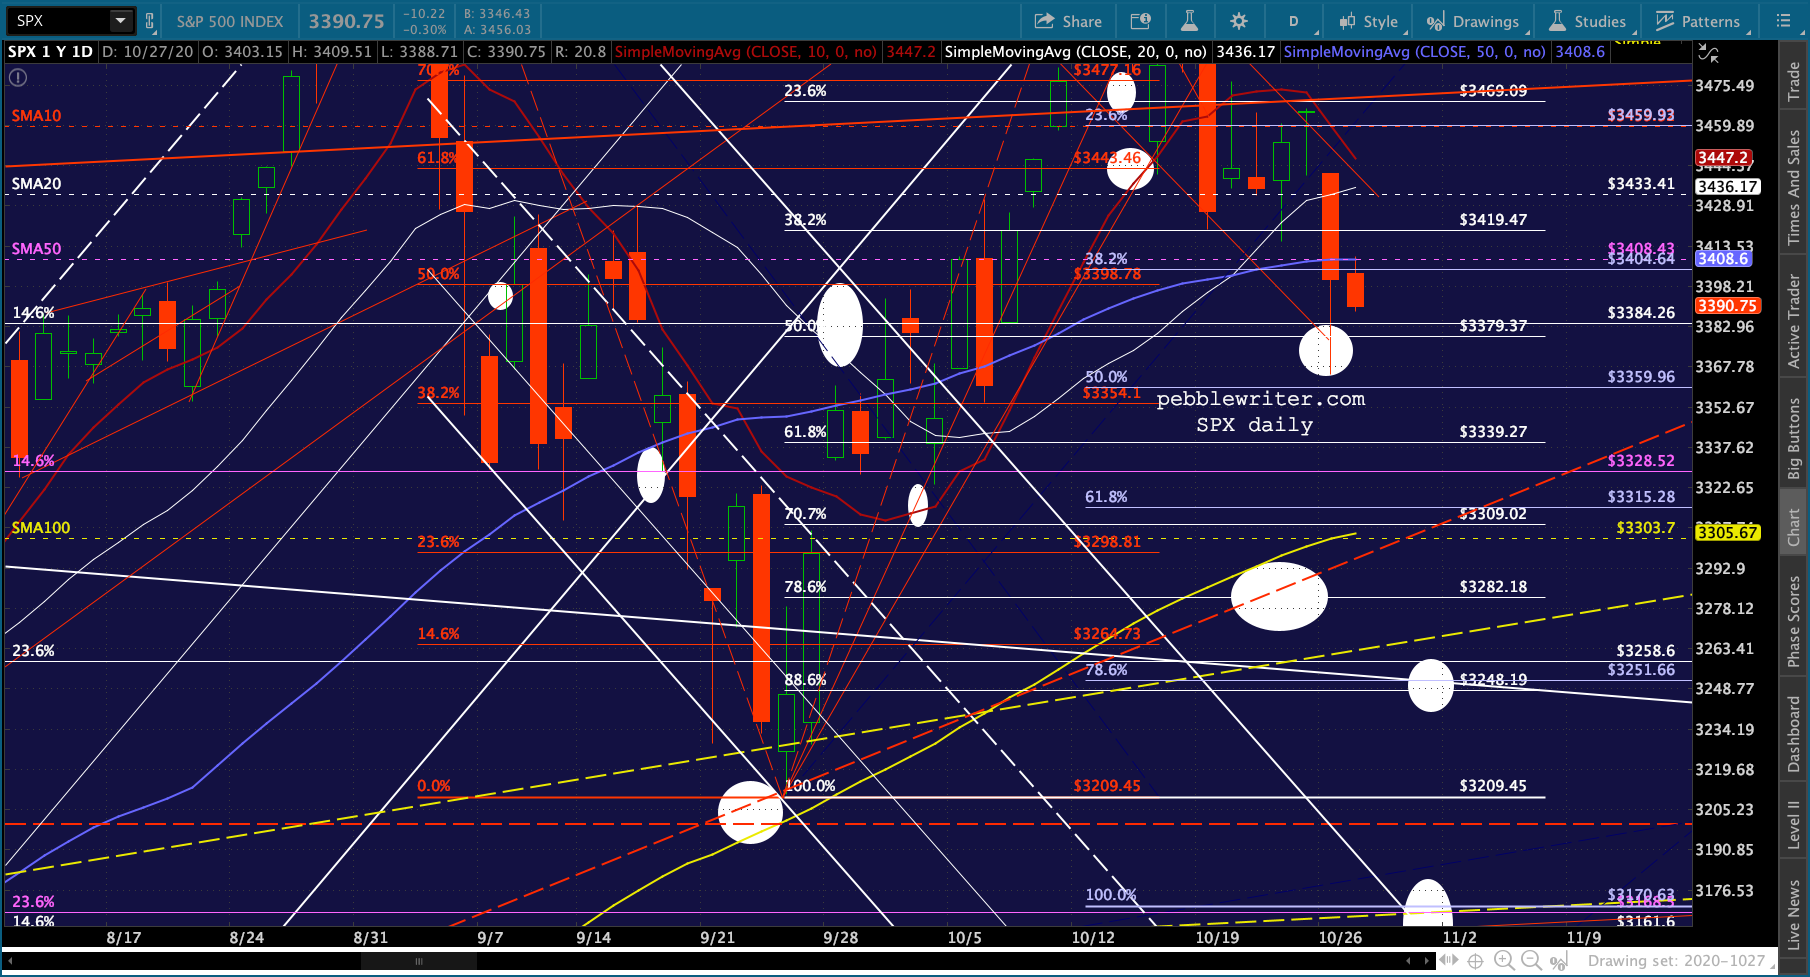
Despite better than expected economic data this morning, both ES and SPX have now seen their channels from last March break down. Most of the algo factors driving them have also broken down.
Unless Congress or the Fed pulls a stimulus rabbit out of their hats, things are going to get even messier going forward.
ES fell through our next downside target yesterday, reversing only after SPX had shed over 100 points and DJIA approached a 1,000-point loss… …and VIX tagged our next upside target.
 Note that while September Durable Goods Orders beat expectations, it has yet to regain its former highs.

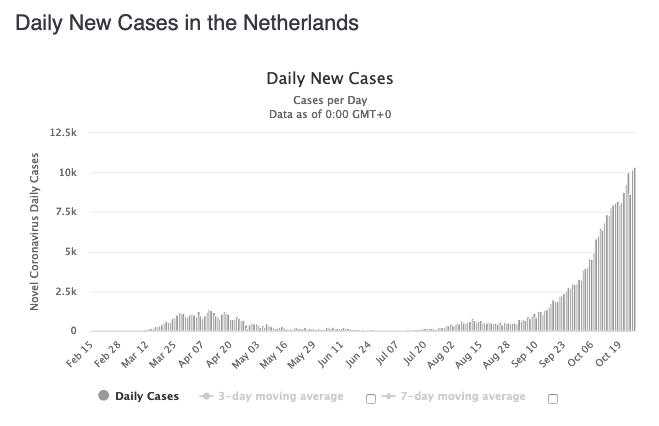
And COVID-19 cases and deaths continue to rise in most countries, with many posting alarming rates of growth and new all-time highs.



continued for members…
The bigger picture for ES and SPX shows a flag pattern or channel (in red) which came close to breaking down yesterday. Should it do so, the most likely outcome is a backtest of the broken falling white channel. A breakdown today could reach the .786 at ES 3271. If the red flag/channel holds, then we’re looking at ES 3329 by election day.


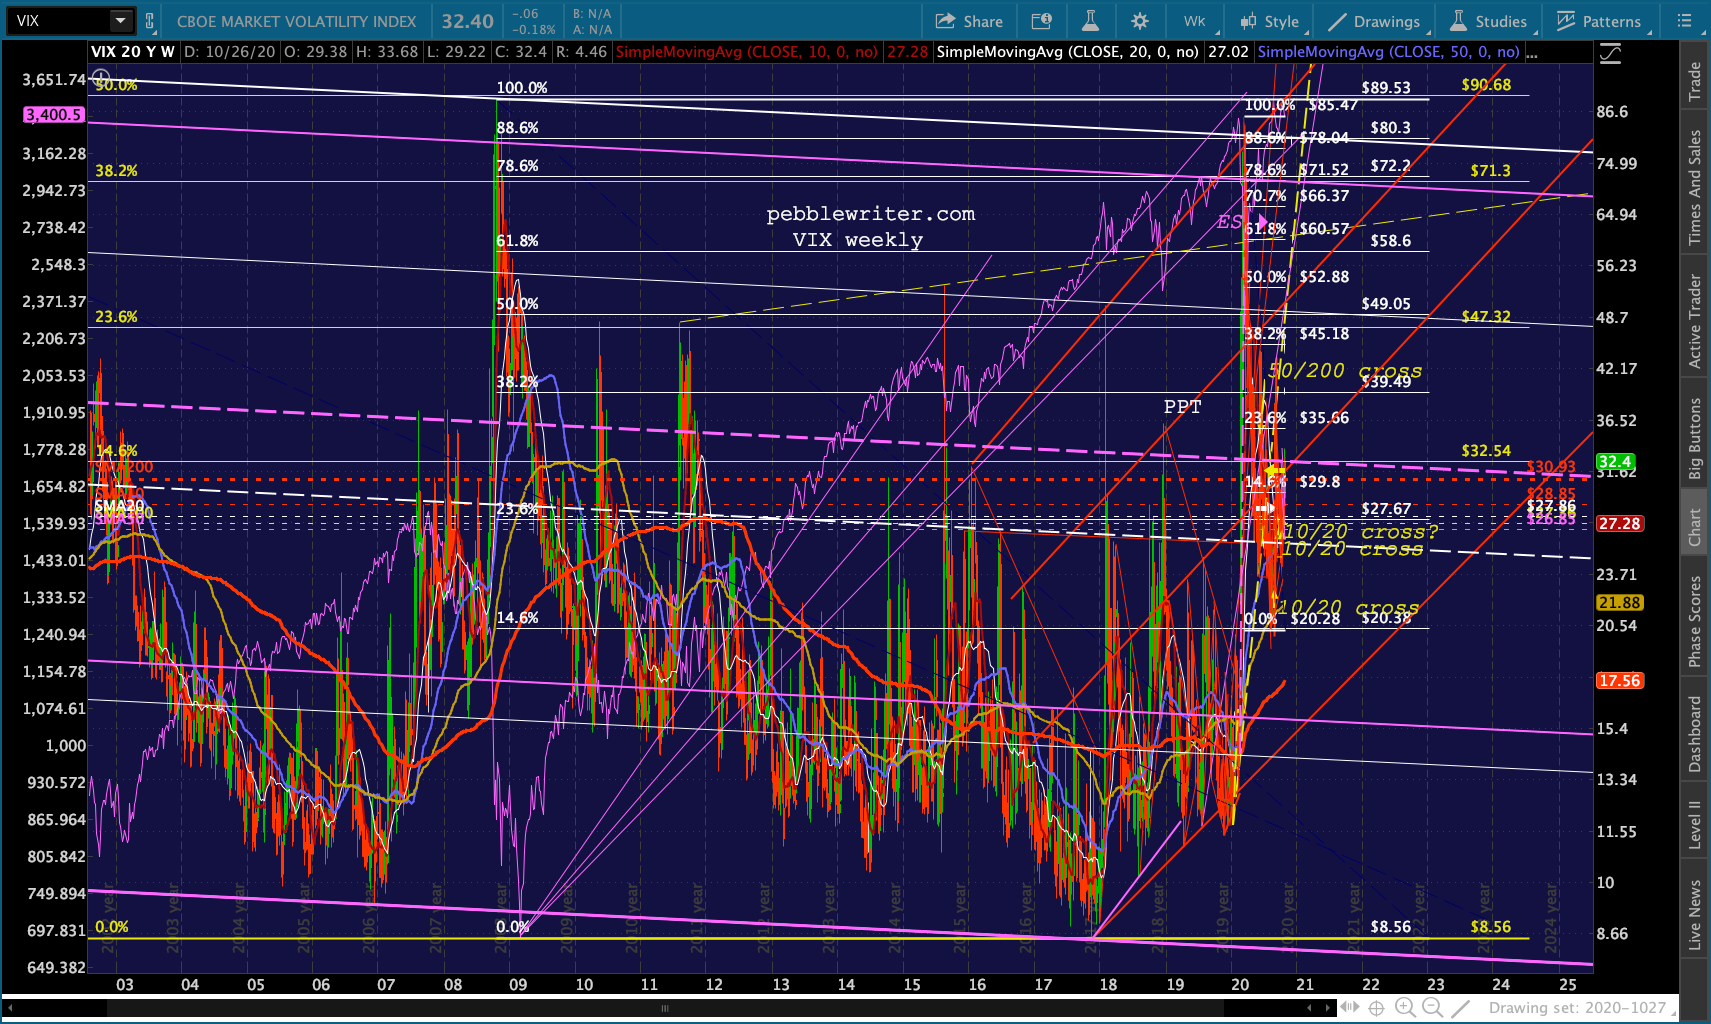
 VIX obviously remains in a bullish (bearish for stocks) 10/20 cross and should again test the rising white channel midline. In another 10 sessions, VIX could see a golden (50/200) cross.
 If VIX can punch through the rising white channel midline, the yellow .618 at 39.71 and the white .382 at 45.18 are obvious targets. 45.18 would also represent a backtest of the rising yellow TL from the January lows – as would the white .618 at 60.57, etc.
 The rising red channel should also be considered, with a midline running through the yellow TL at 49-50 around Nov 9.
 Note the dashed purple line running through the middle of the chart below at about 33 – VIX’s current level.
  This is the midline of VIX’s largest falling channel seen below – so it should be considered a significant threshold. Past rises above it have led to significant equity selloffs.
 USDJPY and DXY continue to look weak, with another leg down still in the offing for both…
 …as 10Y yields continue to fall.
 Note that ZN is back above 138’200 support.
 And, GC and SI continue to cling to SMA support. GC still has the better looking chart, with both the purple and red channel midlines aiding the SMA10/20 in support – but the rising SMA200 increasingly arguing for a backtest.
 While SI – having fallen below its rising white channel midline appears liikely to tumble to the channel bottom or even the red channel midline as the SMA200 reaches it in the next week or so.
 UPDATE: 3:55 PM
Not much progress yet, thanks to VIX’s hesitation and CL’s ramp job.


 The bulls need a rally, else SPX could see a bearish 10/20 cross tomorrow.