

The neat little falling channel guiding stocks lower since our Oct 12 top call [see: A Cure?] has broken down – slicing right through our ES 3329 target and accelerating toward our backtest targets. Every single one of the factors responsible for driving algos higher over the past 7 months is having a very bad day. Consider VIX, which blasted through its SMA200 and is closing in on our next upside target at 39.49…
 …or CL, which has dropped through our 38 target, opening up the path to 35.45 and lower.
 Given the impending lockdowns in Europe (and the fact that the US is only 2-3 weeks behind it in terms of case growth) and the lack of any stimulus package any time soon, the prospects for the market stabilizing are not looking good.
continued for members…The bigger picture for ES and SPX…
As we anticipated, ES has now experienced a bearish 10/20 cross: 3421.9 vs 3425.11 at this moment. If SPX does the same, it will drive additional algo selling. Only a sharp rebound today can prevent it.
 It’s a possibility. Remember that Monday’s initial drop also broke down below the channel bottom by about 12 points only to rebound strongly. This time, the overshoot is more like 40 points.


Note that the Dow should get another shot at the SMA200 it just missed on Sep 24.  CL’s daily chart shows the potential for a bounce at the falling white channel midline. Former big plunges like we’re seeing today have obviously been followed by stick saves, so it’s not too far fetched. But, note that a drop through the former lows at 36.52 isn’t all that far away.
 And, remember, our long-term chart suggests much lower lows.
 RB has less support at these levels, having already fallen below the Oct 2 and Sep 11 lows.
 The lockdown news and rumors out of Europe have done a number on the euro…
  …providing a bump for DXY that is more than offsetting the yen strength. But, it’s not the first time DXY has threatened a breakout – none of which have born fruit. I don’t believe this one will either.
 The USDJPY is dangerously close to its Sep 21 lows.
  It’s safe to say NKD’s rising wedge has broken down as expected, with the most obvious target still being the SMA200 currently at 21912. NKD’s SMA10 and SMA20 are currently exactly equal at 23494 with the SMA10 rolling over.
 DXY’s bounce – and the liquidity crunch now taking hold across markets – isn’t helping GC and SI much. GC is testing its dual channel midlines. If it doesn’t bounce soon, the SMA200 remains the obvious support.
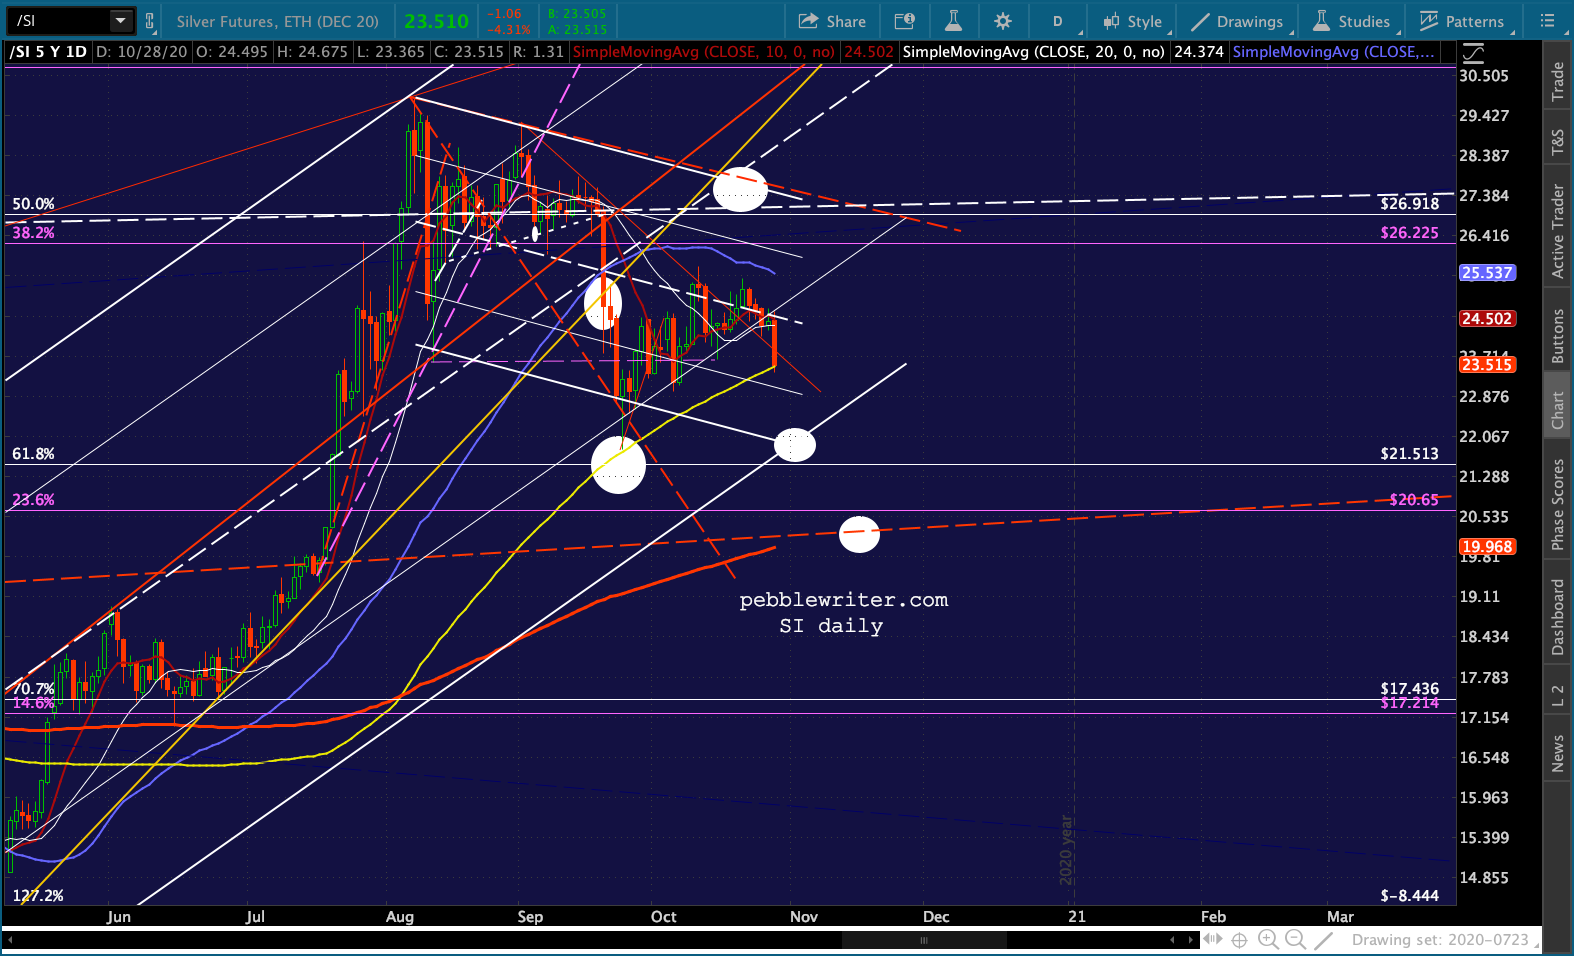
 SI continues to look weaker, but could catch a bouce here at its SMA100. If not, the white channel bottom at 21.91 and the rising SMA200 now at 19.967.
 Our yield curve model continues to suggest more downside – especially if/when the latest rising red TL breaks down.
 As TNX continues to drop, it will test the rising wedge bottom – currently at 72.5 bps.
  And, note that ZN is back above the 1.272 at 138’255.
 UPDATE: 12:00 PM
DJIA is bouncing shy of the SMA200. If we apply a Fibonacci extension to the index starting at Sep 3, we get a C=A target which is only 68 points away from the SMA200. Applying a falling channel to the pattern indicates a tag which could occur today, but actually intersects the SMA200 on Nov 5.
Since the SMA200 is currently falling, I think it’s important for bulls to get an actual tag. This would be a slight overshoot, so we won’t be surprised if markets freak out a little. A similar pattern drawn on ES shows a C+A target of 3152, ideally around Nov 5.
 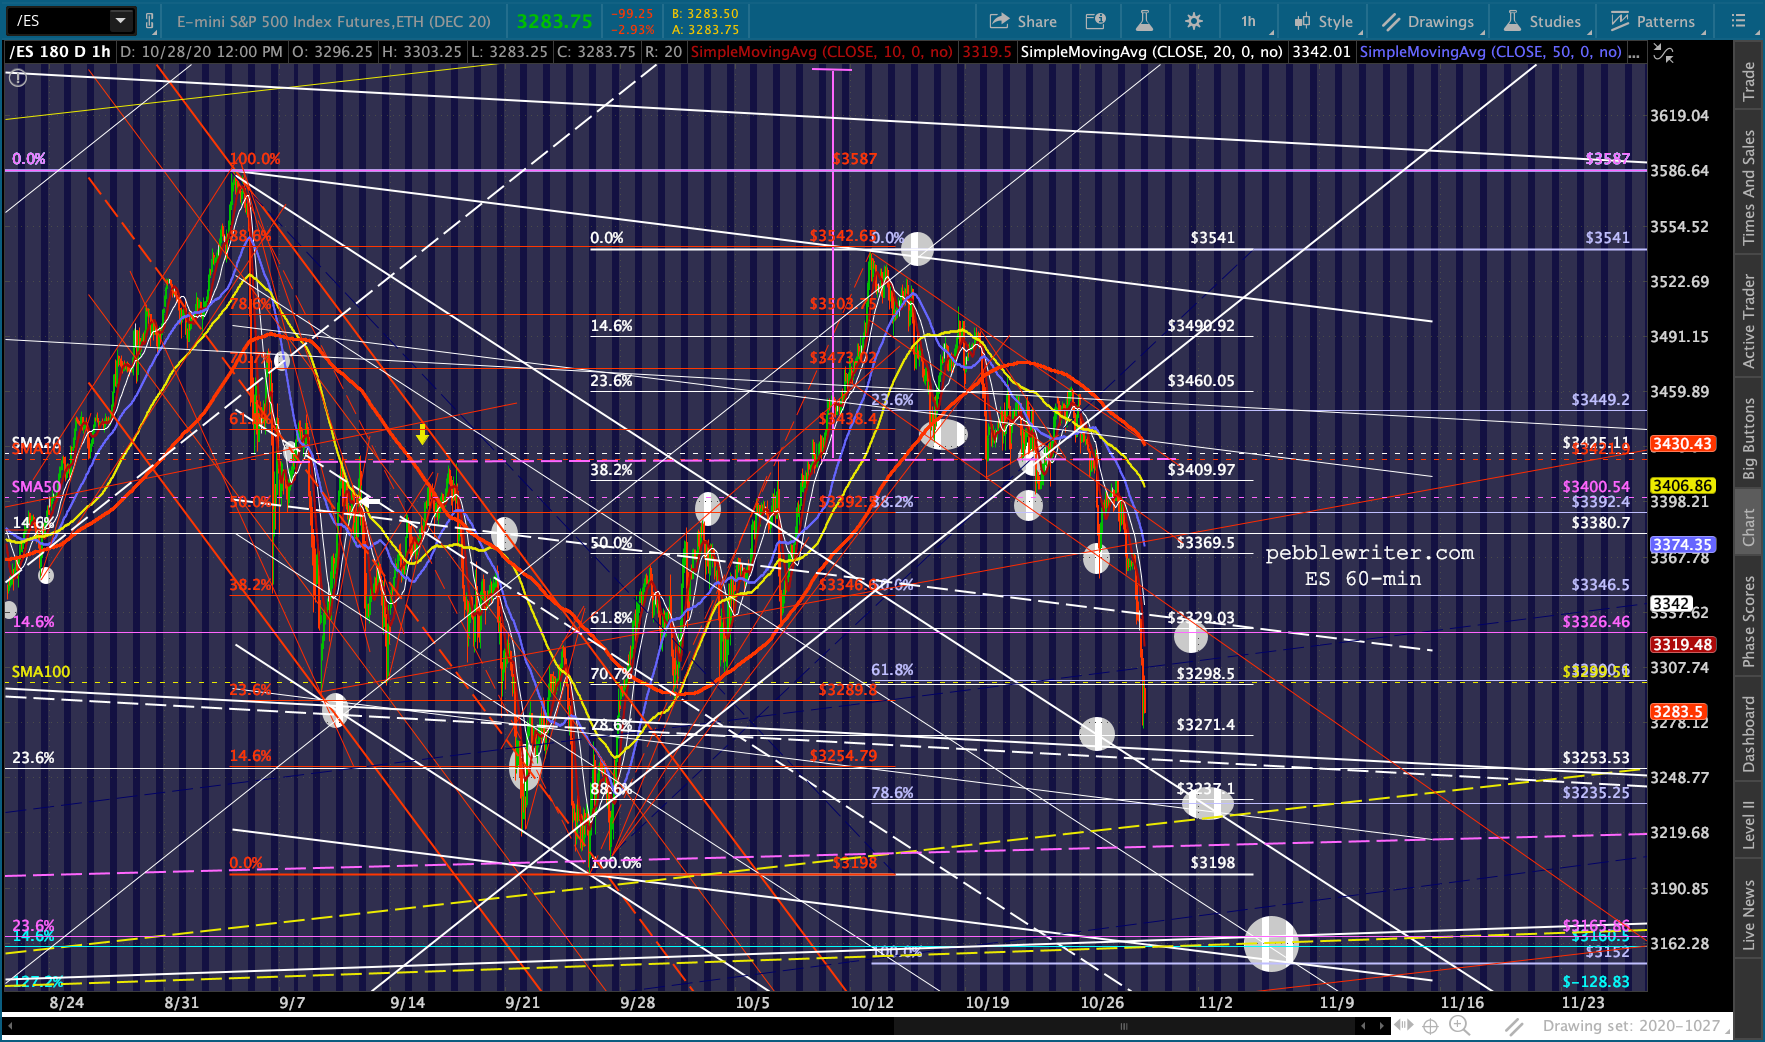 ES’ SMA200, however, is down at 3122 – not far from the 2.618 extension at 3076.93 which was never properly backtested following the June breakout. But, as we’ve discussed many times in the past, the TL connecting the 2018-2019 tops cuts through the current chart at about 3160 – very close to the 3152 target.
BTW, if we call that TL a channel top, the bottom of that channel cuts through the 1.618 extensions at 2155.93 in March 2021. This is the Fib extension that was almost tagged on March 23 when ES rebounded (19 points short) in response to the stick save of the DJIA – which had just reached its Nov 2016 election lows.

 I don’t know which of these targets will ultimately prove to be a bottom. But, they’re all laid out on the 60-min chart for those who want to follow along. Although I consider the Dow a worthless index, I suspect that it will again play an important role in signaling a bottom.
UPDATE: 3:45 PM
Coming up on the close and both ES/SPX still look likely to tag at least their .886s, with the C=A targets still looking good as well.

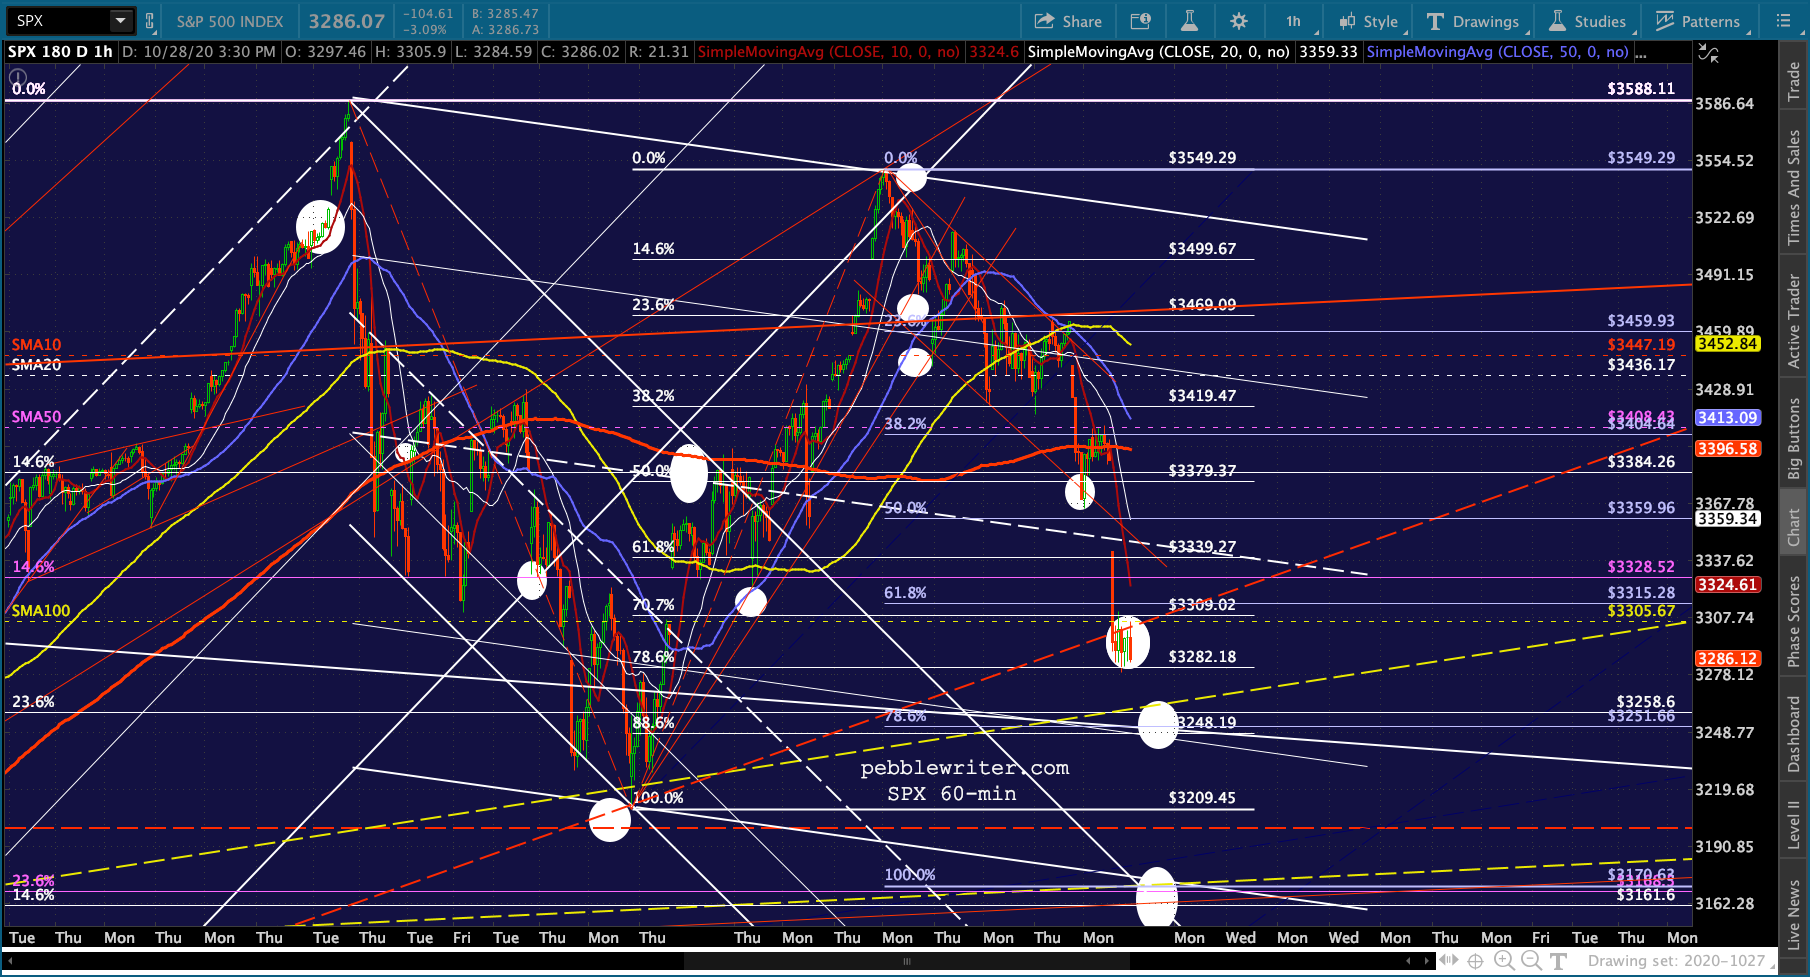
 I expect we’ll get more selling pressure going into the close – especially if DJI makes new lows.