

It’s only been three weeks since the stock market melted down [see: Rome is Burning] and only one week since the bond market melted down [see: Bond Market Debacle.]
Since then, both have recovered . The S&P 500 has risen over 700 points and the 10Y has shed 20 bps. So, the worst is over, right?
Then we see data such as the manufacturing outlook the Dallas Fed put out yesterday…
…and consumer confidence released on Monday…
…and the doubts seem pretty well justified.
In our last Big Picture post in November 2024, we turned to technical indicators to suggest when it would make sense to get bearish – identifying the 50-day moving average which repeatedly (6 times!) sounded the alarm over the next several months before the market finally collapsed in February.
What do the technicals suggest now that Trump’s tariff policy has been universally derided as an economic disaster for the US and its trading partners? Can markets recover while the Trump chaos we warned of has wrapped its tentacles around the global economy?
continued for members…
We’ll start with the bond market, which has always been a pretty unimpeachable indicator of capital flows. 10Y yields fell pretty sharply as investors shunned the faltering stock market. Higher demand/prices results in lower yields.
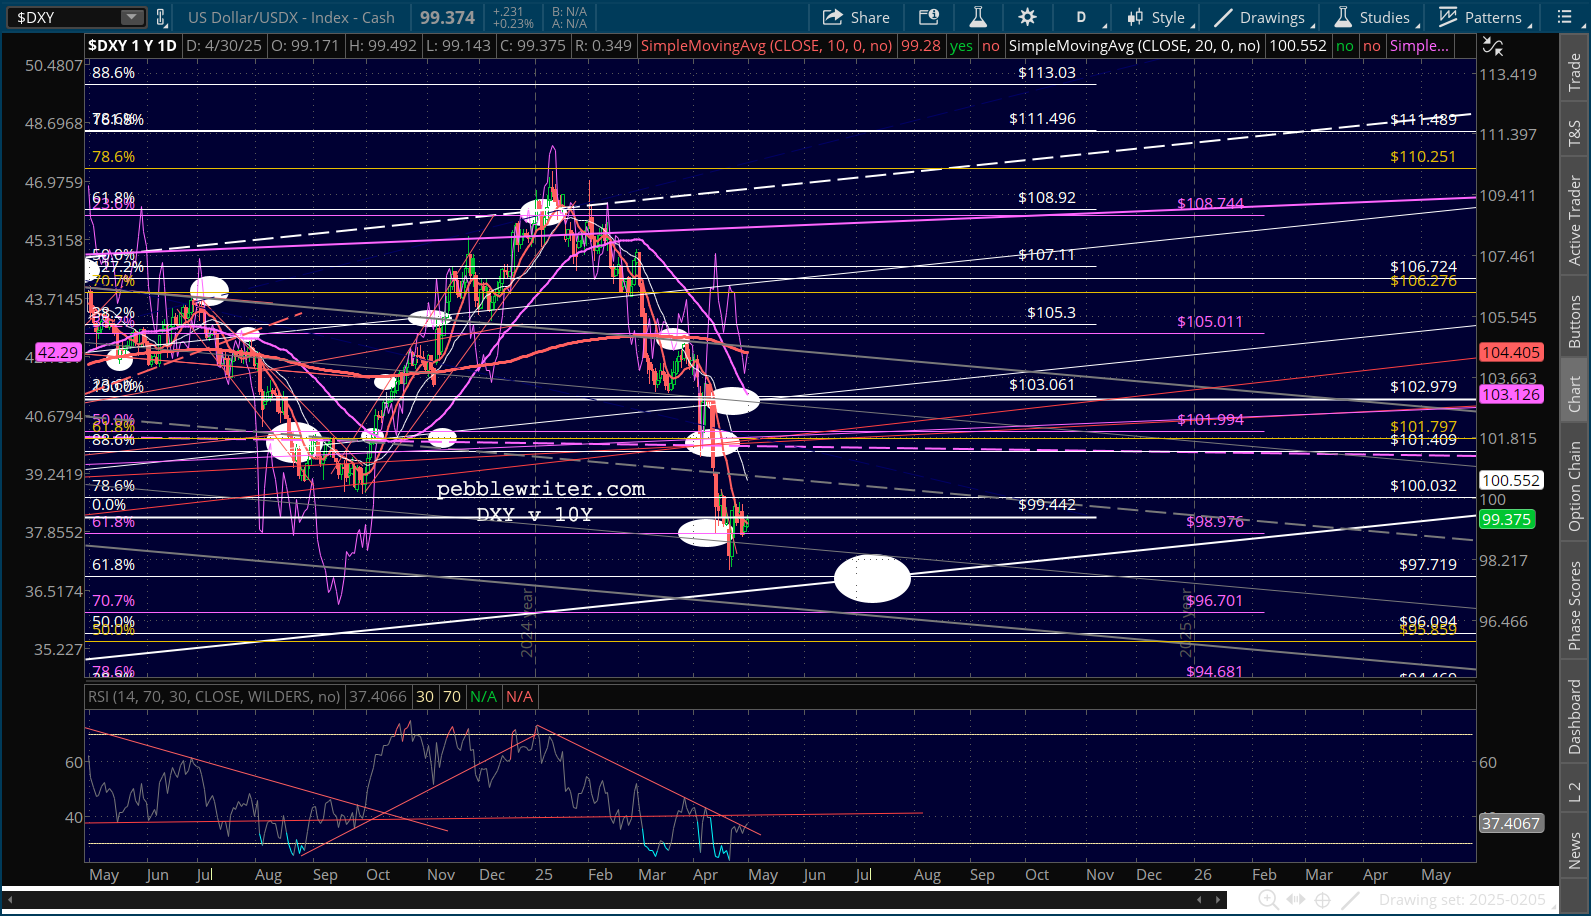
 Then something very unusual happened. Between Apr 4 and Apr 11, 10Y yields soared from 4.0% to 4.6% and the DXY plunged 4%. This means that investors were simultaneously selling treasury bonds and the US dollar. Not just any investors, but foreign investors were deserting the instruments which were supposedly the safest in the world in the midst of a stock market correction. Why?
 Aside from the fact that Trump had
 alienated pissed off countries all around the world, there was suddenly less trade coming down the pike. When a US entity buys goods from China ($439 billion in 2024), it sends US dollars into the Chinese economy. A good portion of those dollars is typically invested in US treasuries.
When that trade is essentially cut off, the flow of dollars into China shuts down and we get a simultaneous decline in demand for US dollars and US dollar denominated instruments – something that the Trump administration had apparently never considered.
It alarmed them so much that Trump suddenly backtracked on tariffs – retroactively exempting smartphones and computers from the 145% tariff announced a few days prior. AAPL shares soared 25% between Apr 8 and Apr 14. SPX spiked almost 500 points in a single day.
Since then, various companies and industries have received tariff relief, often as the result of political donations as was the case in Trump’s first term. But, tariffs remain an issue for the vast majority of companies which import, source materials and/or manufacture their products overseas. This will obviously put pressure on earnings. But, it will also continue to affect the bond market and currencies – even after tariffs are discontinued.
Let’s face it – US corporations manufacture and source in places like China, Vietnam and Cambodia because it’s much cheaper. Those which are forced to move manufacturing to the US will have to eat higher costs, meaning lower margins/profits combined with higher prices to consumers – the main ingredients of stagflation.
Although many corporations are announcing new manufacturing facilities in the US, how many follow through with these plans? Can we really expect a CEO to move their plant 10,000 miles and incur much greater ongoing costs based on the executive order of a president well into his second term? There’s a very good chance that Congress will flip in the midterms. What will that do to Trump’s ability to rule by EO?
We can’t know how much of a correction would be required to result in another “Trump put.” The first one occurred on Apr 7 when both the DJIA and SPX tested their Jan 2022 highs. Will Trump allow another test of the Apr 7 lows? Or, will he facilitate a meltup such as that which followed the COVID lows that continues until the markets are simply too rattled by a future data print?
Given all these questions, this Big Picture forecast comes with a massive caveat: they are absolutely subject to the continuation of Trump’s tariffs. If he backpedals, reverses, or changes the terms enough, the risk is to the upside – at least short term. If he sticks to his guns, the risk is very much to the downside – at least until the markets force him to blink again.
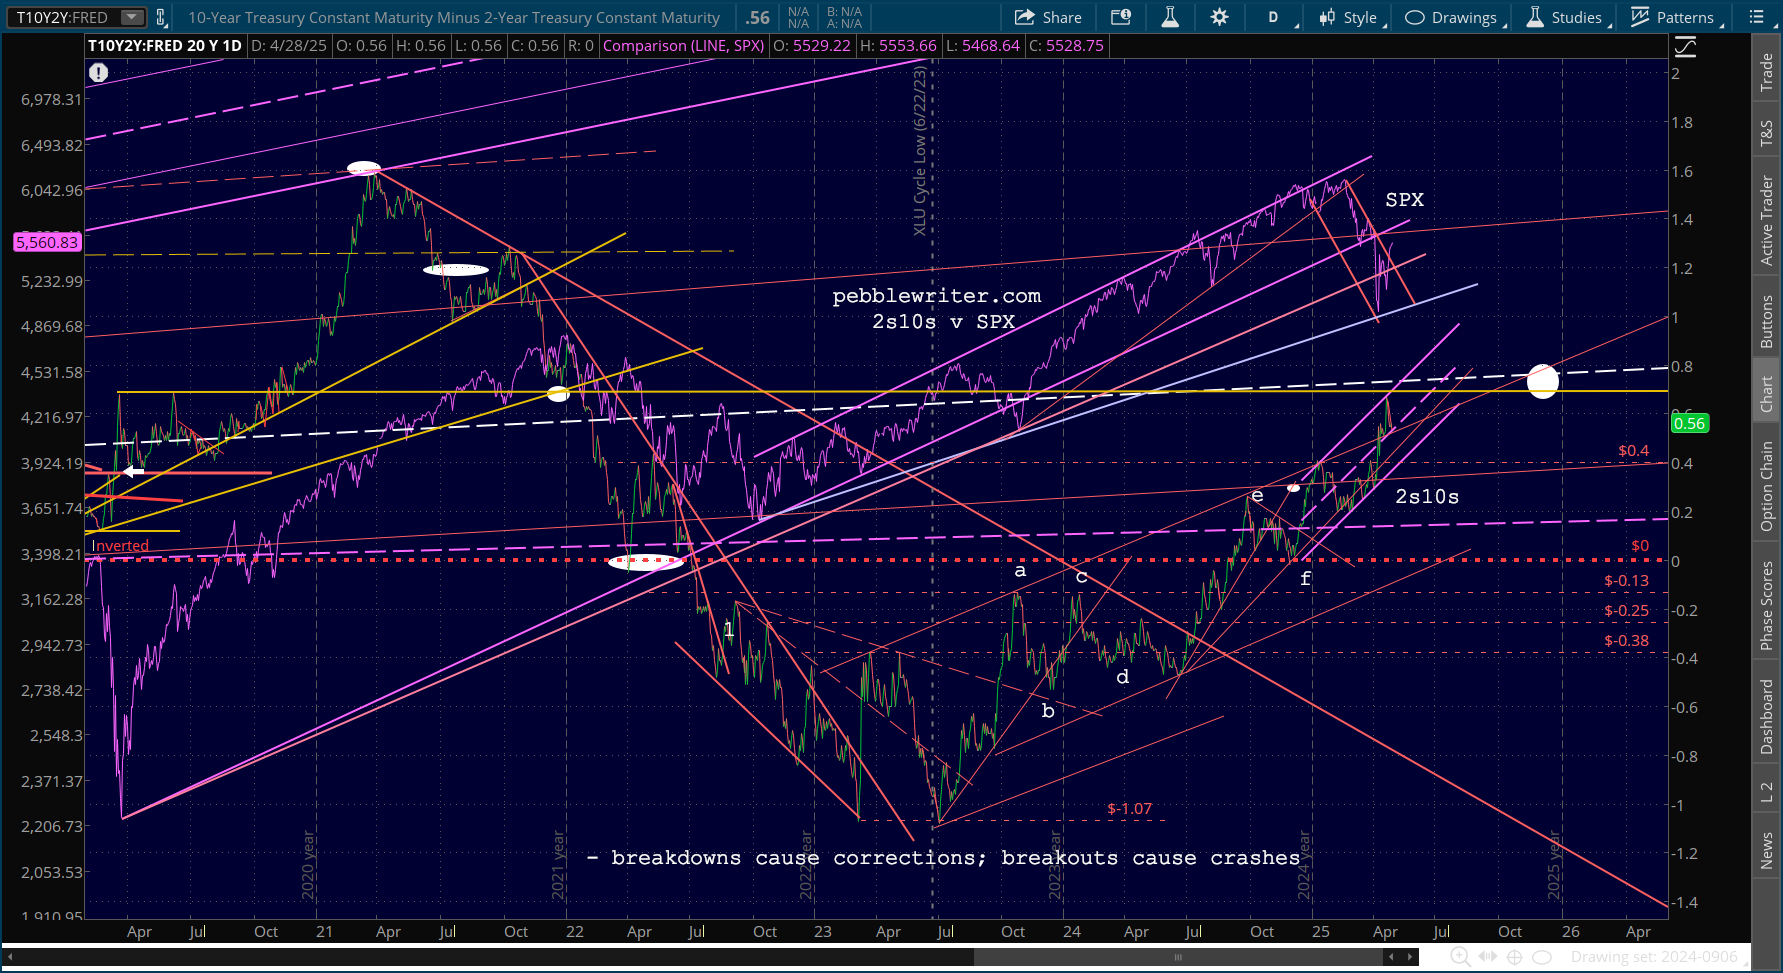
With that caveat, let’s revisit our fixed income models starting with the 10Y cycle. Roughly every 5 1/2 years, the 10Y makes a significant low at the bottom of a huge falling channel. The only times it missed by much since 1998 were in 2008 when a significant low was followed by an even lower low and in 2020 when the target yield at the bottom of the channel would have been -0.25%.
 The lows typically corresponded with stock market lows – a result of the fear trade referred to above. The next cycle low is officially due in Feb 2026, meaning it could occur any time between Oct 2025 and Apr 2026. The previous two cycle lows were roughly 5 months early, so I’ll go with Oct 2025 as our base case. The trick is figuring out where it will bottom and why.
The 10Y broke out of this falling channel in Apr 2022 (with CPI over 8% on its way to 9.1%) and has since rallied from 0.40% to 5.0%.
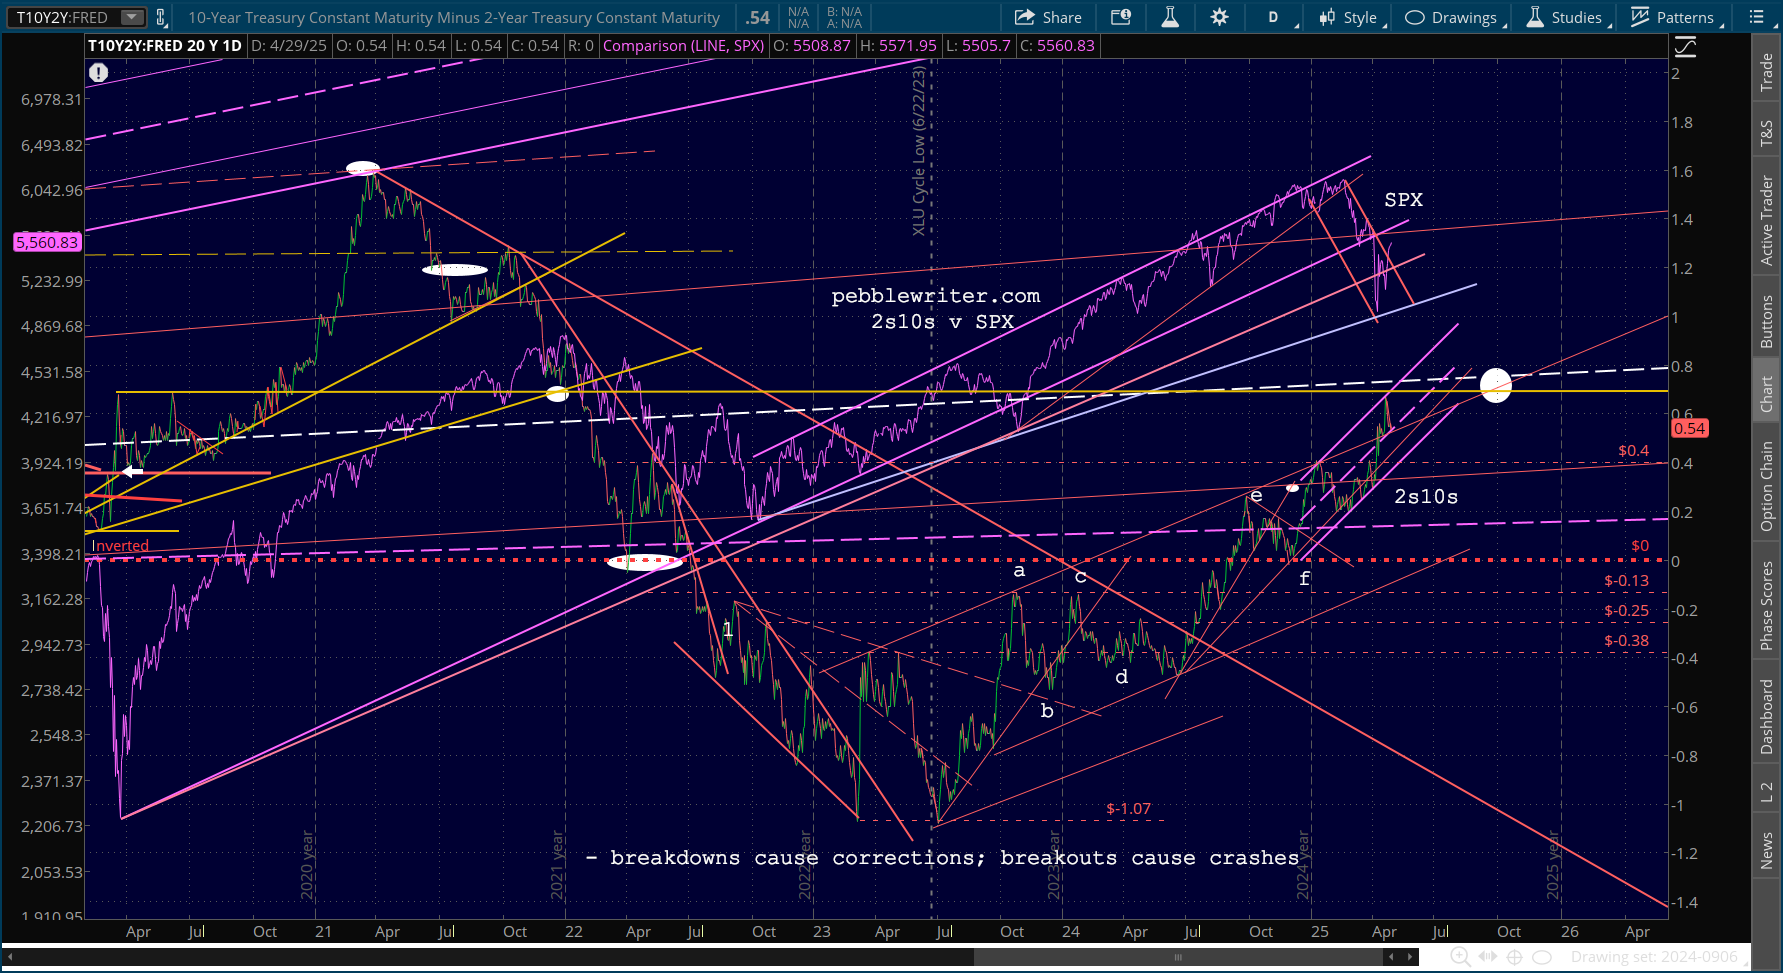
 In so doing, it reached the white 1.618 Fib extension of the drop from the 3.25% high in Oct 2018. A drop to that yield in October would work well as a backtest and would intersect with the falling purple channel bottom and red 1.272 Fib extension.
 This drop would almost certainly correlate with an equity selloff and/or recession as a meaningful rise in yields has been made less likely by the recent drop back through the SMA200 into the falling red channel.
The timing would also correlate with the confluence of TLs of support for the 2Y and 10Y. …and the intersection of horizontal resistance and the top of the rising red channel for the 2s10s around that same time.
 Note that RBOB also made significant lows in Sep/Oct 2024, producing -15% YoY drops in gas prices. Therefore, the odds of another inflationary bump at about that same time are elevated – unless gas prices have tanked at about that same time.
If we proceed with the assumption that the 10Y is going to drop substantially as a result of an equity selloff, then it stands to reason that the 2s10s will continue to rise – further escalating the seriousness of the equity selloff. It’s a circular phenomenon which, in the past, hasn’t resolved very quickly/easily without Fed intervention.
As we’ve discussed countless times, the Fed would be unable to step in due to the inflation unleashed by Trump’s tariffs, at least until the economy slowed so significantly that higher inflation was no longer a concern. This, of course, takes time.
I don’t believe that most countries will strike deals with the US, particularly if the US stock market is tanking. They have already learned that Trump will back down if the market drops enough. His “put” is a tariff policy change, one which will benefit them. So, they have little incentive to reach a quick and painful (for them) deal. Again, this reinforces the idea that we’ll see a significant equity selloff before long – one which is likely to test the Apr 7 lows.
Here’s an updated set of charts based on the above as of Wednesday morning, Apr 30.


Note: March PCE just came out. Though the seasonally adjusted YoY number (2.3%, 2.6% ex food and energy) is fairly tame…
 …the MoM print is very concerning…
 …especially since Q1 GDP fell 0.3% YoY versus +0.4% expected and versus Q4 2024 of +2.4%. Imports soared 41.3%
Stay tuned…